
ABSTRACT
Urban systems are not only major drivers of climate change but also the impact hotspots. In the context of the planet currently undergoing a process of greenhouse warming, and simultaneously predominantly urban based ever continuing population growth, our agglomerations became vulnerable to chain reactions triggered by climate related hazards. Hence, the reliable and cost-effective assessment of future impact is of high importance. While the climate community has invested significant effort to provide downscaling techniques yielding localized information on future climate extreme behaviours, these methods do not remain widely exploited in the process of urban planning. In this work, we discuss the underlying reasons and main challenges of the applicability of downscaling procedures in the real process of urban planning. This paper attempts to help bridge the gap between the communities of urban planners and climatology. In the beginning, we summarize the rationale for such cooperation, supporting the argument that the scale represents an important linkage between urbanistic and climate science in the process of designing an urban space. Secondly, we introduce the main families of downscaling techniques and their application on climate projections, also providing the references to profound studies in the field. Thirdly, special attention is given to previous works focused on the utilization of downscaled ensembles of climate simulations in urban agglomerations. Finally, we identify three major challenges of the wider utilization of climate projections and downscaling techniques, namely: (i) the scale mismatch between data needs and data availability, (ii) the terminology, and (iii) the IT bottleneck. The practical implications of these issues are discussed in the context of urban studies.
1. Introduction
In the warming world, we are witnessing an urban population boom and an increasing number of megalopolis areas (Yang, Citation2007). Projections indicate that by 2050 urban systems will be home to 66% of the global population, representing 6.3 billon urban dwellers (United Nations [UN], Citation2014). Urban systems act as important economic hubs and, as such, they provide its inhabitants with higher quality of life, including health, cultural and psychological aspects (Murray, Citation2011). Urbanized areas are not only major drivers of climate change (CC), but are simultaneously hot spots of CC impact, and many of the world’s agglomerations are located in areas highly exposed to multiple hazards (Akbari, Konopacki, & Pomerantz, Citation1999; Haigh & Amaratunga, Citation2012). CC impacts on urban systems may cause the stagnation of the state or entire country (Malakar & Mishra, Citation2017). Climate change has major economic consequences in the form of reduction in labour productivity, disruption of transport systems and significant losses in energy production and its supply chains (Confalonieri et al., Citation2007). Mortality due to natural disasters is highest in developing countries, while overall economic damage is greatest in developed regions (Kousky, Citation2014). However, economic development significantly decreased disaster damage (Choi, Citation2016).
All the above-mentioned illustrates the importance of CC impact assessment in urban contexts. While impact assessments are commonly based on the output of state-of-the-art GCM-RCM simulations (Regional Circulation Models nested within General Circulation Model) providing information at scales varying between 12.5 and 50 km, the process of urban planning operates with finer scales exploiting detailed knowledge of neighbourhoods sometimes even at sub-street level. The GCM-RCMs are numerical coupled models describing atmosphere, oceans, land surface, sea ice and interactions among those earth systems. Those models remain essential tools to assess climate change (Fowler, Blenkinsop, & Tebaldi, Citation2007). However, their coarse resolution and inability to resolve sub grid scale features limits their usability. A large portion of impact studies operates on scales finer than common resolution of global or even regional model outputs (Wilby et al., Citation2004).
The strong need for higher resolution climate data for impact assessment is a long time well-known issue (e.g. Cohen, Citation1996; Kim, Chang, Baker, Wilks, & Gates, Citation1984). This interest originated in the recognized discrepancy of course resolution GCMs (hundreds of kilometres) and the scale of interest of impact studies (an order or two orders of magnitude finer scale) (Hostetler, Citation1994). The impact applications are highly sensitive to local climate variation, and as such they require information proportional to the point climate observations. The fine-scale variations are parametrized in lower resolution models. The requirement of fine-scale information emerges particularly in regions of complex topography (Giorgi et al., Citation2001; Mearns et al., Citation2003; Wilby et al., Citation2004). Describing areas where information is needed in more detail, authors typically provide examples such as coastal areas, river mouths, islands or mountain regions. Until today, urban systems are not explicitly mentioned on such lists, even though they fulfil the requirements of the above definition (considering the term ‘topography’ in a broader sense).
When choosing an appropriate adaptation strategy, scale interdependency should be considered. Certain approaches (e.g. green roofs) provide micro-scale benefits, where most of the advantage is given to selected stakeholders concentrated in the vicinity of building rooftops. On the contrary, urban planners should be aware of synoptic and global climate change because this may significantly narrow down the portfolio of applicable micro-scale solutions (Georgescu et al., Citation2015). For instance, in urban systems periodically exposed to dust storms, the effect of installation of highly reflective roofs will be significantly lowered by the decrease in albedo due to fine particle deposition (Getter & Rowe, Citation2006). Moreover, climatological impacts occurring at a larger scale may unexpectedly influence a metropolitan system. For example, high reflectivity can detrimentally influence a hydrology cycle in an urban area and as such cause a decrease in regional-scale precipitation (Bala & Nag, Citation2012). Georgescu et al. (Citation2015), clearly states that not all adaptation and mitigation measures should be given an equal weight across all spatial scales. In addition, there is still demand for deeper analysis, tool development and coordinated efforts, which should rise from the collaboration between global climate and urban communities and related disciplines.
GCM-RCM outputs are still insufficient for the analysis of many regional and local climate aspects, such as extremes. GCMs of very high resolution would indeed improve the simulations of regional and local aspects (Christensen, Carter, Rummukainen, & Amanatidis, Citation2007), but they remain unreachable due to the enormous computational cost (Fowler et al., Citation2007), which leads to the accommodation of downscaling techniques (Rummukainen, Citation2010).
The main aim of this paper is to contribute to closing the gap between various involved urban expert stakeholders – the communities of urban planners, climatologists, and policy makers. By providing the pointers towards appropriate tools and information sources we hope this work might serve as a shortcut to anyone new in the field of future climate impact assessment at a local scale. We also summarize crucial aspects and discuss some practical bottlenecks, which are seldom addressed in scientific literature, thus assisting with an initial phase to everyone facing the challenge of long-term urban adaptation planning.
The paper is organized as follows: in the Introduction, we recapitulate the problem background and the growing importance of CC impact on urban systems. Furthermore, tendencies towards fine scale, but simultaneously long term adaptation and mitigation planning are covered, thus justifying the utilization of climate projections and their derivatives delivered by downscaling techniques. In Section 2 we provide a general overview of the main broad families of downscaling techniques, including references to extensive works in the field. Their discussion focuses on the methods of statistical downscaling due to their utility, and the pros and cons of individual approaches are also discussed. In Section 3 emphasis is given to recent advancement in urban studies incorporating climate projections illustrating the variety of current approaches. The Discussion section is devoted to the applicability of climate data to urban planning practice, including a discussion on three practical bottlenecks of the wider utilization of downscaling techniques in impact assessment in context of urban space, namely scale mismatch, terminology and IT issues.
2. Downscaling of climate projections
Principally any data can be refined by downscaling techniques (Rummukainen, Citation2010). Coarse GCM output might be satisfactory, for example when the variation within a single grid cell is low or in case of global assessment. The main advantage of information directly obtained from GCM is the certainty that physical consistency remains unattached (Mearns et al., Citation2003). GCMs are valuable predictive tools, but they cannot account for fine-scale heterogeneity and reflect on features like mountains, water bodies, infrastructure, land-cover characteristics, convective clouds and coastal breezes. Bridging this gap between the resolution of climate models and regional and local scale processes represents a considerable challenge. Moreover, the uncertainties that characterize the GCMs/RCMs are generally aggravated when these models are downscaled, which is the crucial step for identifying the city-specific impacts and, consequently, to identify vulnerabilities. Hence, the climate community put significant emphasis on the development of techniques for downscaling (Fowler et al., Citation2007).
There is no consensual and unique classification scheme to be applied in attempts to comprehensively review and summarize the downscaling techniques. In many studies (e.g. Fowler et al., Citation2007; Khan, Coulibaly, & Dibike, Citation2006; Trzaska & Schnarr, Citation2014), the methods are categorized into two main groups: Dynamical downscaling and Statistical downscaling. Dynamic downscaling is based on RCMs or fine spatial-scale numerical atmospheric models, such as Limited Area Models (LAM) (Feser, Rockel, von Storch, Winterfeldt, & Zahn, Citation2011; Fowler et al., Citation2007). Statistical downscaling is based on observed relationships between climate at fine and coarse resolutions that are used to transform global climate models’ output to finer resolution. Alternatively, Mearns et al. (Citation2003) distinguish three groups of approaches: High resolution GCMs; Nested LAM and RCMs; and Empirical/Statistical and statistical/dynamical methods. Within the group of Statistical downscaling, many approaches can be distinguished and classified according to different criteria. For example, Wilby et al. (Citation2004) provide background information and guidance on the application of some Statistical downscaling methods, but also listed alternatives to downscaling techniques (thus somehow excluding those from the family of downscaling methods) including spatial interpolation of grid points (sometimes named ‘unintelligent downscaling’), climate sensitivity analysis (frequently addressed as bottom-up approach), spatial/temporal analogues using historical data and simple change factor (known as Delta method). Giorgi et al. (Citation2001) provide a survey of statistical downscaling techniques focusing on studies published between 1995 and 2000.
2.1. Dynamical downscaling
In a nutshell, dynamical downscaling represents a group of methods originally used in numerical weather forecasting (Rummukainen, Citation2010). The first studies establishing the foundation of regional modelling are Dickinson, Errico, Giorgi, and Bates (Citation1989) and Giorgi and Bates (Citation1989). Since then, the field has undergone massive development (e.g. Christensen et al., Citation2007; Feser et al., Citation2011; Giorgi et al., Citation2001; Hong & Kanamitsu, Citation2014; Xue, Janjic, Dudhia, Vasic, & De Sales, Citation2014; Yuqing et al., Citation2004). Dynamical models address data and physical processes equivalent to GCMs, but at finer scales, and provide results only for selected limited regions of the globe (Trzaska & Schnarr, Citation2014). RCMs utilize the same physical-dynamical definitions of the key climate processes as GCMs. Atmospheric fields representing the output of a global model (e.g. surface pressure, wind, temperature and humidity) are loaded into vertical and horizontal boundaries of the RCM. Administering of boundary conditions represents a major challenge of dynamical downscaling (Rummukainen, Citation2010). The physics-based equations and locally specified data are used to gain regional climate outputs (Trzaska & Schnarr, Citation2014). The unresolved inner-cell variabilities are pushed to RCM output rather than fully taken into account. All the inner-cell fine scale processes are approximated in a procedure called parametrization (Rummukainen, Citation2010).
Two major streams are recognizable in dynamical downscaling. In the first, the resolution is increased over the entire domain of the atmospheric global model (e.g. Christensen et al., Citation2007). The second strategy is based on the utilization of a global model with variable grid cell size (Fox-Rabinovitz et al., Citation2008; Lal, McGregor, & Nguyen, Citation2008). This technique maintains a coarse grid over the majority of the globe, but increases the resolution within a particular area of interest (Rummukainen, Citation2010).
The earlier RCMs resolution used to vary between 100 and 50 km, and at its best 25 km grid cells (Rummukainen, Citation2010). The more recent development proved that RCMs are capable of delivering high resolution results (20 km or less) (Leung, Mearns, Giorgi, & Wilby, Citation2003; Mearns et al., Citation2003). Consequently, increasing resolution also entails increasing computational cost and data volume. RCMs also require a high level of expertise to interpret the results. Moreover, the RCM experiments require high frequency (e.g. 6 hours) GCM fields supply for boundary conditions. These data are not usually stored due to mass-storage demand (Mearns et al., Citation2003). Due to these practical limitations, the regional dynamical downscaling models remain out of reach for a vast majority of researchers. Accordingly, the emphasis in this paper is given on the application of statistical downscaling techniques.
2.2. Statistical downscaling
Statistical downscaling, also known as ‘Empirical/statistical’ or ‘Statistical/dynamical’ downscaling (Mearns et al., Citation2003), is based on the perspective that regional climate is mainly conditioned by two factors: the large-scale climate and the local/regional features such as topography, land-sea distribution or land use (Fowler et al., Citation2007; Mearns et al., Citation2003; von Storch, Citation1999; Wilby et al., Citation2004). The large scale climate variables are used as ‘predictors’ to regional or local variables named ‘predictands. Fowler et al. (Citation2007) expressed the essence of the idea of statistical downscaling as the following descriptive equation:where R represents the local climate variable which is subject to downscaling, X is the set of large climate variables, and F is a function which relates R and X being validated by the use of point observations or/and gridded reanalysis data. This equation represents the most common form, but other relationships have been used, such as relationships between predictors and the statistical distribution parameters of the predictand (Pfizenmayer & von Storch, Citation2001), or the frequencies of extremes of the predictand.
Statistical downscaling allows one to simultaneously simulate multiple outputs such as precipitation, maximum and minimum temperatures, solar radiation, relative humidity and wind speed (e.g. Parlange & Katz, Citation2000), which is of great importance, particularly for impact studies (Wilby et al., Citation2004). It is also possible to downscale predictors independently, but in such a case, it is crucial to ensure that inter-variable relationships remain intact.
The performance of downscaling techniques depends on the choice of the regional domain (Wilby & Wigley, Citation2000), which in practice is often not considered (Benestad, Citation2001), and also depends on the regionalization methods (Wilby et al., Citation2004). Gutiérrez, San-Martín, Brands, Manzanas, and Herrera (Citation2013) assessed the performance of statistical methods commonly used for downscaling temperature (including Analogue methods, Weather typing techniques, Multiple linear regression, and Regression conditioned on weather types) with respect to their robust applicability in climate change studies. These authors established a new validation framework exploiting the anomalous warm historical periods. Based on this framework the study concluded that regression methods are the most appropriate in regard to climate change studies. Weather typing was found to underestimate the temperature in moderately warmer conditions and Analog methods, even though best reproducing the observed distributions, significantly underestimate the temperatures for warm periods in comparison with observed values.
Operational weather forecasting approaches, such as Perfect Prognosis (Perfect Prog; von Storch, Zorita, & Cubasch, Citation1993) and Model Output Statistics (MOS; Wilks, Citation1995, Citation1999), may also be incorporated in statistical downscaling (e.g. Feddersen & Andersen, Citation2005). These approaches, also named statistical post-processing methods, have been successful in correcting many deficiencies inherent to forecasts from numerical weather prediction models (Marzban, Sandgathe, & Kalnay, Citation2006). Both groups of methods use large multiple regression equations, taking advantage of the correlations between predictand and regressors. The classification has its foundation in the character of the employed predictors (Maraun et al., Citation2010).
Perfect Prog was developed to exploit the deterministic nature of dynamical Numerical Weather Prediction (NWP) models. Large scale observational data are often replaced by the reanalysis products, and the MOS approach is also rooted in NWP (Glahn & Lowry, Citation1972). The main principle is to exploit statistical relationships between local observational data and simulated output of the numerical model, in order to correct for RCMs errors (Maraun et al., Citation2010). This approach allows for the impact of a particular dynamical model to be directly reflected at different projections. A limitation of MOS models is that the data set must contain both the historical records of the predictand and the corresponding stored records of the forecast produced by the dynamical model.
2.3. Discussion
The choice of an appropriate method, or even deciding whether or not it is convenient to apply a downscaling procedure, is often not straightforward (Mearns et al., Citation2003). Nevertheless, frequently, the global or continental scale information is implemented directly, which negatively affects the resulting local scale impact maps (Trzaska & Schnarr, Citation2014). We acknowledge that the most cutting edge approach to provide future localized climate information is to combine dynamical downscaling with further statistical advancement and bias corrections, as Lemonsu, Kounkou-Arnaud, Desplat, Salagnac, and Masson (Citation2013) did when assessing the evolution of Parisian climate. However, these authors had access to a luxurious retrospective dataset with high spatial–temporal resolution for evaluation purposes. Moreover, their skills, expertise and the access to (funding, time and computational power) resources were arguably outstanding. Those advantages are usually associated with larger cities hosting universities and other institutions able to help with such sophisticated planning. Smaller urban systems often struggle to obtain such support, mainly in terms of expertise (Georgi et al., Citation2016). This is of high importance since consistent long-term urban policy should be based on systematic local participation.
On the other hand, the major practical limitation of regional dynamical downscaling, which is its high computational demand (Mearns et al., Citation2003; Fowler et al., Citation2007; Rummukainen, Citation2010), is not so impactful in the case of empirical/statistical downscaling techniques. Furthermore, statistical downscaling allows to simultaneously simulate multiple outputs such as precipitation, maximum and minimum temperatures, solar radiation, relative humidity and wind speed (e.g. Parlange & Katz, Citation2000), which is of great importance, particularly for impact studies (Wilby et al., Citation2004). This flexibility, together with their reachability to wider urban stakeholder communities, determines the focus of this paper in terms of practical bottlenecks discussed below. In the following, we outline the strengths and weaknesses of statistical downscaling approaches.
The climate community invested significant effort to compare the methods of statistical downscaling (e.g. Benestad, Citation2001; Dibike & Coulibaly, Citation2005; Huth, Citation1999; Khan et al., Citation2006; Schoof & Pryor, Citation2001; Widmann, Bretherton, & Salathé Jr, Citation2003; Wilby & Wigley, Citation1997; Zorita & Von Storch, Citation1999). Schoof (Citation2013) provides a broad overview of statistical downscaling for studies on regional climate change, focusing on downscaling assumptions, choices of predictors and predictands, and methodological approaches.
The strengths and weaknesses of distinct approaches of statistical downscaling are summarized in . The basic assumption of stationarity is essential, but it also represents the major theoretical weakness of statistical downscaling (Wilby et al., Citation2004). The concept of stationarity assumes that the statistical relationship between the predictor and predictand will not change in future climate (Fowler et al., Citation2007). However, there is evidence that this may not occur (e.g. Fowler & Kilsby, Citation2002; Slonosky, Jones, & Davies, Citation2001). Stationarity of the predictor-predictand relationship can be tested using long records, or a period of different climate characteristics can be used for model validation. Non-stationarity is introduced by an incomplete set of predictors, which does not reflect the low frequency behaviour, or has an inappropriate sampling or calibration period, or by real changes in the climate system. However, in projected climate change, the circulation dynamics may be robust to non-stationarities and the associated degree of non-stationarity is relatively small (Hewitson & Crane, Citation2006).
Table 1. Strengths and weaknesses of statistical downscaling methods with sample studies (adapted from Wilby et al., Citation2004).
When applied to a changing climate, another key assumption inherent to statistical downscaling is that the predictors should ‘carry the climate change signal’ (Giorgi et al., Citation2001). Selected predictors should be physically meaningful and reflect the processes which subsequently control variability in the climate. The selected predictor variables should also be those that are well represented by GCMs (Fowler et al., Citation2007). Appropriately selecting variables is in the equilibrium between the relevance in the physical climate reality and the accuracy with which the predictor is reproduced by the climate model (Wilby & Wigley, Citation2000). Partial correlation analysis, step-wise regression or an information criterion are examples of procedures that may be preliminarily applied in order to identify the most promising predictor variables (Wilby, Tomlinson, & Dawson, Citation2003). Also, local knowledge and expert opinion are priceless information sources in attempts to assemble the most effective set of predictors (Wilby et al., Citation2004).
When the statistical downscaling model is not able to consolidate land surface forcing, meaning that the simulated regional climate is determined solely on the basis of free atmospheric variables, the CC scenario will omit changes in land-surface feedback. However, it is acknowledged that local land use management influences regional climate, vegetation cover and runoff regimes (e.g. Chase et al., Citation2001; Kalnay & Cai, Citation2003; Reynard, Prudhomme, & Crooks, Citation2001).
Statistical downscaling methods tend to underestimate the variance and poorly represent extreme events. Therefore, the techniques that introduce additional variability are frequently utilized (Fowler et al., Citation2007). A method magnifying the variability by multiplication by a suitable factor is known as ‘Variance inflation’ (Karl, Wang, Schlesinger, Knight, & Portman, Citation1990). The randomization method adds variability in the form of white noise, and provided good results in returned values of surface temperature for central Europe (Kyselý, Citation2002). A more sophisticated approach to add variability to statistical models is a variant of canonical correlation analysis called ‘Expanded downscaling’ (e.g. Huth, Citation1999; Müller-Wohlfeil, Bürger, & Lahmer, Citation2000). Each of the abovementioned approaches have different drawbacks (Bürger & Chen, Citation2005). Variance inflation does not adequately reflect spatial correlations. Randomization poorly transfers change in variability that influences expected future change. Expanded downscaling is highly susceptible to the choice of statistical processes during its own application (Fowler et al., Citation2007).
Generic weakness of statistical downscaling is high demand on available data. On the other hand, the computational cost of statistical downscaling is relatively low. Therefore, it may appear to be an advantageous alternative for projects where the computational capacity, technical expertise or time represent significant restriction (Trzaska & Schnarr, Citation2014). Statistical downscaling may be appropriate for impact studies in heterogeneous regions with complex topography and steep environmental gradient (e.g. islands, mountains, land/sea contrast), or in cases where point scale information is required (e.g. local flooding, soil erosion, urban drainage, etc.), or to produce large ensembles and transient scenarios (Wilby et al., Citation2004).
3. Climate projections and urban studies
This section illustrates the variety of current approaches available to study potential impacts of CC in urban systems, thus it provides a typological summary rather than a comprehensive review of the field. The studies are organized from the point of view of the scale and the complexity of deployed downscaling techniques with highlights of unique features. We start with relatively simple studies utilizing the data from only one weather station. Then we move to works assessing climate change in more than one metropolitan system, but sometimes considering each city as a point feature. Finally, we focus on complex studies deploying various techniques of statistical and dynamical downscaling, exploiting a range of environmental indices and (apart from the climate simulations) deploying sophisticated models of future evolution of urban land cover.
The first group of urban studies commonly uses observational data from just one or few measurement stations (weather or rain gauge stations) for validation purposes. These time series are used to correct bias in dynamically simulated GCMs or RCMs in order to obtain more reliable projections of urban climate. This approach is widely used in hydrology and the term downscaling frequently refers to temporal disaggregation of the data (e.g. Hingray & Haha, Citation2005; Huang & Lu, Citation2015; Willems & Vrac, Citation2011).
Sunyer, Madsen, and Ang (Citation2012) considered future scenarios for a location north of Copenhagen (Denmark) using simulated data from a set of RCM projections of the ENSEMBLES project (Van der Linden & Mitchell, Citation2009) with spatial resolution of 25 km. This study compares five statistical downscaling methods: two regression models and three weather generators. The regression methods exploit the different statistical properties, namely changes in mean and changes in mean and variance. The Weather Generators (WGs) are a Markovian chain model, a semi-empirical model and a Neymar-Scott Rectangular Pulses (NSRP) model. The paper by Sunyer et al. (Citation2012) is also outstanding for its highlights of the importance of the limitations and advantages of different downscaling techniques.
Somewhat related is a study of Onof and Arnbjerg-Nielsen (Citation2009), but with focus given solely to WGs. The rainfall generator in this method is composed of two features: the storm structures are captured by the hourly generator and then the disaggregator provides hourly information at finer temporal scales. Another difference from Sunyer et al. (Citation2012) lies on the method of transformation of the areal information (RCM output) to the point scale. Here, the areal information is represented by a grid-squared product of the Danish Meteorological Office with a resolution of 10 km. For each gauge, the RCM cell containing the gauge and the eight neighbouring cells are considered. Than the mean and standard deviation over those nine grid-squares are used in the fitting of the hourly generator. This strategy was also applied by Willems and Vrac (Citation2011). These authors used two sets of methods. One of them was the direct usage of climate models output with computation of quantile perturbations on extreme events. The study tested the assumption that the same perturbations remain constant for finer temporal scales. The second group of methods belong to the family of Weather typing approaches, which account for low accuracy of daily precipitation in current climate models by considering that change in precipitation is not only a function of change in atmospheric circulation but it also depends on temperature rise.
Recently, Batista, Gonçalves, and da Rocha (Citation2016) assessed the impact of future heat in the metropolitan region of São Paulo (Brazil) based on the Indoor Perceived Equivalent Temperature (IPET) index. The IPET was computed on the adjusted cutting-edge multi model climate project CORDEX, which is an international initiative for downscaling climate projections from different parts of the world. More specifically, Batista et al. (Citation2016) deployed CREMA (CORDEX REgCM4 hyper-Matrix experiment) simulations. This study is unique considering the use of measurements from two weather stations for validation purposes, which is justified by the varying wind conditions in the city.
Another group of studies focused on the impact of CC in urban systems by assessing multiple metropolitan areas simultaneously. Such studies, apart from their conclusions regarding specific cities, also allow for judgments at broader spatial domains (e.g. state or regional). For example, a study by Martin, Cakmak, Hebbern, Avramescu, and Tremblay (Citation2012) assessed the potential temperature-related mortality under climate change for fifteen Canadian cities. This study shares some aspects with previously mentioned works, namely the strategy of the eighth neighbouring grid-cells centred at the observations’ locations – in this case the airports. A distinctive feature of this work is the linkage between temperature and mortality, which was possible due to the cooperation between the authors and the Public Health Agency of Canada that provided the mortality data.
Fallmann, Wagner, and Emeis (Citation2017) analysed various climate indices for eleven urban areas in Central Europe. This work used climate simulations of a non-hydrostatic Weather Research and Forecasting (WRF) model with the Advanced Research WRF-ARW dynamic solver version 3.1.1. of 7 km grid cell resolution. The E-OBS dataset (Haylock et al., Citation2008) was used for validation purposes. Another highlight of the study by Fallmann et al. (Citation2017) is that it provides some hints on the technical / IT execution of the exercise, which is seldom addressed in scientific literature.
A very different study by Huang and Lu (Citation2015) assessed the effect of Urban Heat Island (UHI) on climate warming in the Yangtze river delta in China, which covers many metropolitan areas. The analyses were based on measurements from forty-one meteorological stations that uniformly covered the study area with data from 1957 to 2013. The authors provide the warming rates and estimates of the UHI contribution to observed warming. Another aspect of this study is the classification of the cities into levels according to population size and subsequently derived conclusions within those categories.
Another study for China region using climate simulations in the context of urban systems is the work of Li, Gu, Bi, Yang, and Liu (Citation2015). The authors projected heat-related mortality for cardiovascular diseases and respiratory diseases. The interesting feature to be highlighted is that this work targets the specific causalities within those disease categories instead of the total heat-related mortality. On the other hand, the limitation of this study might be the usage of the ensemble consisting of only five GCMs (the rule of thumb recommends at least ten models). However, Li et al. (Citation2016) have improved the study by utilizing thirty-one downscaled climate models for the same area. More importantly, they included the trend of aging population in the estimate of future heat-related mortality. Consequently, this study provides the first evidence of the synergy in hybrid question of global warming and population aging in China.
Completely unparalleled is a study by Früh et al. (Citation2011). Firstly, the RCMs runs were used as input for a dynamical model to obtain data at urban scale (horizontal resolution varies from 500 m at the outskirts to 50 m at the city centre), and then the microscale simulations covering thirty-year time slices (past and future) were delivered via the Cuboid method. This method considers the assumption that it is possible to reduce the problem into three degrees of freedom: the 2-m air temperature, the 2-m humidity and 10-m wind speed. This approach is related to the family of envelope models used in Ecology. Only a small set of meteorological conditions are being simulated and the specific day characteristics are derived by means of interpolation. According to Früh et al. (Citation2011), this pragmatic approach provides approximated results but significantly decreases the computational cost.
A complex study by Hayhoe et al. (Citation2004) assessed CC impacts on a medium size area of interest in California (USA), where one of the four locations considered for extreme heat analyses is located in the city of Los Angeles. This study used one lower (B1) and one higher (A1fi) Special Report on Emission Scenarios (SRES), which bracket a large proportion of various future emission scenarios. Dynamical models were statistically downscaled to a grid of 1/8° (∼13.5 km) by a still popular downscaling method based on probability density functions. This approach belongs to the family of empirical-statistical downscaling techniques. Furthermore, simple regression was used to downscale to the locations of selected weather stations. The observed monthly regression relations were then applied to future projections to ensure that the approximated information on future climate shared the same weather statistics. Hayhoe et al. (Citation2004) also reported that the extrapolation beyond the range of observed values were rarely needed because the simulated climate behaviour involves higher occurrence of warm days rather than an increase in expected absolute maxima. This study represents one of the most complex CC impact assessments in terms of impacted sectors: extreme heat, heat related mortality, snowpack, runoff, water supply, agriculture and general vegetation distribution. The most relevant conclusions in an urban context are about extreme heat and related mortality, but the authors also provide insights on future precipitation, snowpack, runoff, water supply, agriculture and vegetation cover.
Even though the study by Lee, Park, Lee, and Kim (Citation2016) is not urban specific, it used RCM simulations and has several unique aspects. The authors computed the Probable Maximum Precipitation (PMP) deploying data from 64 weather stations dispersed all over South Korea, which were interpolated into a 5 km × 5 km grid by inverse distance weighting. The bias included in RCM simulation was corrected by the quantile-mapping method. First, the major storm events on the record were identified assuming that their associated precipitation efficiency was maximal. The storm efficiency is a function of perceptible water (total mass of water vapour in vertical column of the atmosphere). However, the direct measurement of this quantity is very challenging and perceptible water is also not a common variable provided by RCMs. The first unique feature of this study is the overcoming of the issue of lacking perceptible water information by exploiting the correlated relationship with surface dew point temperature. Second, this article provides a very detailed and intelligible explanation of a cutting edge bias correction method.
Kusaka, Masayuki, and Takane (Citation2012) evaluated future heat stress in the world's largest metropolitan system – Greater Tokyo. This sophisticated study deploys the dynamical WRF model with 3 km horizontal spacing. The boundary forcing is created by averaging the ensemble of three different GCMs. To express estimated future heat stress this study uses the concept of Wet-Bulb Globe Temperature (WGBT). WGBT is an empirical heat index developed to control heat-related causalities in military training, and supposedly it correlates better with heat stroke occurrence than simple air temperature. Another simple but interesting indicator of future heat stress used by Kusaka et al. (Citation2012) is the frequency of Heat-induced Sleeping Discomfort (HSD) nights. Another highlight of this work is an approach to account for the complexity of the urban system. The WRF model is coupled to a single layer Urban Canopy Model (UCM), which considers the urban geometry, green fraction and anthropogenic heat emission with diurnal variation.
There are many studies confirming that land cover has a significant impact on climate (e.g. Fallmann et al., Citation2017; Huang & Lu, Citation2015; Solecki & Oliveri, Citation2004). Some works proved its impact on rather local scales (Cui & Shi, Citation2012; Früh et al., Citation2011; Hu & Jia, Citation2010; Wolters & Brandsma, Citation2012; Zhang, Gao, Wang, & Chen, Citation2010). Other studies provided evidence of climate being influenced by urbanization and related land cover changes on regional or even global scale (e.g. Batista et al., Citation2016; Da Rocha, Reboita, Dutra, Llopart, & Coppola, Citation2014; Llopart, Coppola, Giorgi, Da Rocha, & Cuadra, Citation2014). On the other hand, a global study by Peng et al. (Citation2012), considering 419 large cities, states that no relation has been confirmed between the size of the metropolitan system or population density and the UHI effect. Rather than that, those authors emphasized the importance of urban design and urban vegetation cover within the city.
One of the most complex approaches for downscaling urban climate data involving land use modelling is the work of Solecki and Oliveri (Citation2004). As a part of the New York Climate & Health Project, these authors describe a procedure to downscale CC scenarios in urban land use models. The land use models considered in this study are part of the SLEUTH programme (Clarke, Hoppen, & Gaydos, Citation1997), which deploys a probabilistic cellular automata protocol, and consists of two core components: the Land Cover Deltatron Model (LCDM) is nested within an Urban Growth Model (UGM). An alternative to those mostly not user friendly cellular automata models was recently introduced by Bununu (Citation2017).
Finally, Lemonsu et al. (Citation2013) used a very sophisticated approach to investigate the evolution of Parisian climate. This study was conducted as part of the EPICEA project (French acronym for Pluridisciplinary study of the impacts of climate change at the scale of Parisian region). The aforementioned authors combined dynamical downscaling with the quantile-quantile (q-q) correction method. The long term urban climate simulations were calculated by the SURFEX land surface modelling system. The analyses were done for a 48 km × 48 km study area with a spatial resolution of 1 km. The land use/land cover scheme followed the CORINE classification. For evaluation purposes, the high spatial–temporal resolution (8 km, hourly) retrospective dataset (1958–2008) generated by the SAFRAN system was utilized. This study by Lemonsu et al. (Citation2013) assessed possible aspects of future climate in winter and summer seasons separately by exploiting a wide range of climate indices, and provided information on the UHI effect as well.
4. Discussion
Climate change is expected to have significant impacts on urban systems and built infrastructure (Chapman, Howden-Chapman, & Capon, Citation2016; Hunt & Watkiss, Citation2011; Rosenzweig, Solecki, Hammer, & Mehrotra, Citation2011), such as energy systems (Spandagos & Ng, Citation2017), water supply and wastewater treatment (Howard, Calow, Macdonald, & Bartram, Citation2016; Wang et al., Citation2016), transportation systems (Dulal, Brodnig, & Onoriose, Citation2011; Kwan & Hashim, Citation2016; Peterson, McGuirk, Houston, Horvitz, & Wehner, Citation2008), public health and human comfort (Araos, Austin, Berrang-Ford, & Ford, Citation2016; Batista et al., Citation2016; Li et al., Citation2015; Molenaar, Heusinkveld, & Steeneveld, Citation2016).
What climate-related challenges does the city face? Where are adaptation policies and actions the most urgently needed? Those are key questions faced by decision makers but the answers often lead to short or medium term solutions. Actions like establishing a plan for the mobile dams’ deployment belong to coping measures and are based on the experiences of past extreme events. Incremental adaptation represents another approach, when the already existing solutions are improved step by step considering the future evolution of the climate conditions. Coping and incremental adaptation measures certainly have their value but do not grant the functionality in the long term future. In extreme cases, these approaches might lead to a scenario where the urban system is locked-into an unsustainable situation (e.g. the capacity of already existing dykes or conventional sewerage system is not ever-increasable). On the other hand, urban systems last for decades and certain features such as valuable heritage remain for centuries. Hence, broader and systematic approach to address long term adaptation planning is needed. Transformative adaptation combines coping and incremental strategies, while addressing the root of causes and acknowledging the future potential magnitude of various risks. Transformative adaptation aims to multipurpose solutions and, as an integral part of urban planning turns challenges to opportunities and boosts overall quality of life.
Adaptation to climate change is currently becoming an integral part of urban planning and infrastructure development at city and district levels. While the short and medium term perspective is usually considered, long-term planning often remains omitted by managers and decision makers. There are several reasons for the lack of long term adaptation planning and action. Firstly, for example in European cities, administrators operate with reduced budgets and high unemployment resulting from economic crises. Globally, while some cities already experienced dramatic impacts of CC, others view the matter as a distant future challenge, thus their focus is on more urgent problems. In fact, in scientific literature the evidence of the current lack of appropriate policy targeting the urban climate can be found (Hughes, Citation2017). Moreover, even though integrated long-term transformative adaptation strategy makes the action more affordable, these investments are rewarding after a long time beyond political mandates. Long term adaptation planning operates with periods of approximately 50–100 years and represent a difficult challenge owing to the uncertainty associated with future climate, as well as because of the socioeconomic evolution of complex urban environments (Georgi et al., Citation2016).
4.1. Linking climate data and urban planning
Climate information should be considered in the planning practice of different sectors, such as cultural heritage protection, disaster risk reduction, food security, public health, energy, transport, tourism, water resources and coastal management. However, recommendations on how to incorporate climate data into the urban planning process often remain rather holistic. A few major entities (e.g. WMO – World Meteorological Organization, IPCC – Intergovernmental Panel on Climate Change, FAO – Food and Agriculture Organization of the United Nations), among other authors (e.g. Akbari et al., Citation2016; Davoudi, Crawford, & Mehmood, Citation2009), provide general information on adaptation and mitigation planning. For example, the Implementation Plan of the Global Framework for Climate Services (WMO, Citation2014) provides some insights, but they are still general as they typically reflect the purpose of the actions or they are limited to a few urban systems.
Eliasson (Citation2000) investigated if, how and when knowledge about the climate is used in the urban planning process. The study showed that the use of climatic information was unsystematic and that climatology had a low impact on the planning process. Carter et al. (Citation2015) discuss the use of weather data and climate projections by urban planners from Greater Manchester (UK) for adaptation planning. Those authors also stress practical limitations in the data that are constraining its wider use, such as the need to provide simpler messages with an accompanying narrative to explain what CC means locally. Lorenz, Dessai, Forster, and Paavola (Citation2017) explored the usability and adoption of climate projections within local adaptation planning in England and Germany. Their conclusions regarding the English context raised the question to what extent the discussion on the usability of climate projections at a local level is sensible at the moment. Lorenz et al. (Citation2017) also concluded that Germany makes substantial use of past and present climate data for spatial planning, but the strictly regulated nature of planning prevents the use of climate projections, due to their inherent uncertainties.
How exactly can uncertain probabilistic information be included in a decision support system? A basic concept, still widely used in engineering, considers the climate variability but only with constant properties through time, and based on the severity of the past events. This stationarity assumption is still a common practice when designing new infrastructures (Klein Tank, Zwiers, & Zhang, Citation2009). Therefore, the capacity to endure extremes is accounted for up to a magnitude that might not realistic at locations where that assumption is not met. In fact, urban planners often take into account spatially course projections of climate events and then apply general adaptation measures across the whole metropolitan area (e.g. the utilization of certain thickness of insulation of electric wires or the usage of pipes with specific diameter or/and of certain material when the replacement takes place). Such adaptation measures are not location-specific. Hence, they may be effective but not efficient. Instead (or additionally), urban planners could use localized climate projections to prioritize projects according to areas with strongest future impacts (i.e. the conjunction of hazards exposure and vulnerabilities). Detailed climate projections could assist with major infrastructures development to ensure their safety. For example, industries with high potential to contaminate water resources and soil could be located in areas of low risk of extreme climate impacts. Urban planning should give a greater emphasis to the locations exhibiting higher impacts on the vulnerable part of society, such as children, elderly and low income communities. Furthermore, close attention should be given to land-use planning to prevent new urbanization in high-risk areas (including high-risk areas in distant future).
The important reason why the localized climate information is being incorporated to urban planning rather slowly is that data providers and data users need to interact better. It can also be due to the uniqueness of each urban system, or because climate adaptation is still somewhat new in the policy making agenda (Carter et al., Citation2015). Climate experts often do not have a mandate to influence the decision-making process, while urban decision makers need assistance with data handling and interpretation. In urban space, various programmes, institutes and private stakeholders typically address individual aspects of adaptation planning, but the coordination between them is generally week (WMO, Citation2014). Due to the novelty of this agenda, the interaction between stakeholders should have a form of long-term bidirectional communication to allow for feedback and further adjustments. Moreover, Schoof (Citation2013) suggested to establish new expert positions within decision-making bodies. Those climate professionals would help to increase the utility of localized climate projections.
To successfully tackle the impacts of CC in urban systems, climate projection data with a suitable spatial scale are vital. For example, while water management studies require an inter-regional approach, UHIs or stormwater related challenges are by their nature local (Georgi et al., Citation2016). Local stakeholders often have very fine scale information regarding vulnerabilities to changing climate, while at the same time local decision makers have a key responsibility to deliver space-specific adaptation measures to address the environmental, social and economic implications of CC (Carter et al., Citation2015).
Currently, we are witnessing two parallel tendencies. The first one is a push towards localized city/district level planning (Georgi et al., Citation2016), and a second one is a need for long-term adaptation planning (Davoudi et al., Citation2012). The lack of information that can be used as a basis for impact studies addressing these two requirements represents a certain gap. Different communities are mentioning this gap, each of them from their own perspective. The environmentalist community often refers to a gap in knowledge (e.g. Martins & Ferreira, Citation2011) and urban planners state that cities do not have skills and expertise, whilst decision makers address the shortage of financial resources to bridge this gap by consultancy (Georgi et al., Citation2016). However, the two above-mentioned requirements are bounding this gap.
The usual approach to dealing with uncertainties in future projections of climate change and its impacts is to consider a range of possible future scenarios under different Representative Concentration Pathways (RCPs) (e.g. RCP 4.5 or RCP 8.5) described by Van Vuuren et al. (Citation2011). The temporal scope of most of the impact studies based on such CC projections is the end of the century. These studies are particularly useful for long-term sustainable development planning, because it must account for vulnerability to extreme weather events, disaster management and adaptation, particularly in developing countries (Mirza, Citation2003). Nevertheless, Vautard et al. (Citation2013) argue that the medium term future period of 2050 corresponds to the societal demand of climatic projections useful for adaptation purposes. Regardless of the time scope of the climate projections (2050 – medium term future; 2100 – distant future) or the range of possible future scenarios, important is the need for downscaling scenarios and projections at spatial scales that are relevant for adaptation policies, particularly at city scale.
Carter et al. (Citation2015) advocate that, for effective adaptation, decision makers should develop responses to recent trends in weather and climate, as well as to future projections. Those authors support this claim on a detailed case study of CC impacts and urban adaptation responses linked to spatial planning in Greater Manchester (UK). Research methods employed included downscaling climate projections, spatial analysis with Geographic Information Systems, land use modelling, energy balance modelling, social network analysis, participatory workshops, scenario development, among other approaches. We agree that their conclusions and recommendations are relevant to cities in general.
Another successful multidisciplinary approach is the Rotterdam Climate Initiative (http://www.rotterdamclimateinitiative.nl), which aims to have reduced CO2 emissions by 50% and to have made the region 100% climate proof by 2025. Four potential climate scenarios are used for all climate research and policy-making in the Netherlands, such as the urban CC adaptation plans (City of Rotterdam, Citation2013). For example, two extreme climate scenarios are used to determine the upper and lower limits for the rise in sea level and the normative river flow, as well as to analyse flood protection measures. One of the scenarios assumes 1°C temperature rise on earth in 2050 compared to 1990 and no change in air circulation patterns, and the other one assumes 2°C temperature rise, milder and wetter winters due to more westerly winds and warmer and drier summers due to more easterly winds. These CC scenarios are also linked to two socioeconomic scenarios. This combination has led to four delta scenarios looking ahead to 2050 and 2100. The Rotterdam Climate Change Adaptation Strategy is based on these delta scenarios (City of Rotterdam, Citation2013).
4.2. Mismatch between data needs and data availability
In localized long-term future climate impact assessment, there is no alternative to deployment of climate projections. Swart et al. (Citation2014) emphasized the need to enclose the gap in available climate simulations data by calling for making the projections more precise. Moreover, Olazabal et al. (Citation2014) highlight the problem of the lack of knowledge on specific local future climate conditions. The quantitative knowledge relevant to local priorities is pivotal in urban planning, urban design and the adaptation strategy implementation processes. Space-specific information can be used for the development of map-based interfaces, which is very effective in communication. This is important because local level tools and decision support systems foster citizens’ participation, and allow them to embrace the change and tackle the adaptation as a positive opportunity rather than an issue solely bringing additional costs.
Evidence based knowledge of previous events, general climate change information, localized climate projections and vulnerability assessment of exposure features represents the main components of urban adaptation strategy. While local and regional governments have very fine scale information on urban systems and their vulnerability at their disposal, data with the adequate spatial scale regarding future climate behaviour, as simulated by GCM/RCM models, are often lacking to address its relation with various aspects of urban systems.
This mismatch between data needs and data availability is schematically depicted in , which also illustrates the magnitude of the need for applying downscaling techniques to the already available GCM/RCM data. The discrepancy between features A and B () express the general mismatch at spatial and temporal scales. Ideally, A and B would overlap.
Figure 1. Mismatch between data needs and data availability in urban systems (inspired by Bi et al., Citation2017).
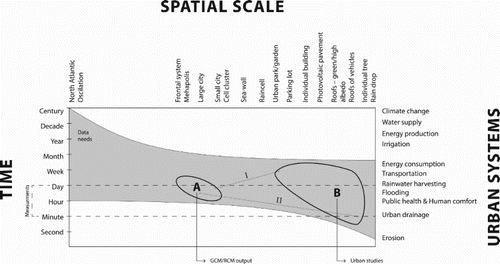
can provide insights on questions like: Is the available data sufficient to address a particular urban challenge? Is there a need to apply downscaling techniques, and if so, what would the satisfactory spatial and temporal target resolution be? For example, there is a great variation in the requirements on space and time resolution in hydrology. Water management operates on broader areas at catchment scales, thus the common RCM output with 50 × 50 km cell size might be feasible. Conversely, stormwater and urban draining analyses require a much finer spatial and temporal scale, coming down to point scale representing individual rain gauges. Similarly, on the temporal axis of , flash floods analysis calls for hourly and sub-hourly data. Overall, the needs for urban hydrological studies are located in the right-bottom part of object B (). For example, heat waves (in dependency on what kind of environmental index is being used) are typically defined as certain days during which the temperature does not drop under a certain threshold. Hence, daily temperature data would be effective for such an assessment and subsequent adaptation planning. Additionally, the dotted lines in represent examples of the mismatch between raw GCM/RCM output and the needs of urban studies. The line marked as I illustrates the situation where cutting-edge RCM simulations are available (e.g. EURO-CORDEX data with 12 × 12 km/day resolution) and the UHI effect is of main concern. The longer line II depicts GCM/RCM of 50 × 50 km/6 hourly, and the subject to be analysed is a stormwater discharge. These illustrative examples assist in reading , where the length of lines I and II represents the magnitude of the scale mismatch, which emphasize the current need for the deployment of downscaling techniques.
4.3. Climate change adaptation practices and scale interdependency
Grimmond et al. (Citation2010) identify current capabilities to observe and predict urban atmospheric processes across a range of spatial scales. In future urban climate assessment, there is a need to not only estimate the climate behaviour, but also the socioeconomic evolution of the urban system. Those two are bind since they are bidirectional inter-dependent. Therefore, the modelling should also be coupled. Land use and land cover represent prominent observable tokens of the socioeconomic situation. Generally, land use in the context of complex urban fibre is a phenomenon occurring (and being managed) at finer scale than typical GCM/RCM output, thus downscaling techniques have their value for urban planning and design. Moreover, land-use changes are not considered in RCMs, which are usually run with static vegetation (Rössler et al., Citation2017). For example, when designing an urban square, decision makers having the localized information on future climate conditions (including the influence of e.g. amount of sealed surface to water run-off and UHI) may design the square differently. The positioning of circumferential buildings, the excessive water draining vegetation or shading trees can be added, targeting the areas of likely future high exposure. Street design can incorporate the corridors following the main local wind directions (Georgi et al., Citation2016). Such decisions are difficult to be made based on coarse resolution decision making supporting materials, particularly in a city context, where conditions might differ street by street (Ali-Toudert & Mayer, Citation2007).
Specific climatic conditions predefine effective adaptations. The strategies should be harmonious within a large spatial sustainability context. Hence, for example, utilizing non-native flora (aiming for local temperature reduction) with high water demand in arid zones may result in the reduction of city water supply (Ruddell & Dixon, Citation2014). According to Georgescu et al. (Citation2015), the balance between localized cooling and water scarcity in cities should be subject to further research.
Even individual buildings can have decadal or century-times scale impact. Decisions of urban planners also have climate-related spatial impacts. Planning processes should consider the limits on parallel or concurrent development resulting from scale interdependent phenomena (Mills et al., Citation2010). Buildings relatively taller than surrounding constructions would alter shading, near-surface temperature and the wind regime which consequently influence the thermal comfort and the air quality in the area, particularly in the case of cumulated impacts related to rapid development. The study of the Pearl River delta in East China, serves as an example which documents the impact of the sum of rapid development onto regional air quality (Lu, Chow, Yao, Lau, & Fung, Citation2010). Decision makers should be aware of scale interdependency dimension of development in order to optimize strategies across various spatial scales.
Both climate and land cover models carry large uncertainties. This uncertainty must be kept in mind during the decision making. Hence, the action taken on the basis of localized future projections should favour the so called robust and low-regret measures. Those measures are of relatively low cost and bring large benefits. For example, instead of increasing the capacity of a sewerage system, which does not guarantee sufficient functionality under long-term climate change, the city may deploy a green infrastructure at a lower cost. Such a solution also brings additional benefits and is more flexible, therefore it allows the urban system to avoid locking itself in the unsustainable strategy (Georgi et al., Citation2016). Moreover, due to the complexity and long-term nature of climate, the integration of a monitoring, reporting and evaluation (MRE) system is vital (UNFCCC Secretariat, Citation2010). MRE does not only represent a procedure to systematize experience and extend knowledge, but also provides an emphasis on learning. Hence, MRE allows for necessary continuous adjustments in future decision making (Bours, McGinn, & Pringle, Citation2014).
4.4. Practical bottlenecks for geographers, urban planners or statistics practitioners
Terminology represents the very first bottleneck for everyone new to the field of downscaling of climate projections. von Storch, Zorita, and Cubasch (Citation1991) might have been the first ones to use the term downscaling and it has been widely used since then, but the terms disaggregation and regionalization are also frequently used in Europe. In parallel, the name refinement was proposed by Environment Canada (Hengeveld, Citation2000). Nevertheless, the downscaling concept has been increasingly utilized in Canada (Barrow, Maxwell, & Gachon, Citation2004). ‘Statistical/empirical’ downscaling is commonly addressed by simplified terms ‘statistical’ or ‘empirical’ downscaling, while ‘Dynamical downscaling’ can be referred to as ‘numerical’ downscaling (Bi, Gachon, Vrac, & Monette, Citation2017).
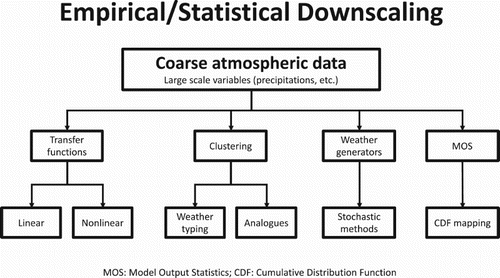
Downscaling and climate modelling represent a multidisciplinary field, where researchers from various backgrounds intersect their efforts, resulting in specific terminology, which may be somewhat confusing. For instance, Polynomial Regression (also called the Surface Trend Analysis) is a statistical technique. In the context of spatial interpolation procedures, it is commonly classified as a deterministic technique, and kriging approaches are classified as stochastic. Furthermore, the terms ‘statistical’ and ‘stochastic’ (frequently used as names of sub-classes in downscaling methodological reviews) are not always considered as synonymous, even though both terms could be seen as identical since they are referring to methods handling input modelling factors as variables with certain probability distributions. In addition, recent development is moving towards multi-step methodologies containing deterministic and stochastic components. This evolution leads to the introduction of new terms like hybrid or semi-stochastic approaches, which makes the efforts of initial exploration of various downscaling methods even more challenging. Consequently, we present perhaps the most comprehensive graphic in . Not all classification terms found in the literature are included, but it is helpful when one tries to orient oneself in the main sub-categories of statistical/empirical downscaling.
Figure 2. Main families of empirical/statistical downscaling (adapted from Bi et al., Citation2017).
Wilcke and Bärring (Citation2016) argue that many climate impact modellers are simply not able to handle the data generated by GCM-RCM simulations. This topic is seldom discussed in urban climate scientific literature (e.g. Wilcke & Bärring, Citation2016; Rössler et al., Citation2017). Here, we hypothesize that the underlying reason largely lies in certain entrance barriers within the IT domain. Sometimes, one can find pointers, for example when Fallmann et al. (Citation2017) state that calculations were carried out using Climate Data Operators (CDO) tools. However, the comprehensive know-how is not that straightforward to find. This IT bottleneck is possible to divide into two related areas. First, is the data structure / format, and the second is the amount of data generated by GCM-RCMs (meaning both data volume and large quantity of files).
Future climate projections data are commonly provided in NetCDF (Network Common Data Form) format. This is a set of interfaces, libraries, self-describing, machine-independent and array-oriented data formats supporting creation, access and sharing of scientific data (Rew et al., Citation2011). NetCDF has its origin in the University Corporation for Atmospheric Research (UCAR) consortium, under the Unidata programme. NetCDF is a successor of Common Data Format developed by NASA, but it is no longer compatible (Rew et al., Citation2011). All above-mentioned entities represent supreme sources of information. The various versions of NetCDF data can be encountered (NetCDF-3, NetCDF-4/HDF5, NetCDF-4/HDF5 classic and 64-bit Offset format), which may easily lead to confusion (Rew et al., Citation2011, Appendix C). Since March, 2011 the NetCDF-4/HDF5 file format is standard and has been approved and recommended by NASA Earth Science Data Systems (http://earthdata.nasa.gov/standards; accessed: 13/03/2017), and NetCDF Classic and 64-bit Offset Format are standards recognized by the Open Geospatial Consortium (OGC; http://www.opengeospatial.org, accessed: 13/03/2017). In general, NetCDF data is binary, self/describing and portable – meaning that all computer platforms, regardless of their approaches towards integer storage, characters and floating point numbers can access such data (Rew et al., Citation2011). A variable represents a multidimensional array of values of the same type. The dimension specifies the variable shape, common grid and coordinate system. An attribute holds the properties of data sets (global attribute) or specific variable (e.g. units), but attributes cannot be multidimensional (Rew et al., Citation2011). The other important role of attributes is the implementation of conventions. Typically, it is a name of an attribute rather than the name of the variable that is subject to standardization. The NetCDF Climate and Forest Conventions dictates the organization of the data in the climate domain (Eaton et al., Citation2011).
The NetCDF-4/HDF5 represents the file format providing the most enhanced capabilities. The deployment of HDF5 as storage layer removes many of the restrictions common to the 64-bit offset and the classic NetCDF files. The model allows for user-defined data types including more primitive types as strings, larger variable sizes and supports multiple unlimited dimensions. Furthermore, the HDF5 storage layer allows for per-variable compression, multidimensional tailing and dynamic scheme changes, meaning that there is no need to copy data when adding a new variable. Finally, when reading and writing NetCDF-4/HDF5 files, the parallel I/O (input/output) is supported, thus the computational performance is significantly improved [7.3.4. Parallel I/O], which is of extraordinary importance when handling large multi-model ensembles of climate projections due to large number of files.
The cost of the above-mentioned power and flexibility comes in software applicability. Most of existing NetCDF software is only compatible with the classic data model and it is not capable of handling the additional complexity [triangle/diagram reference]. This brings the necessity of installation of multiple SW libraries, but the more important challenge, reported by NetCDF users, is the shortcoming of Windows platform support in comparison with Linux (https://earthdata.nasa.gov/standards/netcdf-4hdf5-file-format; accessed: 15/03/2017). Additionally, some of GCM/RCM simulations come on unconventional grids (e.g. False North Pole rotated native grid for European domains of EURO-CORDEX experiment). They can be easily re-rotated (https://www.earthsystemcog.org/projects/cog/faq_data/; accessed: 17/03/2017), but not by tools commonly used by classical geographers, urban planners or statistics practitioners. Somewhat extensive lists of SW tools to conveniently handle NetCDF data can be found in https://www.unidata.ucar.edu/software/netcdf/software.html (accessed: 23/03/2017).
Apart from data format, the second practical challenge of the deployment of the full multi-model climate ensembles is simply the amount of data in terms of both-data volume and large quantity of files generated by GCM/RCMs. We will use an example to illustrate the data amount necessary to work within the context of climate projections. Multiple variables such a precipitation, maximum and minimum temperatures, solar radiation, relative humidity and wind speed are of interest for impact studies (Wilby et al., Citation2004). Here, for simplicity, only one variable will be considered for illustration purposes. We selected the EURO-CORDEX (Jacob et al., Citation2014) multi-model ensemble since it represents the cutting edge, fine scale set of climate simulations and it is openly available. Furthermore, for the sake of simplicity, we are only considering a single climate scenario (e.g. RCP 8.5), but note that in a real climate impact assessment exercise all the following numbers would be multiplied by the number of required variables, and then the data for each scenario would also be added. Searching the data internet portal (https://esg-dn1.nsc.liu.se/projects/esgf-liu/; accessed: 03/10/2016) with the following specifications returns approximately 620 files with 620 GB: CORDEX experiment, daily data, EUR-11 domain, historical plus RCP 8.5 runs, average temperature, time span between 1971 and 2100, and only 10 GCM/RCM models as a minimum number of ensemble members.
The data comes in the form of NetCDF-4/HDF5 files – each one containing a time slice of 5 years covering the whole European domain. In Windows environment, users have an option to add the files, one by one, to the basket as in a common e-shop. However, it is clearly convenient to migrate to the Linux environment already in this very first step. Then, the automatic wget download is available and requires only basic knowledge of shell scripting. This principle holds true for each subsequent step in data handling. For example, when applying spatial and temporal subsetting with focus on a particular urban system, the resulting data are not large in terms of bytes, but the number of files remains. Luckily, the climate community invested significant efforts to provide the tools for managing such a data (including e.g. merging files by time, so our 620 files potentially become just 1). But, again, those tools are not common in the tool boxes of most classical geo-practitioners.
To provide the directions to the reader searching for the right tools, we would like to highlight some (reflecting just our personal preference). To understand the data structure, time and space handling, and quick visualization purposes, Panoply software from NASA (https://www.giss.nasa.gov/tools/panoply/) and Ncview by David W. Pierce (http://meteora.ucsd.edu/~pierce/ncview_home_page.html; accessed: 03/10/2016) represent convenient starting points. We recommend the CDO tools (Schulzweida, Citation2017) for pre-processing and computing many of traditionally used environmental indices. Working with CDO within the Python environment is also an option (e.g. Anaconda Python distribution). The ‘extRemes’ R package (Gilleland & Katz, Citation2016) allows to build indices in an R environment and contains few advanced indices (e.g. Russo, Sillmann, & Fischer, Citation2015). To calculate and interpret climate change signals and time series from climate multi-model ensembles the ‘wux’ R package (Mendlik, Heinrich, & Leuprecht, Citation2016) is an interesting tool, and the recent ‘spdownscale’ R package (Rasheed, Egodawatta, Goonetilleke, & McGree, Citation2017) can be of priceless help when in need for statistical downscaling and bias correction.
Furthermore, somewhat related to the IT bottleneck, we would like to highlight a few methodologies that have been proposed for reducing the computational cost. When computational resources represent a constraint, the full multi-model climate ensemble can be reduced to a few representative members, while preserving crucial statistical properties (total spread / uncertainty) and simultaneously reducing structural bias in the resulting subset (Mendlik & Gobiet, Citation2016). These authors proposed a straightforward three-step procedure to achieve this utilizing commonly used statistical techniques: principal component analysis and cluster analysis. Other related useful approaches are provided by Wilcke and Bärring (Citation2016) and Cannon (Citation2015).
5. Summary
We introduced the rationale and problem background justifying the need for future climate impact assessment targeting metropolitan areas from a multidisciplinary point of view – climate, urban planning and policy making. The downscaling of climate projections generated by GCM/RCMs was briefly reviewed and discussed. Furthermore, focus was given to recent developments in urban climate studies making use of downscaling approaches. The reasons why fine-scale climate data is being incorporated to urban planning rather slowly are highlighted. A thorough review on the major challenges in the use of climate change impact data for urban planning is provided. Moreover, some strategies to deal with them are suggested.
Three major practical bottlenecks of using climate projections and their downscaled derivatives in an urban context were covered, namely the terminology, the scale mismatch, and the IT aspects. In the literature, the call for multidisciplinary cooperation between the communities of climate and urban planning can be found. However, we would like to emphasize that specific IT expertise would be also required to successfully tackle the task of future climate impact assessment at an urban scale.
In this paper, we attempt to bridge the gap between all involved expert stakeholders. By highlighting the pitfalls and providing pointers towards appropriate tools and information sources we hope this work might be useful to anyone new in the field of impact assessment using localized future climate data, regardless of the background from which he or she will tackle this multidisciplinary challenge.
Disclosure statement
No potential conflict of interest was reported by the authors.
ORCID
Marek Smid http://orcid.org/0000-0002-9043-5977
Ana Cristina Costa http://orcid.org/0000-0003-2904-1028
Additional information
Funding
References
- Akbari, H., Cartalis, C., Kolokotsa, D., Muscio, A., Pisello, A. L., Rossi, F., … Zinzi, M. (2016). Local climate change and urban heat island mitigation techniques – the state of the art. Journal of Civil Engineering and Management, 22(1), 1–16. doi: 10.3846/13923730.2015.1111934
- Akbari, H., Konopacki, S., & Pomerantz, M. (1999). Cooling energy savings potential of reflective roofs for residential and commercial buildings in the United States. Energy, 24(5), 391–407. doi: 10.1016/S0360-5442(98)00105-4
- Ali-Toudert, F., & Mayer, H. (2007). Effects of asymmetry, galleries, overhanging façades and vegetation on thermal comfort in urban street canyons. Solar Energy, 81(6), 742–754. doi: 10.1016/j.solener.2006.10.007
- Araos, M., Austin, S. E., Berrang-Ford, L., & Ford, J. D. (2016). Public health adaptation to climate change in large cities: A global baseline. International Journal of Health Services, 46(1), 53–78. doi: 10.1177/0020731415621458
- Bala, G., & Nag, B. (2012). Albedo enhancement over land to counteract global warming: Impacts on hydrological cycle. Climate Dynamics, 39(6), 1527–1542. doi: 10.1007/s00382-011-1256-1
- Bárdossy, A., Bogardi, I., & Matyasovszky, I. (2005). Fuzzy rule-based downscaling of precipitation. Theoretical and Applied Climatology, 82(1), 119–129. doi: 10.1007/s00704-004-0121-0
- Bárdossy, A., Stehlík, J., & Caspary, H.-J. (2002). Automated objective classification of daily circulation patterns for precipitation and temperature downscaling based on optimized fuzzy rules. Climate Research, 23(1), 11–22. doi: 10.3354/cr023011
- Barrow, E., Maxwell, B., & Gachon, P. (Eds.). (2004). Climate variability and change in Canada: Past, present and future. ACSD science assessment series no. 2. Toronto, ON: Meteorological Service of Canada, Environment Canada.
- Batista, R. J. R., Gonçalves, F. L. T., & da Rocha, R. P. (2016). Present climate and future projections of the thermal comfort index for the metropolitan region of São Paulo, Brazil. Climatic Change, 137(3–4), 439–454. doi: 10.1007/s10584-016-1690-5
- Benestad, R. E. (2001). A comparison between two empirical downscaling strategies. International Journal of Climatology, 21(13), 1645–1668. doi: 10.1002/joc.703
- Bergant, K., & Kajfež-Bogataj, L. (2005). N-PLS regression as empirical downscaling tool in climate change studies. Theoretical and Applied Climatology, 81(1–2), 11–23. doi: 10.1007/s00704-004-0083-2
- Bi, E. G., Gachon, P., Vrac, M., & Monette, F. (2017). Which downscaled rainfall data for climate change impact studies in urban areas? Review of current approaches and trends. Theoretical and Applied Climatology, 127(3-4), 685–699. doi: 10.1007/s00704-015-1656-y
- Bours, D., McGinn, C., & Pringle, P. (2014). Monitoring & evaluation for climate change adaptation and resilience: A synthesis of tools, frameworks and approaches. Oxford: SEA Change Community of Practice and UK Climate Impacts Programme (UKCIP).
- Bununu, Y. A. (2017). Integration of Markov chain analysis and similarity-weighted instance-based machine learning algorithm (SimWeight) to simulate urban expansion. International Journal of Urban Sciences, 21(2), 217–237. doi: 10.1080/12265934.2017.1284607
- Bürger, G., & Chen, Y. (2005). Regression-based downscaling of spatial variability for hydrologic applications. Journal of Hydrology, 311(1), 299–317. doi: 10.1016/j.jhydrol.2005.01.025
- Camberlin, P., Gitau, W., Oettli, P., Ogallo, L., & Bois, B. (2014). Spatial interpolation of daily rainfall stochastic generation parameters over East Africa. Climate Research, 59(1), 39–60. doi: 10.3354/cr01198
- Cannon, A. J. (2015). Selecting GCM scenarios that span the range of changes in a multimodel ensemble: Application to CMIP5 climate extremes indices. Journal of Climate, 28(3), 1260–1267. doi: 10.1175/JCLI-D-14-00636.1
- Carter, J. G., Cavan, G., Connelly, A., Guy, S., Handley, J., & Kazmierczak, A. (2015). Climate change and the city: Building capacity for urban adaptation. Progress in Planning, 95, 1–66. doi: 10.1016/j.progress.2013.08.001
- Chapman, R., Howden-Chapman, P., & Capon, A. (2016). Understanding the systemic nature of cities to improve health and climate change mitigation. Environment International, 94, 380–387. doi: 10.1016/j.envint.2016.04.014
- Chase, T. N., Pielke, R. A., Kittel, T. G. F., Zhao, M., Pitman, A. J., Running, S. W., & Nemani, R. R. (2001). Relative climatic effects of landcover change and elevated carbon dioxide combined with aerosols: A comparison of model results and observations. Journal of Geophysical Research: Atmospheres, 106(D23), 31685–31691. doi: 10.1029/2000JD000129
- Cheng, C. S., Auld, H., Li, G., Klaassen, J., & Li, Q. (2007). Possible impacts of climate change on freezing rain in south-central Canada using downscaled future climate scenarios. Natural Hazards and Earth System Science, 7(1), 71–87. doi: 10.5194/nhess-7-71-2007
- Cheng, C. S., Yu, P.-S., Li, Q., Li, G., & Chu, J.-L. (2009). Synoptic weather typing and typhoon with an application to Chiayi, Taiwan: potential for future climate change impact analysis. Paddy and Water Environment, 7(4), 293–300. doi: 10.1007/s10333-009-0176-8
- Choi, C. (2016). Does economic growth really reduce disaster damages? Index decomposition analysis for the relationship between disaster damages, urbanization and economic growth and its implications. International Journal of Urban Sciences, 20(2), 188–205. doi: 10.1080/12265934.2016.1144520
- Christensen, J. H., Carter, T. R., Rummukainen, M., & Amanatidis, G. (2007). Evaluating the performance and utility of regional climate models: The PRUDENCE project. Climatic Change, 81, 1–6. doi: 10.1007/s10584-006-9211-6
- Chun, J. A., Sung, K. I. M., Woo-Seop, L. E. E., Oh, S. M., & Hyojin, L. E. E. (2016). Assessment of multimodel ensemble seasonal hindcasts for satellite-based rice yield prediction. Journal of Agricultural Meteorology, 72(3–4), 107–115. doi: 10.2480/agrmet.D-15-00019
- City of Rotterdam. (2013). Rotterdam climate change adaptation strategy. Rotterdam: Rotterdam Climate Initiative. Retrieved from http://www.rotterdamclimateinitiative.nl/documents/2015-en-ouder/Documenten/20121210_RAS_EN_lr_versie_4.pdf
- Clarke, K. C., Hoppen, S., & Gaydos, L. (1997). A self-modifying cellular automaton model of historical urbanization in the San Francisco Bay area. Environment and Planning B: Planning and Design, 24(2), 247–261. doi: 10.1068/b240247
- Cohen, S. J. (1996). Bringing the global warming issue closer to home: The challenge of regional impact studies. Bulletin of the American Meteorological Society, 71(4), 520–526. doi: 10.1175/1520-0477(1990)071<0520:BTGWIC>2.0.CO;2
- Confalonieri, U., Menne, B., Akhtar, R., Ebi, K. L., Hauengue, M., Kovats, R. S., … Woodward, A. (2007). Human health. In M. L. Parry, O. F. Canziani, J. P. Palutikoff, & P. J. van der Linden (Eds.), Climate change 2007: Impacts, adaptation and vulnerability: Contribution of working group II to the fourth assessment report of the intergovernmental panel on climate change (pp. 391–431). Cambridge: Cambridge University Press.
- Cui, L., & Shi, J. (2012). Urbanization and its environmental effects in Shanghai, China. Urban Climate, 2, 1–15. doi: 10.1016/j.uclim.2012.10.008
- Da Rocha, R. P., Reboita, M. S., Dutra, L. M. M., Llopart, M. P., & Coppola, E. (2014). Interannual variability associated with ENSO: Present and future climate projections of RegCM4 for South America-CORDEX domain. Climatic Change, 125(1), 95–109. doi: 10.1007/s10584-014-1119-y
- Davoudi, S., Crawford, J., & Mehmood, A. (Eds.). (2009). Planning for climate change: Strategies for mitigation and adaptation for spatial planners. London: Routledge.
- Davoudi, S., Shaw, K., Haider, L. J., Quinlan, A. E., Peterson, G. D., Wilkinson, C., … Davoudi, S. (2012). Resilience: A bridging concept or a dead end? “Reframing” resilience: Challenges for planning theory and practice interacting traps: Resilience assessment of a pasture management system in Northern Afghanistan urban resilience: What does it mean in planning practice? Resilience as a useful concept for climate change adaptation? The politics of resilience for planning: A cautionary note. Planning Theory & Practice, 13(2), 299–333. doi: 10.1080/14649357.2012.677124
- Dibike, Y. B., & Coulibaly, P. (2005). Hydrologic impact of climate change in the Saguenay watershed: Comparison of downscaling methods and hydrologic models. Journal of Hydrology, 307(1), 145–163. doi: 10.1016/j.jhydrol.2004.10.012
- Dickinson, R. E., Errico, R. M., Giorgi, F., & Bates, G. T. (1989). A regional climate model for the western United States. Climatic Change, 15(3), 383–422. doi: 10.1007/BF00240465
- Dos Santos, T. S., Mendes, D., & Torres, R. R. (2016). Artificial neural networks and multiple linear regression model using principal components to estimate rainfall over South America. Nonlinear Processes in Geophysics, 23(1), 13–20. doi: 10.5194/npg-23-13-2016
- Dubrovský, M., Buchtele, J., & Žalud, Z. (2004). High-frequency and low-frequency variability in stochastic daily weather generator and its effect on agricultural and hydrologic modelling. Climatic Change, 63(1), 145–179. doi: 10.1023/B:CLIM.0000018504.99914.60
- Dulal, H. B., Brodnig, G., & Onoriose, C. G. (2011). Climate change mitigation in the transport sector through urban planning: A review. Habitat International, 35(3), 494–500. doi: 10.1016/j.habitatint.2011.02.001
- Eaton, B., Gregory, J., Drach, B., Taylor, K., Hankin, S., Caron, J., … Juckes, M. (2011). NetCDF climate and forecast (CF) metadata conventions (version 1.6). Retrieved from http://cfconventions.org/cf-conventions/v1.6.0/cf-conventions.html
- Eliasson, I. (2000). The use of climate knowledge in urban planning. Landscape and Urban Planning, 48(1), 31–44. doi: 10.1016/S0169-2046(00)00034-7
- Enke, W., Deutschländer, T., Schneider, F., & Küchler, W. (2005). Results of five regional climate studies applying a weather pattern based downscaling method to ECHAM4 climate simulation. Meteorologische Zeitschrift, 14(2), 247–257. doi: 10.1127/0941-2948/2005/0028
- Fallmann, J., Wagner, S., & Emeis, S. (2017). High resolution climate projections to assess the future vulnerability of European urban areas to climatological extreme events. Theoretical and Applied Climatology, 127(3-4), 667–683. doi: 10.1007/s00704-015-1658-9
- Feddersen, H., & Andersen, U. (2005). A method for statistical downscaling of seasonal ensemble predictions. Tellus A: Dynamic Meteorology and Oceanography, 57(3), 398–408. doi: 10.3402/tellusa.v57i3.14656
- Feser, F., Rockel, B., von Storch, H., Winterfeldt, J., & Zahn, M. (2011). Regional climate models add value to global model data: A review and selected examples. Bulletin of the American Meteorological Society, 92(9), 1181–1192. doi: 10.1175/2011BAMS3061.1
- Fowler, H. J., Blenkinsop, S., & Tebaldi, C. (2007). Linking climate change modelling to impacts studies: Recent advances in downscaling techniques for hydrological modelling. International Journal of Climatology, 27(12), 1547–1578. doi: 10.1002/joc.1556
- Fowler, H. J., & Kilsby, C. G. (2002). Precipitation and the North Atlantic oscillation: A study of climatic variability in Northern England. International Journal of Climatology, 22(7), 843–866. doi: 10.1002/joc.765
- Fox-Rabinovitz, M., Cote, J., Dugas, B., Deque, M., McGregor, J. L., & Belochitski, A. (2008). Stretched-grid model intercomparison project: Decadal regional climate simulations with enhanced variable and uniform-resolution GCMs. Meteorology and Atmospheric Physics, 100(1), 159–178. doi: 10.1007/s00703-008-0301-z
- Früh, B., Becker, P., Deutschländer, T., Hessel, J.-D., Kossmann, M., Mieskes, I., … Wienert, U. (2011). Estimation of climate-change impacts on the urban heat load using an urban climate model and regional climate projections. Journal of Applied Meteorology and Climatology, 50(1), 167–184. doi: 10.1175/2010JAMC2377.1
- George, J., Janaki, L., & Gomathy, J. P. (2016). Statistical downscaling using local polynomial regression for rainfall predictions – A case study. Water Resources Management, 30(1), 183–193. doi: 10.1007/s11269-015-1154-0
- Georgescu, M., Chow, W. T. L., Wang, Z. H., Brazel, A., Trapido-Lurie, B., Roth, M., & Benson-Lira, V. (2015). Prioritizing urban sustainability solutions: Coordinated approaches must incorporate scale-dependent built environment induced effects. Environmental Research Letters, 10(6), 61001. doi: 10.1088/1748-9326/10/6/061001
- Georgi, B., Isoard, S., Asquith, M., Garzillo, C., Swart, R. J., & Timmerman, J. G. (2016). Urban adaptation to climate change in Europe 2016: Transforming cities in a changing climate ( EEA Report No 12/2016). Denmark: European Environment Agency. doi: 10.2800/021466
- Getter, K. L., & Rowe, D. B. (2006). The role of extensive green roofs in sustainable development. HortScience, 41(5), 1276–1285.
- Gilleland, E., & Katz, R. W. (2016). extRemes 2.0: An extreme value analysis package in R. Journal of Statistical Software, 72(8), 1–39. doi: 10.18637/jss.v072.i08
- Giorgi, F., & Bates, G. T. (1989). The climatological skill of a regional model over complex terrain. Monthly Weather Review, 117(11), 2325–2347. doi: 10.1175/1520-0493(1989)117<2325:TCSOAR>2.0.CO;2
- Giorgi, F., Hewitson, B., Christensen, J., Hulme, M., von Storch, H., Whetton, P., … Xue, Y. (2001). Regional climate information-evaluation and projections. In J. T. Houghton, Y. Ding, D. J. Griggs, M. Noguer, P. J. vad der Linden, X. Dai, K. Maskell, & C. A. Johnson (Eds.), Climate change 2001: The scientific basis (pp. 583–638). Cambridge: Cambridge University Press.
- Glahn, H. R., & Lowry, D. A. (1972). The use of model output statistics (MOS) in objective weather forecasting. Journal of Applied Meteorology, 11(8), 1203–1211. doi: 10.1175/1520-0450(1972)011<1203:TUOMOS>2.0.CO;2
- Goodess, C. M., & Palutikof, J. P. (1998). Development of daily rainfall scenarios for southeast Spain using a circulation-type approach to downscaling. International Journal of Climatology, 18(10), 1051–1083. doi: 10.1002/(SICI)1097-0088(199808)18:10<1051::AID-JOC304>3.0.CO;2-1
- Grimmond, C. S. B., Roth, M., Oke, T. R., Au, Y. C., Best, M., Betts, R., … Voogt, J. (2010). Climate and more sustainable cities: Climate information for improved planning and management of cities (producers/capabilities perspective). Procedia Environmental Sciences, 1, 247–274. doi: 10.1016/j.proenv.2010.09.016
- Gutiérrez, J. M., San-Martín, D., Brands, S., Manzanas, R., & Herrera, S. (2013). Reassessing statistical downscaling techniques for their robust application under climate change conditions. Journal of Climate, 26(1), 171–188. doi: 10.1175/JCLI-D-11-00687.1
- Haigh, R., & Amaratunga, D. (2012). Making cities resilient. International Journal of Disaster Resilience in the Built Environment, 3(2). doi: 10.1108/ijdrbe.2012.43503baa.001
- Hayhoe, K., Cayan, D., Field, C. B., Frumhoff, P. C., Maurer, E. P., Miller, N. L., … Verville, J. H. (2004). Emissions pathways, climate change, and impacts on California. Proceedings of the National Academy of Sciences, 101(34), 12422–12427. doi: 10.1073/pnas.0404500101
- Haylock, M. R., Hofstra, N., Klein Tank, A. M. G., Klok, E. J., Jones, P. D., & New, M. (2008). A European daily high-resolution gridded data set of surface temperature and precipitation for 1950–2006. Journal of Geophysical Research, 113, D20119. doi: 10.1029/2008JD010201
- Hellström, C., Chen, D., Achberger, C., & Räisänen, J. (2001). Comparison of climate change scenarios for Sweden based on statistical and dynamical downscaling of monthly precipitation. Climate Research, 19(1), 45–55. doi: 10.3354/cr019045
- Hengeveld, H. (2000). Projections for Canada’s climate future: A discussion of recent simulations with the Canadian global climate model ( Report CCD 00-01, Special Edition). Downsview, ON: Environment Canada.
- Hewitson, B. C., & Crane, R. G. (2006). Consensus between GCM climate change projections with empirical downscaling: Precipitation downscaling over South Africa. International Journal of Climatology, 26(10), 1315–1337. doi: 10.1002/joc.1314
- Hingray, B., & Haha, M. B. (2005). Statistical performances of various deterministic and stochastic models for rainfall series disaggregation. Atmospheric Research, 77(1), 152–175. doi: 10.1016/j.atmosres.2004.10.023
- Hong, S.-Y., & Kanamitsu, M. (2014). Dynamical downscaling: Fundamental issues from an NWP point of view and recommendations. Asia-Pacific Journal of Atmospheric Sciences, 50(1), 83–104. doi: 10.1007/s13143-014-0029-2
- Hostetler, S. W. (1994). Hydrologic and atmospheric models: The (continuing) problem of discordant scales. Climatic Change, 27(4), 345–350. doi: 10.1007/BF01096266
- Howard, G., Calow, R., Macdonald, A., & Bartram, J. (2016). Climate change and water and sanitation: Likely impacts and emerging trends for action. Annual Review of Environment and Resources, 41, 253–276. doi: 10.1146/annurev-environ-110615-085856
- Hu, Y., & Jia, G. (2010). Influence of land use change on urban heat island derived from multi-sensor data. International Journal of Climatology, 30(9), 1382–1395.
- Huang, Q., & Lu, Y. (2015). The effect of urban heat island on climate warming in the Yangtze River Delta urban agglomeration in China. International Journal of Environmental Research and Public Health, 12(8), 8773–8789. doi: 10.3390/ijerph120808773
- Hughes, S. (2017). The politics of urban climate change policy: Toward a research agenda. Urban Affairs Review, 53(2), 362–380. doi: 10.1177/1078087416649756
- Hunt, A., & Watkiss, P. (2011). Climate change impacts and adaptation in cities: A review of the literature. Climatic Change, 104(1), 13–49. doi: 10.1007/s10584-010-9975-6
- Huth, R. (1999). Statistical downscaling in central Europe: Evaluation of methods and potential predictors. Climate Research, 13(2), 91–101. doi: 10.3354/cr013091
- Jacob, D., Petersen, J., Eggert, B., Alias, A., Christensen, O. B., Bouwer, L. M., … Yiou, P. (2014). EURO-CORDEX: New high-resolution climate change projections for European impact research. Regional Environmental Change, 14(2), 563–578. doi: 10.1007/s10113-013-0499-2
- Joshi, D., St-Hilaire, A., Ouarda, T., & Daigle, A. (2015). Statistical downscaling of precipitation and temperature using sparse Bayesian learning, multiple linear regression and genetic programming frameworks. Canadian Water Resources Journal/Revue Canadienne Des Ressources Hydriques, 40(4), 392–408. doi: 10.1080/07011784.2015.1089191
- Kalnay, E., & Cai, M. (2003). Impact of urbanization and land-use change on climate. Nature, 423(6939), 528–531. doi: 10.1038/nature01675
- Karl, T. R., Wang, W.-C., Schlesinger, M. E., Knight, R. W., & Portman, D. (1990). A method of relating general circulation model simulated climate to the observed local climate. Part I: Seasonal Statistics. Journal of Climate, 3(10), 1053–1079.
- Khan, M. S., Coulibaly, P., & Dibike, Y. (2006). Uncertainty analysis of statistical downscaling methods using Canadian global climate model predictors. Hydrological Processes, 20(14), 3085–3104. doi: 10.1002/hyp.6084
- Kidson, J. W., & Thompson, C. S. (1998). A comparison of statistical and model-based downscaling techniques for estimating local climate variations. Journal of Climate, 11(4), 735–753. doi: 10.1175/1520-0442(1998)011<0735:ACOSAM>2.0.CO;2
- Kim, B.-S., Kim, B.-K., & Kwon, H.-H. (2011). Assessment of the impact of climate change on the flow regime of the Han River basin using indicators of hydrologic alteration. Hydrological Processes, 25(5), 691–704. doi: 10.1002/hyp.7856
- Kim, J. W., Chang, J. T., Baker, N. L., Wilks, D. S., & Gates, W. L. (1984). The statistical problem of climate inversion: Determination of the relationship between local and large-scale climate. Monthly Weather Review, 112(10), 2069–2077. doi: 10.1175/1520-0493(1984)112<2069:TSPOCI>2.0.CO;2
- Klein Tank, A. M. G., Zwiers, F. W., & Zhang, X. (2009). Guidelines on analysis of extremes in a changing climate in support of informed decisions for adaptation ( Climate Data and Monitoring WCDMP-No. 72, WMO-TD No. 1500). Geneva: World Meteorological Organization.
- Korhonen, N., Venäläinen, A., Seppä, H., & Järvinen, H. (2014). Statistical downscaling of a climate simulation of the last glacial cycle: Temperature and precipitation over Northern Europe. Climate of the Past, 10(4), 1489–1500. doi: 10.5194/cp-10-1489-2014
- Kousky, C. (2014). Informing climate adaptation: A review of the economic costs of natural disasters. Energy Economics, 46, 576–592. doi: 10.1016/j.eneco.2013.09.029
- Kusaka, H., Masayuki, H., & Takane, Y. (2012). Urban climate projection by the WRF model at 3-km horizontal grid increment: Dynamical downscaling and predicting heat stress in the 2070s August for Tokyo, Osaka, and Nagoya metropolises. Journal of the Meteorological Society of Japan. Ser. II, 90B, 47–63. doi: 10.2151/jmsj.2012-B04
- Kwan, S. C., & Hashim, J. H. (2016). A review on co-benefits of mass public transportation in climate change mitigation. Sustainable Cities and Society, 22, 11–18. doi: 10.1016/j.scs.2016.01.004
- Kyselý, J. (2002). Comparison of extremes in GCM-simulated, downscaled and observed central-European temperature series. Climate Research, 20(3), 211–222. doi: 10.3354/cr020211
- Lal, M., McGregor, J. L., & Nguyen, K. C. (2008). Very high-resolution climate simulation over Fiji using a global variable-resolution model. Climate Dynamics, 30(2–3), 293–305. doi: 10.1007/s00382-007-0287-0
- Lee, O., Park, M., Lee, J., & Kim, S. (2016). Future PMPs projection according to precipitation variation under RCP 8.5 climate change scenario. Journal of Korea Water Resources Association, 49(2), 107–119. doi: 10.3741/JKWRA.2016.49.2.107
- Lemonsu, A., Kounkou-Arnaud, R., Desplat, J., Salagnac, J.-L., & Masson, V. (2013). Evolution of the Parisian urban climate under a global changing climate. Climatic Change, 116(3–4), 679–692. doi: 10.1007/s10584-012-0521-6
- Leung, L. R., Mearns, L. O., Giorgi, F., & Wilby, R. L. (2003). Regional climate research. Bulletin of the American Meteorological Society, 84(1), 89–95. doi: 10.1175/BAMS-84-1-97
- Li, M., Gu, S., Bi, P., Yang, J., & Liu, Q. (2015). Heat waves and morbidity: Current knowledge and further direction-a comprehensive literature review. International Journal of Environmental Research and Public Health, 12(5), 5256–5283. doi: 10.3390/ijerph120505256
- Li, T., Horton, R. M., Bader, D. A., Zhou, M., Liang, X., Ban, J., … Kinney, P. L. (2016). Aging will amplify the heat-related mortality risk under a changing climate: Projection for the elderly in Beijing, China. Scientific Reports, 6, 28161. doi: 10.1038/srep28161
- Liu, Y., & Fan, K. (2012). Prediction of spring precipitation in China using a downscaling approach. Meteorology and Atmospheric Physics, 118(1–2), 79–93. doi: 10.1007/s00703-012-0202-z
- Llopart, M., Coppola, E., Giorgi, F., Da Rocha, R. P., & Cuadra, S. V. (2014). Climate change impact on precipitation for the Amazon and La Plata basins. Climatic Change, 125(1), 111–125. doi: 10.1007/s10584-014-1140-1
- Lorenz, S., Dessai, S., Forster, P. M., & Paavola, J. (2017). Adaptation planning and the use of climate change projections in local government in England and Germany. Regional Environmental Change, 17(2), 425–435. doi: 10.1007/s10113-016-1030-3
- Lu, X., Chow, K.-C., Yao, T., Lau, A. K. H., & Fung, J. C. H. (2010). Effects of urbanization on the land sea breeze circulation over the Pearl River Delta region in winter. International Journal of Climatology, 30(7), 1089–1104.
- Malakar, K., & Mishra, T. (2017). Assessing socio-economic vulnerability to climate change: A city-level index-based approach. Climate and Development, 9(4), 348–363. doi: 10.1080/17565529.2016.1154449
- Maraun, D., Wetterhall, F., Ireson, A. M., Chandler, R. E., Kendon, E. J., Widmann, M., … Thiele-Eich, I. (2010). Precipitation downscaling under climate change: Recent developments to bridge the gap between dynamical models and the end user. Reviews of Geophysics, 48(3), 219. doi: 10.1029/2009RG000314
- Martin, S. L., Cakmak, S., Hebbern, C. A., Avramescu, M.-L., & Tremblay, N. (2012). Climate change and future temperature-related mortality in 15 Canadian cities. International Journal of Biometeorology, 56(4), 605–619. doi: 10.1007/s00484-011-0449-y
- Martins, R. D., & Ferreira, L. D. C. (2011). Opportunities and constraints for local and subnational climate change policy in urban areas: Insights from diverse contexts. International Journal of Global Environmental Issues, 11(1), 37–53. doi: 10.1504/IJGENVI.2011.040250
- Marzban, C., Sandgathe, S., & Kalnay, E. (2006). MOS, perfect prog, and reanalysis. Monthly Weather Review, 134(2), 657–663. doi: 10.1175/MWR3088.1
- Mason, S. J. (2004). Simulating climate over western North America using stochastic weather generators. Climatic Change, 62(1), 155–187. doi: 10.1023/B:CLIM.0000013700.12591.ca
- Mearns, L. O., Giorgi, F., Whetton, P., Pabon, D., Hulme, M., & Lal, M. (2003). Guidelines for use of climate scenarios developed from regional climate model experiments. IPCC Task Group on Scenarios for Climate Impact Assessment (TGCIA). Retrieved from the Data Distribution Centre of the Intergovernmental Panel on Climate Change.
- Mendlik, T., & Gobiet, A. (2016). Selecting climate simulations for impact studies based on multivariate patterns of climate change. Climatic Change, 135(3–4), 381–393. doi: 10.1007/s10584-015-1582-0
- Mendlik, T., Heinrich, G., & Leuprecht, A. (2016). wux: Wegener center climate uncertainty explorer. R package version 2.2-1. Retrieved from https://CRAN.R-project.org/package=wux
- Mills, G., Cleugh, H., Emmanuel, R., Endlicher, W., Erell, E., McGranahan, G., … Steemer, K. (2010). Climate information for improved planning and management of mega cities (needs perspective). Procedia Environmental Sciences, 1, 228–246. doi: 10.1016/j.proenv.2010.09.015
- Mirza, M. M. Q. (2003). Climate change and extreme weather events: Can developing countries adapt? Climate Policy, 3(3), 233–248. doi: 10.3763/cpol.2003.0330
- Molenaar, R. E., Heusinkveld, B. G., & Steeneveld, G. J. (2016). Projection of rural and urban human thermal comfort in The Netherlands for 2050. International Journal of Climatology, 36(4), 1708–1723. doi: 10.1002/joc.4453
- Müller-Wohlfeil, D.-I., Bürger, G., & Lahmer, W. (2000). Response of a river catchment to climatic change: Application of expanded downscaling to Northern Germany. Climatic Change, 47(1), 61–89. doi: 10.1023/A:1005613306339
- Murray, C. E. C. (2011). Driving long-term urban success: Culture, creativity, competitiveness, and a psychological perspective on the city. International Journal of Urban Sciences, 15(2), 71–78. doi: 10.1080/12265934.2011.615903
- Olazabal, M., de Gregorio Hurtado, S., Olazabal, E., Pietrapertosa, F., Salvia, M., Geneletti, D., … Reckien, D. (2014). How are Italian and Spanish cities tackling climate change? A local comparative study ( BC3 Working Paper 2014-03). Leioa: Basque Centre for Climate Change.
- Onof, C., & Arnbjerg-Nielsen, K. (2009). Quantification of anticipated future changes in high resolution design rainfall for urban areas. Atmospheric Research, 92(3), 350–363. doi: 10.1016/j.atmosres.2009.01.014
- Osca, J., Romero, R., & Alonso, S. (2013). Precipitation projections for Spain by means of a weather typing statistical method. Global and Planetary Change, 109, 46–63. doi: 10.1016/j.gloplacha.2013.08.001
- Parlange, M. B., & Katz, R. W. (2000). An extended version of the Richardson model for simulating daily weather variables. Journal of Applied Meteorology, 39(5), 610–622. doi: 10.1175/1520-0450-39.5.610
- Peng, S., Piao, S., Ciais, P., Friedlingstein, P., Ottle, C., Bréon, F.-M., … Myneni, R. B. (2012). Surface urban heat island across 419 global big cities. Environmental Science & Technology, 46(2), 696–703. doi: 10.1021/es2030438
- Peterson, T. C., McGuirk, M., Houston, T. G., Horvitz, A. H., & Wehner, M. F. (2008, January). Climate variability and change with implications for transportation. 20th Conference on Climate Variability and Change, New Orleans, LA, American Meteorological Society.
- Pfizenmayer, A., & von Storch, H. (2001). Anthropogenic climate change shown by local wave conditions in the North Sea. Climate Research, 19(1), 15–23. doi: 10.3354/cr019015
- Qian, B., Hayhoe, H., & Gameda, S. (2005). Evaluation of the stochastic weather generators LARS-WG and AAFC-WG for climate change impact studies. Climate Research, 29(1), 3–21. doi: 10.3354/cr029003
- Ramos, Y., St-Onge, B., Blanchet, J.-P., & Smargiassi, A. (2016). Spatio-temporal models to estimate daily concentrations of fine particulate matter in Montreal: Kriging with external drift and inverse distance-weighted approaches. Journal of Exposure Science and Environmental Epidemiology, 26(4), 405–414. doi: 10.1038/jes.2015.79
- Rasheed, A. M., Egodawatta, P., Goonetilleke, A., & McGree, J. (2017). Spdownscale: Spatial downscaling using bias correction approach. R package version 0.1.0. Retrieved from https://CRAN.R-project.org/package=spdownscale
- Rew, R., Davis, G., Emmerson, S., Davies, H., Hartnett, E., & Heimbigner, D. (2011). The NetCDF users guide: Data model, programming interfaces, and format for self-describing, portable data ( NetCDF Version 4.1.2). UNIDATA Program Center of the University Corporation for Atmospheric Research. Retrieved from http://www.unidata.ucar.edu/software/netcdf//old_docs/docs_4_1_2/netcdf.pdf
- Reynard, N. S., Prudhomme, C., & Crooks, S. M. (2001). The flood characteristics of large UK rivers: Potential effects of changing climate and land use. Climatic Change, 48(2), 343–359. doi: 10.1023/A:1010735726818
- Rosenzweig, C., Solecki, W. D., Hammer, S. A., & Mehrotra, S. (Eds.). (2011). Climate change and cities: First assessment report of the urban climate change research network. Cambridge: Cambridge University Press.
- Rössler, O., Fischer, A. M., Huebener, H., Maraun, D., Benestad, R. E., Christodoulides, P., … Vlachogiannis, D. (2017). Challenges to link climate change data provision and user needs – perspective from the COST-action VALUE. International Journal of Climatology. Advance online publication. doi: 10.1002/joc.5060
- Ruddell, D. M., & Dixon, P. G. (2014). The energy–water nexus: Are there tradeoffs between residential energy and water consumption in arid cities? International Journal of Biometeorology, 58(7), 1421–1431. doi: 10.1007/s00484-013-0743-y
- Rummukainen, M. (2010). State-of-the-art with regional climate models. Wiley Interdisciplinary Reviews: Climate Change, 1(1), 82–96.
- Russo, S., Sillmann, J., & Fischer, E. M. (2015). Top ten European heatwaves since 1950 and their occurrence in the coming decades. Environmental Research Letters, 10(12), 124003. doi: 10.1088/1748-9326/10/12/124003
- Sarhadi, A., Burn, D. H., Yang, G., & Ghodsi, A. (2017). Advances in projection of climate change impacts using supervised nonlinear dimensionality reduction techniques. Climate Dynamics, 48(3-4), 1329–1351. doi: 10.1007/s00382-016-3145-0
- Schoof, J. T. (2013). Statistical downscaling in climatology. Geography Compass, 7, 249–265. doi: 10.1111/gec3.12036
- Schoof, J. T., & Pryor, S. C. (2001). Downscaling temperature and precipitation: A comparison of regression-based methods and artificial neural networks. International Journal of Climatology, 21(7), 773–790. doi: 10.1002/joc.655
- Schulzweida, U. (2017, April). CDO user guide. Climate data operators. Version 1.8.1, p. 206. Retrieved from https://code.mpimet.mpg.de/projects/cdo/embedded/cdo.pdf
- Skourkeas, A., Kolyva-Machera, F., & Maheras, P. (2013). Improved statistical downscaling models based on canonical correlation analysis, for generating temperature scenarios over Greece. Environmental and Ecological Statistics, 20(3), 445–465. doi: 10.1007/s10651-012-0228-x
- Slonosky, V. C., Jones, P. D., & Davies, T. D. (2001). Atmospheric circulation and surface temperature in Europe from the 18th century to 1995. International Journal of Climatology, 21(1), 63–75. doi: 10.1002/joc.591
- Solecki, W. D., & Oliveri, C. (2004). Downscaling climate change scenarios in an urban land use change model. Journal of Environmental Management, 72(1), 105–115. doi: 10.1016/j.jenvman.2004.03.014
- Spandagos, C., & Ng, T. L. (2017). Equivalent full-load hours for assessing climate change impact on building cooling and heating energy consumption in large asian cities. Applied Energy, 189, 352–368. doi: 10.1016/j.apenergy.2016.12.039
- Sunyer, M. A., Madsen, H., & Ang, P. H. (2012). A comparison of different regional climate models and statistical downscaling methods for extreme rainfall estimation under climate change. Atmospheric Research, 103, 119–128. doi: 10.1016/j.atmosres.2011.06.011
- Swart, R., Sedee, A. G. J., De Pater, F., Goosen, H., Pijnappels, M., & Vellinga, P. (2014). Climate-proofing spatial planning and water management projects: An analysis of 100 local and regional projects in the Netherlands. Journal of Environmental Policy & Planning, 16(1), 55–74. doi: 10.1080/1523908X.2013.817947
- Teutschbein, C., Wetterhall, F., & Seibert, J. (2011). Evaluation of different downscaling techniques for hydrological climate-change impact studies at the catchment scale. Climate Dynamics, 37(9–10), 2087–2105. doi: 10.1007/s00382-010-0979-8
- Trzaska, S., & Schnarr, E. (2014). A review of downscaling methods for climate change projections ( Technical report, United States Agency for International Development). Burlington, Vermont: Tetra Tech ARD.
- UNFCCC Secretariat. (2010). Synthesis report on efforts undertaken to monitor and evaluate the implementation of adaptation projects, policies and programmes and the costs and effectiveness of completed projects, policies and programmes, and views on lessons learned, good practices, gaps and needs ( Report FCCC/SBSTA/2010/5). Bonn: United Nations Framework Convention on Climate Change (UNFCCC).
- United Nations. (2014). World urbanization prospects: The 2014 revision, highlights (ST/ESA/SER.A/352). New York: Department of Economic and Social Affairs, Population Division, United Nations.
- Van der Linden, P., & Mitchell, J. F. B. (Eds.). (2009). ENSEMBLES: Climate change and its impacts: Summary of research and results from the ENSEMBLES project. Exeter: Met Office Hadley Centre.
- Van Vuuren, D. P., Edmonds, J., Kainuma, M., Riahi, K., Thomson, A., Hibbard, K., … Rose, S. K. (2011). The representative concentration pathways: An overview. Climatic Change, 109, 5–31. doi: 10.1007/s10584-011-0148-z
- Vautard, R., Noël, T., Li, L., Vrac, M., Martin, E., Dandin, P., … Joussaume, S. (2013). Climate variability and trends in downscaled high-resolution simulations and projections over Metropolitan France. Climate Dynamics, 41(5-6), 1419–1437. doi: 10.1007/s00382-012-1621-8
- von Storch, H. (1999). On the use of “inflation” in statistical downscaling. Journal of Climate, 12(12), 3505–3506. doi: 10.1175/1520-0442(1999)012<3505:OTUOII>2.0.CO;2
- von Storch, H., Zorita, E., & Cubasch, U. (1991). Downscaling of global climate change estimates to regional scales: An application to Iberian rainfall in wintertime ( Report no. 64). Hamburg: Max Planck Institute for Meteorology.
- von Storch, H., Zorita, E., & Cubasch, U. (1993). Downscaling of global climate change estimates to regional scales: An application to Iberian rainfall in wintertime. Journal of Climate, 6(6), 1161–1171. doi: 10.1175/1520-0442(1993)006<1161:DOGCCE>2.0.CO;2
- Wang, X., Zhang, J., Shahid, S., Guan, E., Wu, Y., Gao, J., & He, R. (2016). Adaptation to climate change impacts on water demand. Mitigation and Adaptation Strategies for Global Change, 21(1), 81–99. doi: 10.1007/s11027-014-9571-6
- Widmann, M., Bretherton, C. S., & Salathé Jr, E. P. (2003). Statistical precipitation downscaling over the northwestern United States using numerically simulated precipitation as a predictor. Journal of Climate, 16(5), 799–816. doi: 10.1175/1520-0442(2003)016<0799:SPDOTN>2.0.CO;2
- Wilby, R. L., Charles, S. P., Zorita, E., Timbal, B., Whetton, P., & Mearns, L. O. (2004). Guidelines for use of climate scenarios developed from statistical downscaling methods. Supporting material of the intergovernmental panel on climate change. Prepared on behalf of Task Group on Data and Scenario Support for Impacts and Climate Analysis (TGICA). Retrieved from the Data Distribution Centre of the Intergovernmental Panel on Climate Change.
- Wilby, R. L., Tomlinson, O. J., & Dawson, C. W. (2003). Multi-site simulation of precipitation by conditional resampling. Climate Research, 23(3), 183–194. doi: 10.3354/cr023183
- Wilby, R. L., & Wigley, T. M. L. (1997). Downscaling general circulation model output: A review of methods and limitations. Progress in Physical Geography, 21(4), 530–548. doi: 10.1177/030913339702100403
- Wilby, R. L., & Wigley, T. M. L. (2000). Precipitation predictors for downscaling: Observed and general circulation model relationships. International Journal of Climatology, 20(6), 641–661. doi: 10.1002/(SICI)1097-0088(200005)20:6<641::AID-JOC501>3.0.CO;2-1
- Wilcke, R. A. I., & Bärring, L. (2016). Selecting regional climate scenarios for impact modelling studies. Environmental Modelling & Software, 78, 191–201. doi: 10.1016/j.envsoft.2016.01.002
- Wilks, D. S. (1995). Statistical methods in the atmospheric sciences. New York: Academic Press.
- Wilks, D. S. (1999). Multisite downscaling of daily precipitation with a stochastic weather generator. Climate Research, 11(2), 125–136. doi: 10.3354/cr011125
- Willems, P., & Vrac, M. (2011). Statistical precipitation downscaling for small-scale hydrological impact investigations of climate change. Journal of Hydrology, 402(3), 193–205. doi: 10.1016/j.jhydrol.2011.02.030
- Wolters, D., & Brandsma, T. (2012). Estimating the urban heat island in residential areas in the Netherlands using observations by weather amateurs. Journal of Applied Meteorology and Climatology, 51(4), 711–721. doi: 10.1175/JAMC-D-11-0135.1
- World Meteorological Organization. (2014). Implementation plan of the global framework for climate services. Geneva: Author.
- Xue, Y., Janjic, Z., Dudhia, J., Vasic, R., & De Sales, F. (2014). A review on regional dynamical downscaling in intraseasonal to seasonal simulation/prediction and major factors that affect downscaling ability. Atmospheric Research, 147-148, 68–85. doi: 10.1016/j.atmosres.2014.05.001
- Yang, B.-E. (2007). The role of landscape architecture in the creation and management of the environment-friendly cities in Korea. International Journal of Urban Sciences, 11(2), 156–167. doi: 10.1080/12265934.2007.9693616
- Yuqing, W., Leung, L. R., McGregor, J. L., Dong-Kyou, L. E. E., Wei-Chyung, W., Yihui, D., & Kimura, F. (2004). Regional climate modeling: Progress, challenges, and prospects. Journal of the Meteorological Society of Japan, Ser. II, 82(6), 1599–1628. doi: 10.2151/jmsj.82.1599
- Zhang, N., Gao, Z., Wang, X., & Chen, Y. (2010). Modeling the impact of urbanization on the local and regional climate in Yangtze River Delta, China. Theoretical and Applied Climatology, 102(3–4), 331–342. doi: 10.1007/s00704-010-0263-1
- Zorita, E., & Von Storch, H. (1999). The analog method as a simple statistical downscaling technique: Comparison with more complicated methods. Journal of Climate, 12(8), 2474–2489. doi: 10.1175/1520-0442(1999)012<2474:TAMAAS>2.0.CO;2
- Zwiers, F. W., & Von Storch, H. (2004). On the role of statistics in climate research. International Journal of Climatology, 24(6), 665–680. doi: 10.1002/joc.1027