
Abstract
Scab disease caused by Venturia nashicola is of agroeconomic importance in cultivation of Asian pear. However, little is known about the degree of genetic diversity in the populations of this pathogen. In this study, we collected 55 isolates from pear scab lesions in 13 major cultivation areas in Korea and examined the diversity using sequences of internal transcribed spacer (ITS) region, β-tubulin (TUB2), and translation elongation factor-1α (TEF-1α) genes as molecular markers. Despite a low level of overall sequence variation, we found three distinctive subgroups from phylogenetic analysis of combined ITS, TUB2, and TEF-1α sequences. Among the three subgroups, subgroup 1 (60% of isolates collected) was predominant compared to subgroup 2 (23.6%) or subgroup 3 (16.4%) and was distributed throughout Korea. To understand the genetic diversity among the subgroups, RAPD analysis was performed. The isolates yielded highly diverse amplicon patterns and none of the defined subgroups within the dendrogram were supported by bootstrap values greater than 30%. Moreover, there is no significant correlation between the geographical distribution and the subgroups defined by molecular phylogeny. Our data suggest a low level of genetic diversification among the populations of V. nashicola in Korea.
1. Introduction
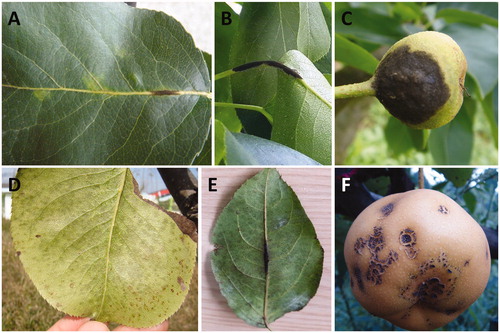
Pears (Pyrus L.) are among the most economically important fruit crops in temperate regions worldwide. Of over 30 diseases reported on pear trees in Korea [Citation1], scab disease has been the most problematic for the growers [Citation2–7]. Typical pear scab symptoms show dark or olive-colored spots on leaves (), petioles (), young fruits in early growing season (), and mature fruits in late growing season (), resulting in defoliation by early fall and deterioration of fruit quality.
Figure 1. Typical symptoms of pear scab. Irregular dark sooty spots (A) on leaf vein, (B) petiole, and (C) young fruit in early growing season. Irregular mild sooty spot (D) on magnified leaf surface, (E) along the midrib and major lateral veins on the leaf surface, and (F) on mature fruit in late growing season.
Pear scab is caused by two pathogens, Venturia nashicola and V. pirina that display distinct host specificities. Venturia nashicola only infects Asian pears including Japanese pear and Chinese pear [Citation8], whereas V. pirina is a pathogen of the European pear [Citation9]. In addition, V. inaequalis causes apple scab, but is not pathogenic on pears [Citation10–12]. Sivanesan (1977) has previously reported that V. nashicola and V. pirina are synonymous [Citation13]. However, there have been several reports that these two pathogens are clearly distinguished by phylogenetic analysis [Citation11,Citation12,Citation14,Citation15], mycological characteristics, as well as pathogenicity [Citation2].
To analyze the genetic variation in pathogenic fungi, several molecular markers such as the internal transcribed spacer (ITS) region, β-tubulin (TUB2), translation elongation factor-1α (TEF-1α), actin, calmodulin, and cytochrome oxidase I (COI), have been developed. The most routinely used among these markers is the internal transcribed spacer (ITS) sequences, spanning the rRNA regions [Citation16]. For Venturia spp., sequence analysis of ITS region showed clear separation between V. nashicola and V. pirina which are derived from Asian pear and European pear, respectively [Citation11].
However, the ITS sequence alone provides limited resolution in phylogenetic analysis of closely related species. Multigene sequence analysis has been known to enable resolution of variation at inter- and even intraspecies levels [Citation8,Citation17]. Zhao et al., reported that multigene phylogenetic analysis using a combined data set of ITS region, partial TUB2, and partial TEF-1α gene sequences showed clear separation of V. nashicola and V. pirina [Citation12].
Random amplified polymorphic DNA (RAPD) analysis has been extensively applied to detect genetic difference among races, formae speciales, or population of plant pathogenic fungi [Citation18–22]. The RAPD method allows rapid and simple detection of genetic variation, compared to other molecular genotyping methods, such as restriction fragment length polymorphisms or amplified fragment length polymorphisms.
In Korea, more than 80% of cultivated pear is cv. “Niitaka”. Since cv. “Niitaka” is highly susceptible to V. nashicola, an extensive breeding program has been conducted to develop disease resistant cultivar to replace it [Citation6,Citation23,Citation24]. Understanding the genetic variation of V. nashicola should support and compliment the development of resistant cultivars for effective disease control.
The objectives of this study was to investigate the genetic diversity and population structure of V. nashicola isolates from Asian pear in Korea based on ITS, TUB2, and TEF-1α gene sequences and by RAPD analysis.
2. Materials and methods
2.1. Collection of isolates and culture condition
In order to investigate the genetic diversity of the Korean V. nashicola population, fungal isolates were collected from scab lesions of pear trees cultivated in 13 major pear growing areas over 2013–2015 (). As an authentic isolates, KCTC6484 from Korean Collection for Type Cultures (KCTC) and four isolates from Japan, MAFF615002, MAFFF615003, MAFF615023, and MAFF615029, which have been previously used for crossing [Citation25], were included in our analysis ().
Table 1. Isolates of Venturia nashicola, V. pirina, and V. inaequalis used in this study.
All the isolates were cultured on potato dextrose agar (PDA) at 20°C in the dark for 60 d and then used for the experiments. For DNA extraction, fungal isolates were grown in 50 ml of potato dextrose broth at 20°C for 60 d.
2.2. DNA extraction and PCR amplification
Genomic DNA was extracted using the DNeasy Plant Mini kit (Qiagen, Hilden, Germany) according to the manufacturer’s instructions. The concentration of the extracted genomic DNA was estimated by spectrophotometry (Nanodrop; Thermo Scientific, Waltham, MA). The extracted genomic DNA was kept at ˗20°C for further experiments.
The partial 18S rRNA-ITS (internal transcribed spacer)1-5.8S rRNA-ITS2-28S rRNA region, was amplified with universal primers ITS1 (5′-TCCGTAGGTGAACCTGCGG-3′) and ITS4 (5′-TCCTCCGCTTATTGATATGC-3′) as described by White et al. [Citation16]. PCR was performed using AccuPower PCR Premix (Bioneer, Daejeon, Korea). After adding 1 µl of template DNA (100 ng/µl), 1 µl of each ITS1 and ITS4 primer to the reaction solution, the final volume was adjusted to 20 µl with distilled water. PCR amplification was carried out using Thermal Cycler (Takara Bio Inc., Shiga, Japan) as follows: initial denaturation at 94°C for 3 min, followed by 30 cycles of 50 s at 94°C, 50 s at 55°C and 2 min at 72°C, and then finally 10 min at 72°C.
The partial TUB2 sequence was amplified with primer Btub14F (5′-AACCAAATTGGTGCTGCCTTCTG-3′) and BtubR (5′-TGGAGGACATCTTAAGACCACG-3′) as described by Kwak et al. [Citation26]. The partial TEF-1α sequence was amplified with primer VNEFI-f (5′-ACTTGATCTACAAGTGCGGTG-3′) and VNEFI-r (5′-AGGAGTCTCACTTCCAGAG-3′) as described by Zhao et al. [Citation12].
TUB2and TEF-1α samples were prepared in the same way as ITS samples. The PCR of TUB2 and TEF-1α was carried out as follows: initial denaturation of 3 min at 94°C, followed by 30 cycles of 30 s at 94°C, 30 s at 55°C and 2 min at 72°C, and then finally 5 min at 72°C.
2.3. Nucleotide sequencing
The amplified PCR products were purified using AccuPrep™ PCR purification kit (Bioneer) according to the manufacturer’s instructions and then subjected to sequencing analysis at Cosmogenetech (Daejeon, Korea).
2.4. Sequence alignments and phylogenetic analysis
The generated sequences were edited and assembled using Codoncode program (CodonCode Corporation, Dedham, MA). All the sequences generated in this study were initially verified by Basic Local Alignment Search Tool (BLAST) (https://blast.ncbi.nlm.nih.gov/Blast.cgi) in National Center for Biotechnology Information (NCBI).
The sequences verified by BLAST searches and the sequences retrieved from GenBank (http://www.ncbi.nlm.gov) were initially aligned using Clustal W (MEGA ver. 7.0) [Citation27]. Two Venturia species, V. inaequalis and V. pirina, which are pathogens of European pear and apples, respectively, were used as outgroups (). Phylogenetic analysis was conducted using the maximum likelihood (ML) method and neighbor joining (NJ) in MEGA version 7.0 software [Citation27]. Reliability of the inferred tree was tested by 1000 bootstrap replications of the ML and NJ tree to verify the reliability of the branches. Tamura-Nei model of the ML method and Kimura two-parameter model for the NJ method were used for the analyses.
2.5. RAPD and statistical analysis
Ten 10-mer primers were used for RAPD analysis (). PCR was performed using AccuPower PCR Premix (Bioneer). After adding 1 µl of template DNA (100 ng/µl) and 1 µl of primer (10 pmol/µl) to the reaction mixture, the final volume of the reaction was adjusted to 25 µl with distilled water.
Table 2. Nucleotide sequences of 10-mer oligonucleotide primers used for RAPD analysis of Venturia nashicola isolates.
The PCR was performed as follows: initial cycles of 5 min at 94°C, followed by 40 cycles of 30 s at 94°C, 1 min at 37°C and 1 min at 72°C, and then finally 7 min at 72°C. The PCR products were analyzed by electrophoresis in 1.5% agarose gels and detected by staining with Dyne LoadingSTAR (DYNE BIO., Seongnam, Korea).
RAPD profiles were scored visually with a binary scoring system (1 for presence and 0 for absence at each band position). Only the major amplification products were scored, and this was based on the assumption that products of the same size and electrophoretic mobility in different isolates were identical. Data obtained from the 10 primers were pooled together. Based on this similarity matrix, a phenogram was constructed via the unweighted pair group methods using arithmetic means (UPGMA) analysis in NTSYS-pc program ver.2.2 (Exeter Software, Setauket, NY). Bootstrapping with 2000 replicates was carried out to assess the robustness of clusters in the phenograms using WINBOOT program [Citation28] and NTSYS-PC.
3. Results
3.1. Identification of fungal isolates
Identification of the collected isolates was carried out based on the morphological characteristics as reported by Tanaka and Yamamoto [Citation8] and Ishii and Yanase [Citation2]. The isolates produced dark colonies on PDA (). The conidia produced on the plates were brown and unicellular, long oval or fusiform measuring 8.2 to 18.8 µm × 5.1 to 7.8 µm (). Conidiophores were also brown in color, clustered, and erect measuring 10 to 15 µm (). Pseudothecia was dark brown and globoid with brown cells measuring 50 to 150 µm × 59 to 140 µm (). Asci were hyaline and club-shaped measuring 38 to 63 µm × 5 to 10 µm () and ascospores were two-celled, hyaline, or light brown and shoesole-shaped, measuring 12 to 15 µm × 3 to 4.5 µm (). These morphological characteristics are consistent with those previously described for V. nashicola [Citation2,Citation8] ().
Figure 2. Mycological characteristics of Venturia nashicola. (A) 60 d-old colony on PDA at 20 °C in the dark; (B) Conidia; (C) Conidiophore; (D) Pseudothecia, (E) Asci; (F) Ascospores.
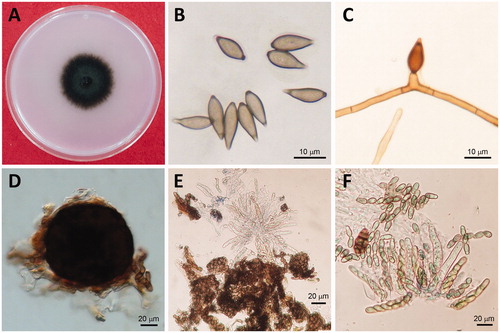
Table 3. Comparison of mycological characteristics of the isolates collected in this study and Venturia nashicola isolates described previously.
The ITS (NCBI accession numbers: MH725922-MH725921), TUB2 (MH725982-MH725981), and TEF-1α (MH726042-MH726041) sequences matched with V. nashicola reference sequences [Citation12] with over 99% identity for all the isolates that we examined in this study.
3.2. Variation of ITS region sequences
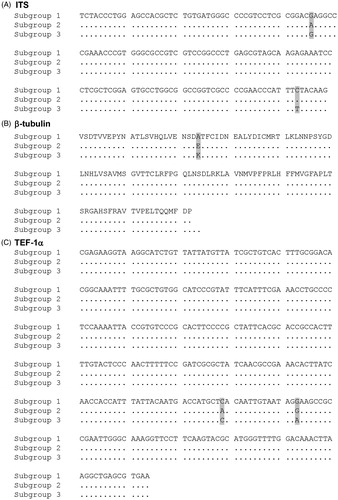
Three ITS2 sequence types could be assigned to the 60 isolates sequenced in this study and nine sequences of N. nashicola isolates retrieved from GenBank (). The consensus nucleotide sequences of ITS2 are shown in . The three ITS2 types are designated subgroup 1 to 3; ITS2-subgroup 1 had G and C; ITS2-subgroup 2 had A and C; and ITS2-subgroup 3 had G and T at the 46th and the 143rd positions of the ITS2 region sequences (Supplementary Table S1). Phylogenetic analysis based on ITS sequences showed that V. nashicola isolates were classified into three subgroups (subgroup 1, 2 and 3), clearly distinct from V. pirina and V. inaequalis isolates (Supplementary Figure S1).
Figure 3. Comparison of representative sequences of subgroups 1 to 3. (A) ITS2 region. (B) Partial protein sequences of β-tubulin. (C) Translation elongation factor-1α.
3.3. Variation of β-tubulin sequences
Three TUB2 amino acid sequence types were detected from the 60 isolates examined in this study. The consensus protein sequences of TUB2 are shown in . We detected the three types of variation in the 198th codon defining subgroups 1 to 3: subgroup 1 had alanine (A, GCG); subgroup 2 had glutamine (E, GAG); and subgroup 3 had lysine (K, AAG) (Supplementary Table S1). All the 55 isolates collected in this study and two standard isolates, MAFF615003 and MAFF615029, belonged to subgroup 1. The standard isolates KCTC6484 and MAFF615002 belonged to subgroup 2, whereas MAFF615023 was classified as subgroup 3 (Supplementary Table S1). Phylogenetic analysis showed that V. nashicola isolates were classified into two branches, clearly distinguished from V. pirina and V. inaequalis isolates (Supplementary Figure S2).
3.4. Variation of TEF-1α sequences
The 60 isolates from this study and nine N. nashicola sequences retrieved from GenBank were classified into three types according to variation of TEF-1α sequence at positions 229 and 243 (). The consensus nucleotide sequences of TEF-1α are shown in . The three TEF-1α types were designated subgroups 1 to 3; subgroup 1 had C and A; subgroup 2 had C and G; and subgroup 3 had A and G in 229th and 243rd positions, respectively (Supplementary Table S1). Phylogenetic analysis showed that V. nashicola isolates were grouped into two branches, clearly distinct from V. pirina and V. inaequalis isolates (Supplementary Figure S3). All the V. nashicola isolates were clustered together, except isolates KCTC6484, 15SAJ-P-4, Yasato2-1-1, and OYO-1. These four isolates were clustered separately (Supplementary Figure S3).
3.5. Phylogenetic analysis
The combined sequence of the ITS region, TUB2, and TEF-1α genes used in this study is composed of 1137 nucleotides, containing 1129 conserved nucleotides and 8 variable positions. ML analyses were carried out to generate phylogenetic trees of the isolates. One of the ML trees is shown in . A NJ tree is included as Supplementary Figure S4 for comparison with the ML tree.
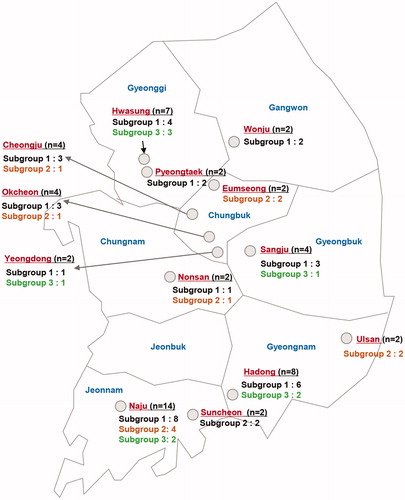
Three clusters were detected among the V. nashicola isolates, but with weakly supporting bootstrap values. We designated subgroups 1 to 3 (), which turned out to have the identical composition as the ITS2-based subgroups 1 to 3. The geographical distribution of subgroups 1 to 3 is marked in the 13 major pear-cultivating regions in Korea (). Despite low bootstrap values supporting the branches, we designated these subgroups 1 to 3 () to detect spatiotemporal differences. However, we could not find a correlation between subgroups and sampling locations or sampling years (data not shown).
Figure 4. Maximum likelihood tree generated by a combined alignment of ITS region including 5.8S rRNA, partial β-tubulin gene and partial translation elongation factor 1-α gene sequences from Venturia nashicola. All V. nashicola sequences were newly generated in this study, except those marked in red, which were retrieved from GenBank. Standard V. nashicola isolates from Korea (KCTC, Korean culture collection) and Japan (MAFF) are indicated in blue. Isolates of V. pirina and V. inaequalis were used as outgroups. The numbers at nodes represent the percentage of their occurrence in 1000 bootstrap replicates.
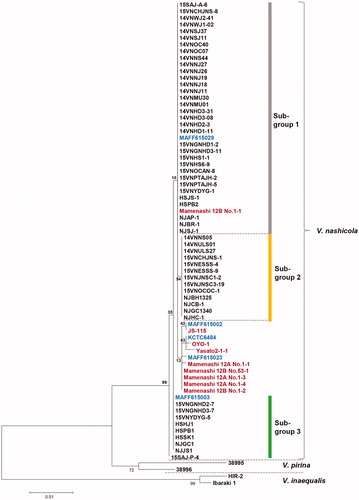
Figure 5. Collection map of Venturia nashicola isolates from Japanese pear in Korea over 2013–2015 and distribution of subgroups 1 to 3. n=number of isolates.
3.6. RAPD analysis
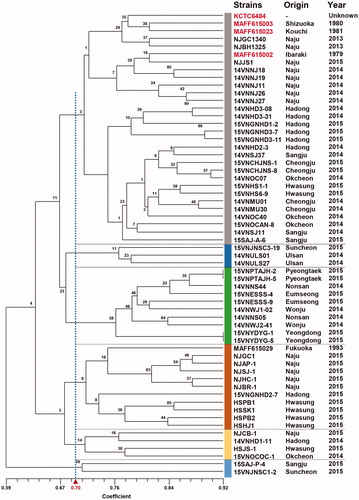
We examined 60 isolates including 55 isolates collected in this study and five standard V. nashicola isolates (). In total, 108 polymorphic bands were detected by PCR amplification using 10 random primers. The isolates tested exhibited highly dissimilar band patterns. A dendrogram by UPGMA is shown in . Greater than 59% similarity was observed based on 108 polymorphic bands detected. Six clusters were arbitrarily defined based on 70% similarity in the dendrogram (). However, none of these clusters are supported by boostrapping (<58% support). We could not find any correlation between the clusters and geographical (sampling location) or temporal (sampling year) distribution (data not shown).
Figure 6. UPGMA dendrogram of 55 Venturia nashicola isolates collected in this study and five standard V. nashicola isolates based on RAPD polymorphism. Data from 10 different 10-mer primers were combined and used to construct a dendrogram. Origin and year of collection was indicated on the right for individual isolates. Standard V. nashicola isolates of Korea and Japan are indicated in red.
4. Discussion
Phylogenetic analyses are pertinent for resolving fungal taxa and understanding the evolution of fungal populations, especially as an ever-increasing number of fungi are being discovered and their genomes sequenced [Citation29]. In Venturia spp., four molecular markers including ITS, TUB2, TEF-1α, and endopolygalacturonase genes have been used for molecular phylogenetic analysis [Citation12,Citation15]. Zhao et al. [Citation12,Citation15] reported that multigene phylogenetic analysis separates the two species, V. nashicola from V. pirina, which were previously considered to be identical, into distinct evolutionary lineages, indicating the power of multigene phylogenetic analysis.
In this study, we examined the 55 V. nashicola isolates collected from 13 major pear cultivation areas in Korea to elucidate genetic differences among the isolates. Alignment of combined ITS-5.8S to ITS2 region, TUB2 and TEF-1α sequences revealed that 1129 bp out of 1137 bp were conserved between the 55 V. nashicola isolates and five standard isolates analyzed. These sequence data suggest that little overall genetic difference among the V. nashicola isolates, despite geographical distance between isolates and a temporal separation of over 30 years between the standard isolates and those isolates collected in this study.
Although there was only little sequence variation among the isolates, we have identified three amino acid substitutions in analysis of the TUB2 sequence at the 198th codon: GCG (A, alanine), GAG (E, glutamate), and AAG (K, lysine) (). Moreover, all the 55 Korean V. nashicola isolates that were collected in this study code for an alanine at the 198th codon of TUB2. In a previous study, Kwak et al. (2017) reported that mutation of E198A may indicate whether the isolates are resistant to benzimidazole fungicides [Citation26]. It is already known that benzimidazole fungicides bind to fungal TUB2 and inhibit microtubule formation [Citation30,Citation31]. Considering our results, most of V. nashicola isolates from the 13 major pear cultivation areas in Korea are likely to be resistant to benzimidazole fungicides.
Unlike almost identical sequences obtained from sequencing the ITS region, TUB2, and TEF-1α genes, RAPD results showed high variation of band patterns. However, because bootstrap values did not support the clusters, all the isolates may be clonal. This result suggests low genetic diversity in the populations of V. nashicola in Korea. The reasons behind the low genetic diversification in the V. nashicola population are thought to be as follows: (1) a single pear cultivar, “Niitaka”, constitutes 83% of all pears grown in Korea, (2) most of the V. nashicola isolates used in the analysis were collected from “Niitaka” trees, (3) a few commercial nurseries limited to specific regions distribute pear seedlings nationwide, (4) the main pear production areas have been growing pear for over 60 years.
Through continuous monitoring of V. nashicola populations from diverse pear cultivars in different geographic areas, it is expected that a more precise analysis of diversity and detection of race differentiation events would be possible. This would in turn assist development of resistant cultivars and establishment of effective control strategies against pear scab in the future.
Supplemental Material
Download Zip (3.3 MB)Disclosure statement
No potential conflict of interest was reported by the authors. It has not been published elsewhere and it has not been submitted simultaneously for publication elsewhere.
Additional information
Funding
Related Research Data
References
- Kim KH, Hyun IH, Hong SK, et al. List of plant disease in Korea, 5th ed. Suwon: The Korean Society of Plant Pathology; 2009.
- Ishii H, Yanase H. Venturia nashicola, the causal fungus of Japanese and Chinese pears: a species distinct from V. pirina. Mycol Res. 2000;104:755–759.
- Kim KC. Theory of diagnosis and control of pear disease. Kwangju: Jun Deign; 2009.
- Koh HS, Sohn SH, Lee YS, et al. Specific and sensitive detection of Venturia nashicola, the scab fungus of Asian pears, by nested PCR. Plant Pathol J. 2013;29:357–363.
- Um JY. Diagnosis and control of apple and pear disease. Anyang: Gyeongbuk Print Co.; 1997.
- Shin IS, Hyeon IH, Hwang HS, et al. Screening of scab (Venturia nashicola) resistance germplasms in Pyrus species. Kor J Hort Sci Technol. 2004;22:63–68.
- Yoon D-H, Park H-J, Nam K-W. Control effect of environmental-friendly organic materials against major pear diseases. Kor J Pesticide Sci. 2010;14:401–406.
- Tanaka S, Yamamoto S. Studies on pear scab II. Taxonomy of the causal fungus of Japanese pear scab. Jpn J Phytopathol. 1964;29:128–136.
- Shabi E. Pear scab. In: Jones AL, Aldwinckle HS, editors. St. Paul (MN): APS Press; 1990.
- Le Cam B, Parisi L, Arene L. Evidence of two formae speciales in Venturia inaequalis, responsible for apple and pyracantha scab. Phytopathology. 2002;92:314–320.
- Schnabel G, Schnabel EL, Jones AL. Characterization of ribosomal DNA from Venturia inaequalis and its phylogenetic relationship to rDNA from other tree-fruit Venturia species. Phytopathology. 1999;89:100–108.
- Zhao P, Kakishima M, Uzuhashi S, et al. Multigene phylogenetic analysis of inter- and intraspecific relationship in Venturia nashicola and V. pirina. Eur J Plant Pathol. 2012;132:245–258.
- Sivanesan A. The taxonomy and pathology of Venturia species. Vaduz: J. Cramer; 1977.
- Beck A, Ritschel A, Schubert K, et al. Phylogenetic relationships of the anamorphic genus Fusicladium s. lat. as inferred by ITS nrDNA data. Mycol Progr. 2005;4:111–116.
- Zhao P, Yamada A, Kakishima M, et al. In planta expression profile and sequence variation of the endopolygalacturonase gene in Venturia nashicola, the causal agent of Asian pear scab. Trop Plant Pathol. 2016;41:67–77.
- White TJ, Bruns T, Lee S, et al. Amplification and direct sequencing of fungal ribosomal RNA genes for phylogenetics. In PCR protocols: a guide to methods and applications, Innis MA, Gelfand DH, Sninsky JJ, White TJ, editors. New York (NY): Academic Press; 1990.
- James TY, Kauff F, Schoch CL, et al. Reconstructing the early evolution of Fungi using a six-gene phylogeny. Nature. 2006;443:818–822.
- Amoah BK, Macdonald MV, Rezanoor N, et al. The use of random amplified polymorphic DNA technique to identify mating groups in the Fusarium section Liseola. Plant Pathol. 1996;45:115–125.
- Foster LM, Kozak KR, Loftus MG, et al. The polymerase chain reaction and its application to filamentous fungi. Mycol Res. 1993;97:769–781.
- Guthie PAI, Magill CW, Fredericksen RA, et al. Random amplified polymorphic DNA marker: a system for identifying and differentiating isolates of Colletotrichum graminicola. Phytopathology. 1992;82:832–835.
- Nicholson P, Rezanoor HN. The use of random amplified polymorphic DNA to identify pathotype and detect variation in Pseudocercosporella herpotrichoides. Mycol Res. 1994;98:13–21.
- Park S-Y, Seo J-H, Lee Y-W, et al. Population genetic analyses of Gibberella fujikuroi isolates from maize in Korea. Plant Pathol J. 2001;17:281–289.
- Kim YK, Kang SS, Won KH, et al. Breeding of the scab-resistance pear cultivar ‘Greensis’. Kor J Hort Sci Technol. 2016;34:655–661.
- Won KH, Kang SS, Kim YK, et al. Evaluation of scab resistance and effect of photosynthetic rates on fruit characteristics among elite pear seedlings. Kor J Environ Agric. 2013;32:117–122.
- Choi ED, Kim GH, Lee YS, et al. Development of carrot medium suitable for conidia production of Venturia nashicola. Plant Pathol J. 2017;33:75–79.
- Kwak YS, Min JY, Song JH, et al. Relationship of resistance to benzimidazole fungicides with mutation of β–tubulin gene in Venturia nachicola. Res Plant Dis. 2017;23:105–158.
- Kumar S, Stecher G, Tamura K. MEGA7: molecular evolutionary genetics analysis version 7.0 for bigger datasets. Mol Biol Evol. 2016;33:1870–1874.
- Yap IV, Nelson RJ. Winboot: a program for performing bootstrap analysis of binary data to determine the confidence limits of UPGMA-based dendrograms. Int Rice Res Instit. Discussion Paper Series. 1996;14.
- Choi J, Kim SH. A genome tree of life for the fungi kingdom. Proc Natl Acad Sci U S A. 2017;114:9391–9396.
- Davidse LC, Flach W. Differential binding of methyl benzimidazol-2-yl carbamate to fungal tubulin as a mechanism of resistance to this antimitotic agent in mutant strains of Aspergillus nidulans. J Cell Biol. 1977;72:174–193.
- Martin RJ. Modes of action of anthelmintic drugs. Vet J. 1997;154:11–34.