
 ?Mathematical formulae have been encoded as MathML and are displayed in this HTML version using MathJax in order to improve their display. Uncheck the box to turn MathJax off. This feature requires Javascript. Click on a formula to zoom.
Abstract
Identification of agronomic traits tightly linked to molecular markers is a major footstep to implement the marker assisted selection in breeding programmes. Sugarcane is the major cash crop and the source of more than 2/3 of world sugar production. In this study, 20 simple sequence repeat (SSR) markers were used to find the linkage for sugarcane yield components; cane weight and tillers per plant using 28 sugarcane genotypes. In total, 114 alleles were found, ranging from 2--13 alleles per locus with a mean value of 5.7. High levels of polymorphism were detected through SSR amplifications among all genotypes studied. SSR markers, CEMB-14A and CEMB-14B, were found linked (P < 0.01) to tillers per plant while CEMB-5A, CEMB-5C and CEMB-7B were found associated (P < 0.05) with cane weight. Identification of new and novel SSR markers in sugarcane have potential use in genetic diversity studies, DNA fingerprinting, DNA markers-based screening of germplasm for breeding programme and also in determination of true hybrids in the offspring.
Introduction
Sugarcane, being a major cash crop worldwide, is the main source of sugar; almost 50% of the world's sugar requirement is fulfilled by sugarcane. Tropical regions are suitable for the cultivation of sugarcane. In Pakistan, sugarcane production is stagnant between 40--50 tons/ha, which is very low as compared to other countries in the world. Sixty metric tons/ha is considered an average yield in the world, while in India and Egypt, sugarcane production is 66 and 105 ton/ha, respectively (http://www.finance.gov.pk). To improve the production or yield per unit area in Pakistan, certain reforms are needed. Major improvements regarding yield are the use of quality seeds; and control of the pests and diseases. For a good yield, plants with different number of stalk or the advancement of secondary shoots, i.e. tillering is considered to be beneficial. Similarly for weed control, tillering is considered to enhance the rate of canopy closure. Definite number of tillers must be present at the time of harvest and each variety has different tillering potential. In sugarcane field, initially shoots are profused and rate of mortality is increased with passage of time as rows are closed. Due to light competition, mortality rate may reach more than 50% of the initial stalks.[Citation1]
Efforts are being made to extend the sugarcane yield through improvement of different traits like stalk length, stalk girth, sugar content and cane yield. Conventional breeding of sugarcane has been one of the major sources for yield improving. Modern sugarcane cultivars are the hybrids of Saccharum officinarum and Saccharum spontaneum. Appropriate flowering of the parental lines is the pre-requisite for the breeding and sugarcane flowering varies among different climatic zones. It is possible that some selected genotypes may not flower for the whole year. In other words, breeding programmes for sugarcane are time consuming and work at a hit and miss principle.[Citation2] While moving towards the sugarcane sequencing, new challenges are confronted like polyploid and aneuploid structure and it is also presumed that there are 10–12 copies (alleles) of complete homologous genes.[Citation3]
Association mapping has made remarkable attention to recognize genes responsible for different traits with agricultural and evolutionary significance. Recent advancement in genomic technology allows taking the advantages of natural diversity and when coupled with the new decisive statistical analysis methods, association mapping has become a tempting and an affordable research programme.[Citation4] Molecular markers are found by gene mapping. Quantitative traits are governed by different genes and the location of those genes is linked by the molecular markers.[Citation5] Most recently, microsatellite or simple sequence repeat (SSR) markers are being preferred having wide genomic distribution, co-dominant inheritance, multi-allelic nature, chromosome specific location and reproducibility. These markers are acquiescent to get high throughput genotyping due to multiplexing and efficient resolution of amplicons by automated fragment analysis.[Citation6,Citation7]
In this study, 20 SSR markers were used to determine the marker trait linkage in sugarcane (Saccharum spp.). The main focus was to find those regions or loci which are associated with yield parameters; cane weight and tillers per plant.
Material and methods
Plant material and SSR markers
Twenty eight genotypes of sugarcane (Saccharum spp.) were collected from Ayub Agricultural Research Institute Faisalabad, Pakistan () and sown in the CEMB field during 2010. Fresh and young leaves were taken for genomic DNA isolation.
Twenty SSR primer sequences () were selected to amplify polymorphic loci among sugarcane genotypes. These primers were named as CEMB1 for primer 1 and etc. The purpose for selecting these primers was to verify that they have the same potential for linkage mapping for yield and tillers per plant as these were previously used in the genetic studies for evaluation of evolutionary distances and transferability of SSR markers.[Citation7]
Table 1. Information about SSR primers used in the study. Number of amplified alleles observed against each primer pair.
Genomic DNA isolation and PCR amplification
Total genomic DNA from 28 sugarcane genotypes was isolated by CTAB DNA extraction protocol.[Citation8] For amplification, reaction mixture comprised of 1X PCR (polymerase chain reaction) buffer, 0.1 mmol/L of deoxyribonucleoside triphosphates (dNTPs), 1 pmole each of forward and reverse SSR primer. 1 unit of Taq DNA polymerase (Fermentas) and 50 ng of template DNA were used. PCR reaction was carried out in a thermal cycler (GeneAmp PCR system 9700, ABI) with the following thermal cycling parameters: initial denaturation at 95 °C for 4 min followed by 30 cycles of 94 °C for 30 seconds, 57 °C for 30 seconds and 72 °C for 45 seconds and a final extension of 10 min at 72 °C. Amplified products were resolved on 9% polyacrylamide gel (PAGE) followed by silver staining. Polymorphic bands were observed and documented.
Field evaluation of the plant material
Field experiment for 28 selected sugarcane genotypes was conducted. These 28 sets were sown in the field area of CEMB, Lahore on 7 February 2010 in three replications using randomized complete block design (RCBD). In each replication, two sets of each genotype were sown in plot size of 6 ft2 and hence total area for study was 1800 ft2. Complete crop husbandry practices like fertilizer, irrigation, earthing-up, hoeing and pest management were followed for growing normal crop. Number of tillers per plant was counted after 15 days of emergence while at the time of maturity at the mid of December 2010, data of average cane weight were recorded. For cane weight data, top green portion was separated and millable portion was weighed in kilogram on conventional balance.
Data for number of tillers/plant, average cane weight was analysed using specific statistical software ‘Statistix 9.0’. Analysis of variance was performed while least significant difference (LSD) test was used for ranking of all 28 genotypes with respect to average tillers/plant and average cane weight. Yield (cane weight/plant) in kg can be converted into tons per hectare from the following formula. Y = cane weight × no. of plants per unit area.
where, P × P = plant to plant distance, R × R = row to row distance, e.g., for Ha, no. of plants = 107,593.2 ft2/3 ft2 = 35,864.
Structure analysis
The program STRUCTURE was applied to identify sub-populations in the plant material using genotype data consisting of unlinked markers by implementation of model-based clustering method. Applied method includes indication of the presence of population structure, identification of distinct genetic populations, assignment of individuals to populations along with identification of migrants and admixed individuals. In the proposed model, there were ’K’ (unknown) sub-populations each of which was characterized by a set of allele frequencies at each locus. Individuals were assigned to sub-populations, or jointly to two or more sub-populations depending on their genotypes if admixed. It is assumed that the loci were at linkage equilibrium and Hardy--Weinberg equilibrium within sub-populations. Individuals were assigned to sub-populations in a way to achieve this equilibrium. The presented model can be applied to the most commonly used genetic markers including microsatellites, SNPs and RFLPs without assuming a particular mutation process.[Citation9]
Assessment of marker--trait associations
It is becoming more important to map the natural diversity of the genome at high resolution by association analysis, although, confounding effects of both population and structure must be resolved. ‘TASSEL’ version 2.1 was used to analyse marker–trait associations. TASSEL (Trait Analysis by aSSociation, Evolution and Linkage) implements general linear model (GLM) and mixed linear model (MLM) approaches for scheming population and family structure. Linkage disequilibrium (LD) statistics was calculated and visualized graphically by the TASSEL. Database browsing and data importation was assisted by integrated middleware. Analysing insertions/deletions, calculating diversity statistics, integration of phenotypic and genotypic data, imputing missing data and calculating principal components are major features of the TASSEL.[Citation10]
Results and discussion
In this work, 20 SSR primer pairs were designed to detect polymorphisms across the set of 28 sugarcane genotypes.
SSR analysis
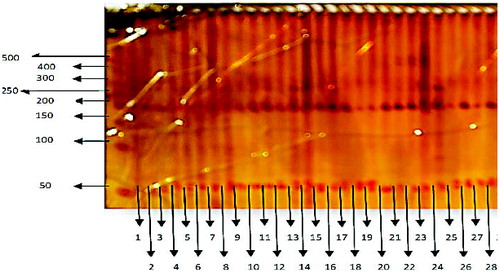
Various degree of polymorphism was observed among all sugarcane genotypes with SSR markers. Amplified product sizes ranged between 50 and 500 bp (). The number of observed alleles for each SSR marker is from 2 to 13. The highest level of polymorphism was observed with SSR primer CEMB-4 which amplified a total of 13 alleles in the sugarcane genotypes. Similarly, SSR markers CEMB-1, CEMB-2, CEMB-6 and CEMB-15 resulted in 9, 8, 8 and 8 alleles, respectively ().
Figure 1. PAGE results showing polymorphism. Lane 0: DNA molecular weight marker (50 bp DNA ladder); Lanes 1-28: polymorphic bands in sugarcane genotypes included in this study (see ).
Conclusively, EST-SSR (expressed sequence tags-simple sequence repeats) amplifications revealed high level of polymorphism and detected five alleles in the SSR loci: CEMB-14A, CEMB-14B, CEMB-5A, CEMB-5C and CEMB-7B. Molecular markers RAPD (random amplified polymorphic DNA) and AFLP (amplified fragment length polymorphism) have been used as fingerprinting techniques over the past years to map genetic differentiation and intra-specific variation in many organisms,[Citation11–14] but their specificity was low regarding identification of specific clones.[Citation15] SSR markers, however, are highly reproducible,[Citation16] polymorphic in nature and locus specific.[Citation17,Citation18]
Field evaluation of plant material
Morphological data was collected for 28 genotypes of sugarcane. Data were collected for yield and tillers per plant during the year 2010.
Yield (cane weight/plant)
Yield in cane weight per kilogram is a parameter which was also analysed during this study and CEMB-5A, CEMB-5C and CEMB-7B markers were found linked (P < 0.05) to this trait. Field performance data regarding tillers per plant and cane weight of 28 different sugarcane genotypes were recorded. For yield (cane weight per plant), analysis of variance was applied which depicted highly significant variation among all the 28 genotypes for cane weight per plant. Maximum cane weight was recorded in S2006 SP25 with the value of 3.78 kg, whereas S2006-SP18 genotype got the bottom position regarding cane weight per plant (1.76 kg). Although genotype S2006-SP321 remained second for cane weight per plant (3.69 kg), its yield was statistically equal to that of S2006 SP25 (3.78 kg) ().
Table 2. Sugarcane (Saccharum spp.) genotypes were used in this study. In total, 28 different genotypes were employed to study SSR marker association with quantitative traits of sugarcane genotypes. Mean and LSD ranking of all sugarcane genotypes for average cane weight/plant and tillers/plant in sugarcane. Mean showing different letters will be regarded as significant at P < 0.05.
According to the data for cane weight per plant obtained, each sugarcane genotype had a unique LSD rank as depicted in . Highest ranking position was acquired by the S2006 SP 25 and S2006 SP 321 genotype of sugarcane while the least position was occupied by S2003 US127 genotype of sugarcane. Mean showing different letters was found significant at P < 0.05. Stalk weight is considered as the potential interpreter in several studies.[Citation19] In sugarcane, yield is dependent on a number of factors including morphological traits in which tillers per plant, stalk length and diameter are considered important. Quantitative trait loci (QTLs) have been detected for basic sucrose content and yield contributing traits, namely sucrose content, fibre per cent, cane yield and sugar yield.[Citation20–22] SSR markers are so much useful for identification of loci which are linked to the yield. In this study, three different loci were found linked to yield. These markers will be useful in future breeding programmes to develop elite disease tolerant sugarcane varieties.
Tillers per plant
In sugarcane, cane yield is associated with the most important varietal trait, tillering which depends on the proportion of the chromosomes of the wild species, S. spontaneum, in typical segregating breeding populations, so various breeding populations show variable tillering capacity. About 50%–60% tiller mortality in sugarcane is considered to be acceptable.[Citation23] Plant breeders usually select plants in the field based on vigour, stalk length, stalk diameter, number of tillers and other morphological traits. Identification of QTLs associated with tillers per plant is a first step in implementing marker-assisted selection in sugarcane breeding programme.[Citation6,Citation24]
Mean squares from the analysis of variance presented in showed highly significant differences for tillers per plant at P < 0.01, indicating that all the genotypes performed variable response for this trait. After performing analysis of variance, LSD test was used for ranking of genotypes. It was found that S2006 US640 genotype showed highest tillers per plant with the value of 3.6 followed by genotype S2006 US832 and S2006 SP321, while least number of tillers per plant was found in genotype S2003 US778 with the value of 1.88 followed by genotype SPF245 and CP-72-2086 ().
Table 3. At left, analysis of variance among 28 sugarcane genotypes for cane weight/plant depicting F value and significance at 0.01% probability. (SOV = source of variation, d.f. = degree of freedom, SS = sum of square, MS = mean squares, F. Cal = Fisher's calculated value). At right, analysis of variance of 28 sugarcane genotypes for tillers/plant. Data were found highly significant at P < 0.01.
Analysis of marker--trait association
Outcome value of Q matrix was five subgroups based on Evanno et al. [Citation9]. The results of STRUCTURE analysis were taken and TASSEL software was used to assess the marker trait associations. Two SSR markers; CEMB-14A and CEMB-14B were found associated statistically with yield parameter tillers per plant. Their respective possibility is 0.007, which showed that phenotypic variance explained value was 100% ().
Table 4. Marker--trait association analysed by TASSEL software.
Similarly, CEMB-5A, CEMB-5C and CEMB-7B SSR markers were significantly associated with cane weight per plant trait. Their respective possibility values were 0.0275, 0.0371 and 0.0136. Phenotypic variance explained value was almost 100%.
The identified loci can be further used for the breeding efforts in future. Furthermore, P-value for the tillers per plant was determined as 0.007 and 0.007, respectively, which is the same for both loci with phenotypic variance of 100%. Identification of corresponding QTLs for tiller number suggests that these loci may be especially promising targets for marker-assisted selection strategies in sugarcane. Ming and co-workers [Citation25,Citation26] reported first QTLs for sugar yield and related traits in sugarcane by using segregating populations derived from two interspecific crosses.
Sugarcane production and productivity depend on various biotic and abiotic factors, which are varied in tropical to subtropical regions. Virus-based mosaic disease is also included in these threats in sugarcane industry. 50% infection level indicates significant loss in yield.[Citation27,Citation28] 10%–32% decline in cane yield and 6%–10% in sugar yield have been recorded due to the mosaic infection.[Citation29] The average yield of sugarcane in the world is around 60 metric tons/ha.[Citation30] Tiller per plant in sugarcane also plays an important role in terms of yield and particularly those genotypes having moderate tillers are considered to increase the yield. Therefore, all these and other environmental factors affect the yield. Continuous breeding efforts and production of disease resistant and high yielding cultivars are needed.
Conclusion
In this study, novel QTLs associated with tillers/plant and cane weight of sugarcane were identified. These identified QTLs can be employed for the genetic diversity studies and screening sugarcane germplasm with respect to tillers/plant and cane weight. They can also be used for marker-assisted selection in breeding programmes to develop elite sugarcane cultivars with greater potential for tillers/plant and cane weight in sugarcane.
Acknowledgements
The authors would like to thank Dr. Qurban Ali (Centre of Excellence in Molecular Biology, University of the Punjab) for his valuable comments and suggestions regarding the statistical analysis.
Disclosure statement
No potential conflict of interest was reported by the authors.
References
- Miller JD, Gilbert RA, Odero DC. Sugarcane botany: a brief review. University of Florida; 2010; SS-AGR-234.
- Swapna M, Srivastava S. Molecular marker applications for improving sugar content in sugarcane. SpringerBriefs in Plant Sci. 2012;1–49. doi: 07/978-1-4614-2257-0_1
- Dal-Bianco M, Carneiro MS, Hotta CT, Chapola RG, Hoffmann HP, Garcia AAF, Souza GM. Sugarcane improvement: how far can we go? Curr Opin Biotechnol. 2012;23:265–270.
- Zhu C, Gore M, Buckler ES, Yu J. Status and prospects of association mapping in plants. Plant Genome. 2008;1:5–20.
- Mackay IJ, Powell W. The significance and relevance of linkage disequilibrium and association mapping in crops. Trends Plant Sci. 2007;12:57–63.
- Cordeiro GM, Taylor GO, Henry RJ. Characterization of microsatellite markers from sugarcane (Saccharum sp.), a highly polyploid species. Plant Sci. 2000;155:161–168.
- Cordeiro GM, Casu R, McIntyre CL, Manners JM, Henry RJ. Microsatellite markers from sugarcane (Saccharum spp.) ESTs cross-transferable to Erianthus and Sorghum. Plant Sci. 2001;160:1115–1123.
- Allen GC, Flores-Vergara MA, Krasynanski S, Kumar S, Thompson WF. A modified protocol for rapid DNA isolation from plant tissues using cetyltrimethyl ammonium bromide. Nat Protocol. 2006;1:2320–2325.
- Evanno G, Regnaut S, Goudet J. Detecting the number of clusters of individuals using the software STRUCTURE: a simulation study. Mol Ecol. 2005;14:2611–2620.
- Bradbury PJ, Zhang Z, Dallas E, Terry K, Casstevens M, Ramdo Y, Edward SB. TASSEL: software for association mapping of complex traits in diverse samples. Bioinformatics. 2007;23:2633–2635.
- Selvi A, Nair NV, Noyer JL, Singh NK, Balasundaram N, Bansal KC, Koundal KR, Mohapatra T. Genomic constitution and genetic relationship among the tropical and subtropical Indian sugarcane cultivars revealed by AFLP. Crop Sci. 2005;45:1750–1757.
- Lan R, Reeves PR. 2007. Amplified fragment length polymorphism analysis of Salmonella enterica. Methods Mol Biol. 2007;394:119–32.
- Fry NK, Savelkoul PH, Visca P. Amplified fragment-length polymorphism analysis. Methods Mol Biol. 2009;551:89–104.
- Kumar A, Misra P, Dube A. Amplified fragment length polymorphism: an adept technique for genome mapping, genetic differentiation, and intraspecific variation in protozoan parasites. Parasitol Res. 2013;112(2):457–466.
- Zhang D, Mischke S, Goenaga R, Hemeida AA. Accuracy and reliability of high-throughput microsatellite genotyping for Cacao clone identification. Crop Sci. 2006;46:2084–2092.
- Park JH, Suresh S, Piao XM, Cho GT, Lee SY, Baek HJ, Lee CW, Chung JW. Application of simple sequence repeat (SSR) markers for the discrimination of Korean and Chinese sesame (Sesamum indicum L.) accessions. Plant Breed Biotechnol. 2014;2:80–87.
- Glynn NC, Mccorkle K, Comstock JC. Diversity among mainland USA sugarcane cultivars examined by SSR genotyping. Am Soc Sugar Cane Technologists. 2009;29:36–52.
- Liu C, Fan X, Jiang J, Guo D, Sun H, Zhang Y, Feng J. Genetic diversity of chinese wild grape species by SSR and SRAP markers. Biotechnol Biotechnological Equipment. 2012;26(2):2899–2903.
- Hoarau JY, Grivet L, Offmann B, Raboin LM, Diorflar JP, Payet J, Hellmann M, D'Hont A, Glaszmann JC. Genetic dissection of a modern sugarcane cultivar (Saccharum spp.). II. Detection of QTLs for yield components. Theor Appl Genet. 2002;105(6–7):1027–1037.
- Da Silva JA, Bressiani JA. Sucrose synthase molecular marker associated with sugar content in elite sugarcane progeny. Genet Mol Bio. 2005;28:294–298.
- Pinto LR, Garcia AAF, Pastina MM, Teixeira LHM, Bressiani JA, Ulian EC, Bidoia MAP, Souza AP. Analysis of genomic and functional RFLP derived markers associated with sucrose content, fiber and yield QTLs a in sugarcane (Saccharum spp.) commercial cross. Euphytica. 2010;172:313–327.
- Pastina MM, Malosetti M, Gazaffi R, Mollinari M, Margarido GRA, Oliveira KM, Pinto LR, Souza AP, van Eeuwijk FA, Garcia AAF. A mixed model QTL analysis for sugarcane multiple-harvest-location trial data. Theor Appl Genet. 2012;124:835–849.
- Kapoor R, Duttamajumder SK, Rao KK. A breeder's perspective on the tiller dynamics in sugarcane. Curr Sci. 2011;100:2–25.
- Hameed U, Pan YB, Muhammad K, Afghan S, Iqbal J. Use of simple sequence repeat markers for DNA fingerprinting and diversity analysis of sugarcane (Saccharum spp.) cultivars resistant and susceptible to red rot. Genet Mol Res. 2012;11(2):1195–1204.
- Ming R, Liu SC, Moore PH, Irvine JE, Paterson AH. QTL analysis in a complex autopolyploid: genetic control of sugar content in sugarcane. Genomic Res. 2001;11:2075–2084.
- Ming R, Wang YW, Draye X, Moore PH, Irvine JE, Paterson AH. Molecular dissection of complex traits in autopolyploids: mapping QTLs affecting sugar yield and related traits in sugarcane. Theor Appl Genet. 2002;105:332–345.
- Husnain Z, Afghan S. Screening of sugarcane diseases. Annual Progress Report. Jhang: Shakarganj Sugar Research Institute; 2004.
- Jahangir GZ, Nasir IA, Iqbal M. Disease free and rapid mass production of sugarcane cultivars. Advanced Life Sci. 2014;1(3):1–8.
- Haider MS, Afghan S, Riaz H, Tahir M, Javed MA, Rashid N, Iqbal J. Identification of two sugarcane mosaic virus (SCMV) variants from naturally infected sugarcane crop in Pakistan. Pakistan J Bot. 2011;43(2):1157–1162.
- Shahid Z, Ahmad A, Javed MR. Integrated application of fertilizers and biocane (organic fertilizers) to enhance the productivity and juice quality of autumn planted sugarcane (Saccharum officinarum L.). Afr J Agric Res. 2011;6(21):4857–4861.