
Abstract
In the present study, the genetic diversity analysis of Tilia tomentosa plants was performed by using random amplified polymorphic DNA (RAPD) primers. Twenty eight plant samples, collected from urban (25 members) and forest (3 members) ecosystems, were used in this study. A total of 53 bands were obtained from eight RAPD primers, of which 48 (90.6%) were polymorphic. The percentage of polymorphic loci (P) was found to be 94.29%, the observed number of alleles (Na) was 1.94, the effective number of alleles (Ne) was 1.60, Nei's gene diversity (h) was 0.34 and Shannon's information index (I) was 0.50. Unweighted pair group method with arithmetic mean (UPGMA) cluster analysis revealed two major groups. Members of the urban and forest ecosystems showed high genetic similarity (28%–92%) and they did not separate from each other in UPGMA tree. Furthermore, urban and forest genotypes clustered together in principal component analysis.
Introduction
Lime tree (Tilia spp.), which is a member of Malvaceae family, is a long-lived tree that can live up to 500 years. They can grow in loamy sites, but can also be found on sandy and infertile soils.[Citation1,Citation2] Tilia species are found in the forests of the northern hemisphere in Europe, Asia, Central and Eastern North America.[Citation3] Naturally, four Tilia species are found in Europe: Caucasian lime –Tilia dasystyla (Stev.), silver lime –Tilia tomentosa (Moench.), small-leaved lime –Tilia cordata (Mill.) and large-leaved lime –Tilia platyphyllos (Scop.).[Citation4] T. tomentosa and T. dasystyla are distributed in south-eastern Europe and around the Black Sea regions.[Citation2]
Deciduous trees are widely used as ornamentals in municipal parks and avenues of large cities.[Citation5] Climatic conditions and human impact have affected the distribution of Tilia species in Europe in the past 2000 years. Farming and low seed fertility are the primary reasons for the decline of Tilia species in Europe.[Citation2] Up to now, Tilia species have been used in various genetic studies, which include random amplified polymorphic DNA (RAPD) markers,[Citation6,Citation7] simple sequence repeats markers,[Citation8] chloroplast DNA markers,[Citation9] isozyme markers [Citation10,Citation11] and internal transcribed spacer sequences.[Citation12] The assessment of the genetic diversity is a key factor for establishing a long-term conservation in their natural habitat.[Citation13] RAPD technique is one of the efficient methods for determining genetic similarities and inter- and intra-species relationship degrees.[Citation6,Citation14] In this study, selected T. tomentosa genotypes (individuals) from different regions of the urban ecosystem in Duzce city, Turkey, were evaluated by using RAPD markers to understand the genetic variation level of T. tomentosa living in urban areas.
Materials and methods
Study area and plant materials
Duzce is located on the west of the Black Sea region (N 40° 50′ 30″, E 31° 09′ 30″) on the north-western part of Turkey and it covers 3.641 km2 land area (). The area is affected by the Black Sea climatic conditions with hot summers and cold and humid winters, thus mostly humid forest vegetation covers the area.[Citation15] The average annual temperature is 13 °C, the average annual rainfall is 825 mm and the average relative humidity is 75%.[Citation16]
Figure 1. The geographic location of T. tomentosa samples.
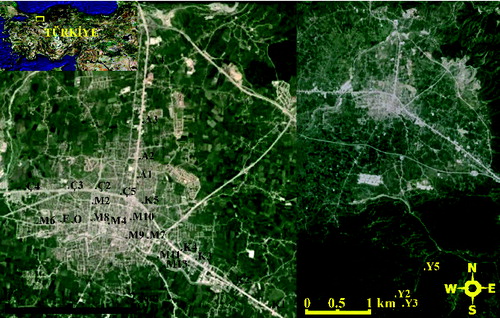
The leaf samples were collected from 28 different individuals of T. tomentosa in Duzce (). Twenty five of the collected samples were from the city centre (indicated as A1, A2, A3, A4, M2, M4, M6, M7, M8, M9, M10, M11, M12, M13, K1, K2, K3, K4, K5, F, Ç2, Ç3, Ç4, Ç5 and O) and three of them were from the forest (indicated as Y2, Y3 and Y5) as out-group samples. The collected leaves were stored at −80 °C until the DNA extraction process.
DNA isolation and RAPD reactions
Total genomic DNA was isolated from the frozen leaf material by using GeneJET Genomic DNA Purification Kit (Thermo Scientific, USA). The DNA concentration of each sample was determined by using BioSpec-nano (Shimadzu, Japan) and the elutions were diluted with sterile distilled water to a final concentration of 50 ng μL−1. As a preliminary study, 25 RAPD primers (Operon Technologies Inc.) were tested and eight of them were selected for polymerase chain reaction (PCR) ().
Table 1. List of the used primers for the RAPD-PCR reactions.
RAPD reactions were performed in a final volume of 25 μL, including 2.5 mmol L−1 MgCl2, 0.2 mmol L−1 dNTPs, 0.5 μmol L−1 primers, 1 U Taq DNA polymerase (Thermo Sci, USA), 2.5 μL 10 × Taq DNA polymerase buffer (pH 8.3) and 50 ng template DNA. The amplification was performed in a programmed thermo cycler (Thermo Scientific, USA) with initial denaturation at 94 °C for 3 min, 35 cycles of denaturation at 94 °C for 1 min, primer annealing at 36 °C for 1 min, extension at 72 °C for 1 min and a final extension at 72 °C for 10 min. The amplification products were separated by electrophoresis in a 1% agarose gel with 1 × Tris-borate-Ethylenediaminetetraacetic acid (EDTA) (TBE) –Life Technologies buffer and digitally photographed under UV light. The used marker was a 100-bp DNA ladder (Thermo Sci, USA).
Data analysis
The RAPD bands were scored as present (1) or absent (0). A matrix of similarities between every pair of individuals was obtained by using the Jaccard similarity index.[Citation17] The data were analysed using Popgene version 1.31 [Citation18] and MVSP 3.2 (multi-variate statistical package). The percentage of polymorphic loci (P), mean number of observed (Na) alleles and effective (Ne) alleles per locus,[Citation19] Nei's gene diversity (h) [Citation20] and Shannon's information index (I) [Citation21] were calculated as genetic parameters. A principal component analysis (PCA) test, which is providing a graphical representation of the RAPD relationship between individuals, was demonstrated with the variance-covariance matrix calculated from marker data using MVSP 3.2 program. A dendrogram was generated based on Jaccard's similarity coefficients [Citation17] using the unweight pair group method with calculating the arithmetic average (UPGMA) by MVSP 3.2.
Results and discussion
A total of 25 RAPD primers were tested and eight of them produced suitable and reproducible banding patterns. We obtained 53 fragments that could be scored (). Out of the 53 fragments, 48 were polymorphic with an average of 6 polymorphic fragments per primer. The highest number of polymorphic bands (7) was obtained with primer R12 and R18, whereas the lowest number of bands (5) was obtained with primers R8 and R17. An example for RAPD banding patterns is given for primer R17 in . The percentage of P was found to be 94.29%. Also, the observed number of alleles (Na), effective number of alleles (Ne), Nei's gene diversity (h) and Shannon's information index (I) were found to be 1.94, 1.60, 0.34 and 0.50, respectively.
Figure 2. RAPD patterns of 28 Tilia genotypes with primer R17.

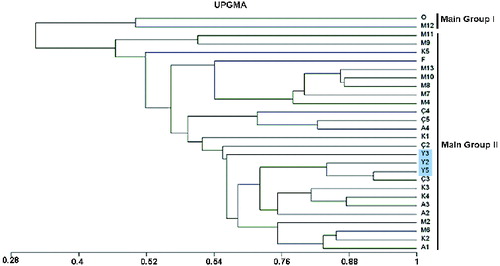
Based on UPGMA analysis, two major groups were observed: O and M12 were clustered together in the first major group, whereas the other 26 genotypes were grouped together in major group two (). The forest genotypes (Y2, Y3 and Y5, indicated in blue colour) were clustered together with the urban genotypes in the second major group. Notably, the highest similarity value was found to be between forest genotype Y5 and urban genotype Ç3 with 92.3%, followed by Y2–Ç3 with 84% and Y3–K4 with 75%. In addition, the lowest similarity value was found to be between forest genotype Y3 and urban genotype M11 with 28%, followed by Y2–M11 with 32% and Y5–M11 with 37%. In the urban genotypes, the highest similarity was found to be 87.5% between A3–K4, followed by M8–M10 with 87% and M7–M10 with 86.7%, whereas the lowest value was 20% between M12–M13. The dendrogram was not in accordance with the geographic distributions of Tilia genotypes.
Figure 3. Dendrogram of the 28 T. tomentosa genotypes by using RAPDs data with UPGMA cluster analysis.
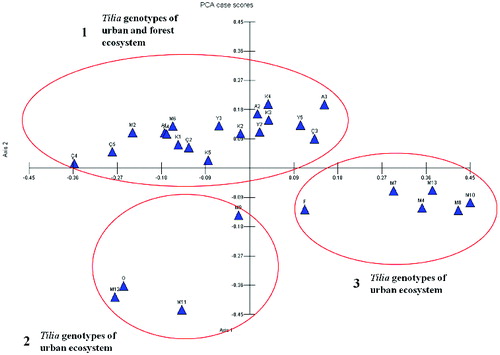
PCA was performed to visualize the genetic relationship between Tilia genotypes (). Wide range distribution profile with three subplots with forest and urban genotypes was obtained. Two subplots (2 and 3) comprised urban genotypes, whereas the other one (1) comprised both urban and forest genotypes. The members of subplots 2 and 3 were separated from the other genotypes.
Figure 4. Principal component analysis plot of the RAPDs data among 28 genotypes of T. tomentosa.
Biological diversity may be indicated at three levels, such as genetic diversity, species diversity and ecosystem diversity.[Citation22,Citation23] Urban biodiversity is altered by habitat fragmentation and loss, introduction of new species, urban climate change, soil type, hydrology and biogeochemical cycles.[Citation24,Citation25] Urban trees are fundamental structural components in the urban environment and are important factors for determining the ecological function of the urban forests.[Citation26–28] Genetic variations in plant populations are considered to be shaped by location and time.[Citation29] Long lifespan, phenotypic plasticity, gene flux among populations (pollen and seeds) support the resistance of trees.[Citation30] Up to date, the genetic studies realized with Tilia species have been limited.[Citation6,Citation7] Thus, in this study, the genetic variations of T. tomentosa genotypes were investigated by using RAPD markers in urban ecosystem.
In this study, polymorphic bands and the average population diversity were found to be 94.29% and 0.50, respectively in T. tomentosa by using eight different RAPD primers. In a similar study, conducted with T. rubra, populations from Hyrcanian forests of north of Iran, polymorphic bands and average population diversity were found to be 41.4% and 0.22, respectively, by using seven RAPD primers.[Citation7] Our values were two times higher than those of T. rubra. Ecogeographic factors and breeding systems can affect the genome structure of plants.[Citation22] Also, life history and ecological characteristics are important factors for shaping the genetic structures in woody plant species.[Citation31] These factors may affect the genetic variations of T. tomentosa in urban ecosystems. In another study, Tilia taxa, such as T. cordata, T. platyphyllos, T. dasystyla, T. euchlora, T. europaea, T. tomentosa, T. americana, included 36 genotypes, 403 polymorphic bands, obtained by using 17 RAPD primers and the mean number of bands per primer was about 23.7.[Citation6] These findings were higher than our results and it can be suggested that wide gene pool of different Tilia taxa may cause high polymorphism levels. There are some other studies, conducted with different woody plant species, which performed genetic diversity analysis by using RAPD markers, including Robinia pseudoacacia,[Citation32] Ginkgo biloba,[Citation33] Pinus halepensis,[Citation34] Pinus longaeva,[Citation35] Pinus oocarpa [Citation36] and Populus euphratica.[Citation37] In our study, the amount of RAPD variations observed in T. tomentosa (h = 0.34) was lower than that in G. biloba (h = 0.44) and P. oocarpa (h = 0.358), whereas it was higher than that in P. halepensis (h = 0.32 and 0.30), P. longaeva (h = 0.134) and P. euphratica (h = 0.124).[Citation32–37]
The UPGMA dendrogram revealed that urban and forest genotypes did not separate from each other () and Y5 (forest genotype) and Ç3 (urban genotype) showed the highest similarity rate –92.3%. The PCA confirmed the UPGMA tree data. The rates of asexual reproduction could result in the reduction of genotypic diversity and population differentiation, but, on the other hand, may increase heterozygosity. Furthermore, clonal propagation is also critical for the effects on heterozygosity and genetic structure.[Citation38–40] Vegetative reproduction is more common than generative reproduction in Tilia taxa. Nearly 77%–80% of the young trees in the south-west region of Russia and almost 100% in the north-east region of Europe were detected as a result of vegetative reproduction.[Citation41,Citation42]
Conclusions
The high similarity between urban and forest genotypes in UPGMA tree could be a result from the high rates of asexual reproduction in the life history of T. tomentosa and showed that similar genetic structures appear in genotypes of different ecosystems. This situation could also explain the origin of T. tomentosa individuals. The ones, collected from urban areas, could be generated by vegetative reproduction by using Tilia seedlings originated from forests. However, as a result of the fast urbanization and enlargement of the city through the forests, the city partly covered the forest and some individuals from the forest became placed in the urban ecosystems. Based on low similarity values among the urban genotypes, it can be suggested that sexual reproduction in Tilia genotypes may cause low genetic similarities among genotypes.
Disclosure statement
No potential conflict of interest was reported by the authors.
Additional information
Funding
References
- Angiosperm Phylogeny Group. An update of the angiosperm phylogeny group classification for the orders and families of flowering plants: APGII. Bot J Linn Soc. 2002;141:399–436.
- Jensen JS. EUFORGEN Technical guidelines for genetic conservation and use for lime (Tilia spp.). Italy: Taylor & Francis; 2003. [cited 2015 Feb 4]. Available from: http://www.euforgen.org/.
- Muir N. A survey of the genus Tilia. Plantsman. 1984;5:206–242.
- Mauer WD, Tabel U. A methodological study to improve the isozyme analysis for identification of clones of Tilia (Linden syn. lime tree). Silvae Genet. 1995;45:351–356.
- Sukopp H, Wurzel A. Changing climate and the effects on vegetation in central European cities. Arboric J. 2000;24:257–281.
- Liesebach H, Sinkó Z. A contribution to the systematics of the genus Tilia with respect to some hybrids by RAPD analysis. Dendrobiology. 2008;59:13–22.
- Colagar AH, Yusefi M, Zarei M, Yousefzadeh H. Assessment of genetic diversity of Tilia rubra DC. by RAPD analysis in the Hyrcanian forests, north of Iran. Pol J Ecol. 2013;61:341–348.
- Phuekvilai P, Wolff K. Characterization of microsatellite loci in Tilia platyphyllos (Malvaceae) and cross-amplification in related species. Appl Plant Sci. 2013;1(4):1–3
- Fineschi S, Carnevale S, Salvini D, Turchini D, Vendramin GG. Chloroplast DNA variation of Tilia cordata Mill. Can J Forest Res. 2003;33:2503–2508.
- Maurer WD, Tabel U. A methodological study to improve the isozyme analysis for identification of clones of Tilia (Linden syn. lime tree). Silvae Genet. 1995;45:351–356.
- Fromm M, Hattemer HH. Inheritance of allozymes and hybridisation in two European Tilia species. Heredity. 2003;91:337–344.
- Yousefzadeh H, Colagar AH, Tabari M, Sattarian A, Assadi M. Utility of ITS region sequence and structure for molecular identification of Tilia species from Hyrcanian forests, Iran. Plant Syst Evol. 2012;98:947–961.
- Gonzalez‐Astorga J, Castillo‐Campos G. Genetic variability of the narrow endemic tree Antirhea aromatica Castillo‐Campos & Lorence, (Rubiaceae, Guettardeae) in a tropical forest of Mexico. Ann Bot. 2004;93(5):521–528.
- Agarwal M, Shrivastava N, Padh H. Advances in molecular marker techniques and their applications in plant sciences. Plant Cell Rep. 2008;27:617–631.
- Kilic DE, Ikiel C. Vegetation geography of western part of Elmacik mountain, Turkey. J Environ Bio. 2012;33:293–305.
- Ikiel C, Ustaoglu B, Dutucu AA, Kilic DE. Remote sensing and GIS-based integrated analysis of land cover change in Duzce plain and its surroundings (north western Turkey). Environ Monit Assess. 2013;185:1699–1709.
- Jaccard P. Nouvelles recherches sur la distribution florale [New research on the floral distribution]. Bull Soc Vaud Sci Nat. 1908;44:223–270.
- Yeh FC, Boyle T, Rongcai Y. POPGENE Version 1.32: Microsoft windows-based freeware for population genetic analysis. Edmonton: Taylor & Francis; 1999.
- Kimura M, Crow JF. The number of alleles that can be maintained in a finite population. Genetics. 1964;49:725–38.
- Nei M. Analysis of gene diversity in subdivided populations. Proc Natl Acad Sci USA. 1973;70:3321–3323.
- Lewontin R. The apportionment of human diversity. Evol Biol. 1972;6:391–398.
- Rao VR, Hodgkin T. Genetic diversity and conservation and utilization of plant genetic resources. Plant Cell Tissue Organ Cult. 2002;68:1–19.
- Altay V, Ozyigit II, Yarci C. Urban flora and ecological characteristics of the Kartal district Jensen Istanbul): A contribution to urban ecology in Turkey. Sci Res Essays. 2010;5(2):183–200.
- Osma E, Ozyigit II, Altay V, Serin M. Urban vascular flora and ecological characteristics of Kadıköy district, Istanbul, Turkey. Maejo Int J Sci Tech. 2010;4(1):64–87.
- Kowarik I. Novel urban ecosystems, biodiversity, and conservation. Environ Pollut. 2011;159:1974–1983.
- Nowak DJ. Understanding the structure of urban forests. J For. 2004;92:243–256.
- Nowak DJ, JF Dwyer. Understanding the benefits and costs of urban forest ecosystems. In: J. Kuser, editor. Urban and Community Forestry in the Northeast. New York, NY: Taylor & Francis; 2007. p. 25–46.
- Altay V, Ozyigit II, Yarci C. Plant communities in urban habitats of Istanbul-Turkey. Pak J Bot. 2012;44:177–186.
- Loveless MD, Hamrick JL. Ecological determinants of genetic structure in plant populations. Ann Rev Ecol Syst. 1984;15:65–96.
- Vranckx G, Jacquemyn H, Muys B, Honnay O. Meta-Analysis of susceptibility of woody plants to loss of genetic diversity through habitat fragmentation. Conserv Biol. 2011;26:228–237.
- Hamrick JL, Godt MJW, Sherman-Broyles SL. Factors influencing levels of genetic diversity in woody plant species. New Forest. 1992;5:95–124.
- Bindiya K, Kanwar K. Random amplified polymorphic DNA (RAPDs) markers for genetic analysis in micropropagated plants of Robinia pseudoacacia L. Euphytica. 2003;132:41–47.
- Fan XX, Shen L, Zhang X, Chen XY, Fu CX. Assessing genetic diversity of Ginkgo biloba L. (Ginkgoaceae) populations from China by RAPD markers. Biochem Genet. 2004;42(7–8):269–278.
- Gómez A, Alía R, Bueno MA. Genetic diversity of Pinus halepensis Mill. populations detected by RAPD loci. Ann For Sci. 2001;58(8):869–875.
- Lee SW, Ledig, FT, Johnson DR. Genetic variation at allozyme and RAPD markers in Pinus longaeva (Pinaceae) of the White Mountains, California. Am J Bot. 2002;89(4):566–577.
- Diaz V, Muniz LM, Ferrer E. Random amplified polymorphic DNA and amplified fragment length polymorphism assessment of genetic variation in Nicaraguan populations of Pinus oocarpa. Mol Ecol. 2001;10(11):2593–2603.
- Saito Y, Shiraishi S, Tanimoto T, Yin L, Watanabe S, Ide Y. Genetic diversity of Populus euphratica populations in northwestern China determined by RAPD DNA analysis. New Forest. 2002;23(2):97–103.
- Balloux F, Lehmann L, de Meeûs T. The population genetics of clonal and partially clonal diploids. Genetics. 2003;164(4):1635–1644.
- Halkett F, Simon JC, Balloux F. Tackling the population genetics of clonal and partially clonal organisms. Trends Ecol Evol. 2005;20(4):194–201.
- Gaudeul M., Stenøien HK, Ågren J. Landscape structure, clonal propagation, and genetic diversity in Scandinavian populations of Arabidopsis lyrata (Brassicaceae). Am J Bot. 2007;94(7):1146–1155.
- Cistyakova AA. Bolsoj ziznennyj cikl Tilia cordata Mill. Bjull [High life cycle of Tilia cordata Mill], Mosk. Obsc.Ispyt. Prir Otd Biol. 1979;84:5–98.
- Cistyakova AA. Biologiceskije osobennosti vegetativnogo vozobnovienia osnovnych porod v sirokolistvennych lesach [Biological features of vegetative reproduction of basic rocks in deciduous forests]. Lesovedenie. 1982;2:11–17.