
 ?Mathematical formulae have been encoded as MathML and are displayed in this HTML version using MathJax in order to improve their display. Uncheck the box to turn MathJax off. This feature requires Javascript. Click on a formula to zoom.
Abstract
The objective of this study was to evaluate the cost of hospitalizations due to micro- and macrovascular complications in an observed cohort of 433 patients with diabetes. A six-month combined retrospective and prospective observational study was performed. The patients were separated into two groups depending on the type of diabetes and further into subgroups depending on the reason for hospitalization. The total costs for each subgroup were calculated and compared to the total costs of treatment for the observed period. In the type 2 diabetes group (n = 255), there were 128 people with microvascular complications and 215 ones with macrovascular complications, whereas in the type 1 diabetes group, there were only 70 people out of 178 with microvascular complications and 72 ones with macrovascular complications. The total cost of hospitalizations in the type 2 diabetes group was 34 469.76 EUR with the following reported reasons for hospitalizations: poor control of diabetes (45%), microvascular complications (23%) and macrovascular complications (31%). In the type 1 diabetes group, the total hospitalizations cost was equal to 15 319.33 EUR with the following split: 59% due to poor control of diabetes, 22% due to microvascular complications and 19% due to macrovascular complications. Thus, type 2 diabetes is more costly than type 1 when hospitalizations occur. Type 2 diabetes is associated with higher cost of macrovascular complications than of microvascular ones probably due to high hypertension prevalence. Costs are paid by the health insurance fund and the differences need to be systematically revealed.
Introduction
Diabetes is still recognized as one of the biggest global burdens both for healthcare systems and society. According to the World Health Organization (WHO), there were approximately 347 million people worldwide suffering from diabetes in 2012. WHO predicts that by the year of 2030 diabetes would become the seventh leading cause of death.[Citation1]
Some of the reasons for the constant increase of the number of patients globally are the aging of the population, urbanization and high prevalence of obesity due to sedentary lifestyle.[Citation2–4] Diabetes affects people at productive age (40–59 years) but in recent years it is spreading among younger generations: 78,000 children worldwide develop diabetes type 1 every year.[Citation5] Diabetes patients are at high risk of some complications like heart diseases, neuropathy, diabetic retinopathy and kidney failure.[Citation3,Citation6]
The number of people with diabetes in Europe is 52.6 million and this region ranks first in terms of number of children with diabetes type 1 (115 700 children in 2011).[Citation2] In Bulgaria, there are officially 300 000 people living with diabetes, of which approximately 10% are with diabetes type 1 and 270,000, with diabetes type 2.[Citation7]
In 2011, worldwide diabetes-related expenditures were equal to 465 billion USD, which is 11% of the total healthcare spending for adults. For the region of Europe these expenditures amounted to 130.6 billion USD.[Citation5]
According to a survey of the American Diabetes Association done in 1997 the total cost of diabetes mellitus was estimated at $98 billion, $44 billion of which was attributed to direct medical costs. Most of the direct medical costs were spent on diabetes-related complications.[Citation8] This amount is expected to have increased, having in mind the increase in patients with complications.
Hypertension, hyperglycaemia, dyslipidaemia, smoking and obesity are the most common risk factors for many of diabetes-related vascular complications.[Citation8,Citation9] Almost three times higher prevalence of hypertension is observed in patients with diabetes type 2 compared to the general population.[Citation10] Hypertension in diabetic patients enhances the chance of developing cardiovascular and renal diseases and increases the risk of death.[Citation11–14]
The mechanisms underlying the development of vascular disease in diabetes include the pathologic effects of advanced glycation end products (AGEs) accumulation, impaired vasodilatory response attributable to nitric oxide inhibition, smooth muscle cell dysfunction, overproduction of endothelial growth factors, chronic inflammation, hemodynamic dysregulation, impaired fibrinolytic ability and enhanced platelet aggregation.[Citation15–17] A huge success has been achieved in the understanding of the pathology of the disease and the establishment of treatment. Unified international guidelines for the treatment of diabetes are implemented at a national level in many Central European countries.[Citation18] Their application in some healthcare systems leads to significant savings of healthcare expenditures.[Citation19]
Still there is a difference in the cost of treatment of diabetes depending of the country, type of diabetes and also the type of diabetes-related complications.[Citation20,Citation21] In countries like Bulgaria, studies have confirmed that the main cost drivers are the medications for diabetes, outpatient medications for diabetes complications and the hospitalizations.[Citation22] Regional differences are also observed in the cost of treatment deriving mostly from the patients' characteristics, therapy differences (type of insulin and oral anti-diabetes therapy) and social and economic status.[Citation23]
The objective of the present study was to identify and compare the hospitalizations cost due to micro- and macrovascular complications with the total cost of therapy for type 1 and type 2 diabetic individuals treated with insulin. The relative share of the cost of hospitalization due to micro- or macrovascular complications within the total cost of therapy of the observed individuals was determined. The average costs of hospitalization per individual were compared in view of its cause or the type of diabetes.
Subjects and methods
Study design
The study design included combined retrospective and prospective observation with a duration of 6 months (3 months retrospectively and 3 months prospectively). Thirty-five endocrinologists from 27 geographical regions in Bulgaria were selected on a random basis. They recruited every first insulin-treated patient with diabetes type 1 and type 2 who appeared during the observational period and agreed to participate. All patients gave their informed consent and the study was approved by the Ethical Committee at the Medical University of Sofia.
Selection of patients
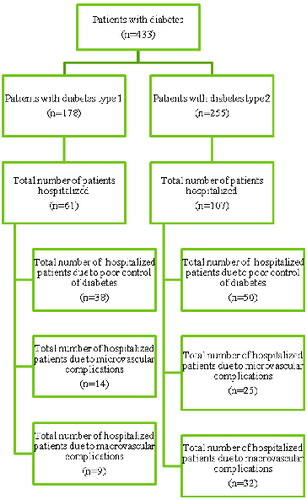
A sample size of 433 diabetic patients on insulin was selected and divided into two groups depending on the type of diabetes: patients with diabetes type 1 (n = 178) and patients with diabetes type 2 on a combined therapy of oral antidiabetic drugs (OADs) and insulin (n = 255). The two groups of patients were further divided into subgroups depending on the occurrence of hospitalization and then again, on the basis of the cause of hospitalization (due to poor control of diabetes, due to microvascular and macrovascular complications) ().
Figure 1. Selection of patients according to hospitalization type.
Healthcare resources
Information about the healthcare resources used was collected within three prospective and three retrospective months in 2010 and 2011. The healthcare resources identified and included in the analysis were the following:
type of insulin,
therapeutic regimen,
medications for patient therapy of complications,
hospitalizations due to poor control of diabetes and due to complications,
physicians' visits,
test-strips and glucometers.
Cost of hospitalizations analysis
Costs of hospitalizations were considered as the costs of healthcare services for poor control of diabetes and the different micro- and macrovascular complications. The costs were taken from the National Frame Contract (NFC) tariffs.[Citation24]
The total cost of the therapy for each individual within the selected cohorts was calculated by multiplying the units of resources used with their prices/tariff cost as follows:
The total cost of therapy was compared among the studied groups and with the cost for hospitalizations.
Information about the prices of the medicinal products and the medical devices for outpatient therapy was obtained from the Positive Drug List (PDL).[Citation25] The costs of physicians' visits and hospitalizations were taken from the National Health Insurance Fund (NHIF) tariffs.[Citation24]
The perspective of the analysis was that of the payer (NHIF) and neither indirect costs, nor patients' costs were included. All costs are presented in EUR for the 6-month period of observation.
Statistical analysis
Descriptive statistics analysis was performed for the individual patients' data with IBM SPSS Statistics ver. 21/2012.
Sensitivity analysis
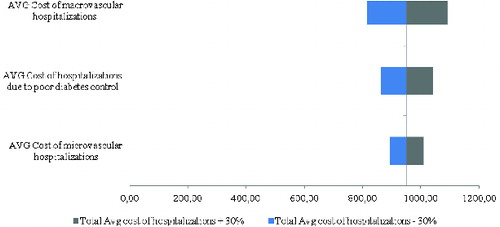
Sensitivity analysis was performed to evaluate the effect of the uncertain input data in the analysis: number of hospitalizations due to poor control of diabetes, microvascular and macrovascular complications. The uncertain input data were varied in the interval ±30%. A tornado diagram was used to illustrate the impact of the varied input parameters on the total costs of hospitalizations. Tornado diagrams were drawn to show the parameters with high impact on the total cost of hospitalizations for each group of patients.
Results and discussion
This is, to our knowledge, the first economic analysis in Bulgaria that focuses on the hospitalization costs of microvascular and macrovascular complications related to diabetes. Since costs are paid by the health insurance system, the differences need to be systematically revealed.
Patients' characteristics and hospitalization causes
Among the observed patients, type 2 diabetes was shown to prevail (59%), with an average duration of the disease equal to 15.47 years ().
Table 1. Patients' characteristics.
The patients with diabetes type 2 experienced more macrovascular complications than the patients with diabetes type 1 (84% vs. 41%). Hypertension was the most frequent complication; it was observed in 87% of the patients with diabetes type 2. Neuropathy and retinopathy were the most frequent microvascular complications in the observed cohort of patients with a slightly higher prevalence of retinopathy in the patients with diabetes type 1 (19% vs. 17% for diabetes type 2). Diabetic angiopathy and nephropathy were more common among the patients with diabetes type 1 than those with type 2 ().
During the observed period, 42% of the patients with type 2 diabetes and 34% of the patients with diabetes type 1 were hospitalized (). Out of 255 individuals, 18 patients with diabetes type 2 were hospitalized more than two times per year, whereas for type 1 diabetes these individuals were, respectively, 8 out of 178.
Table 2. Number of hospitalized patients with diabetes type 1 and type 2 (treated with insulin + OADs).
The number of hospitalizations due to poor control of diabetes was 41 for type 1 and 59 for type 2 diabetes, whereas those due to macro- and microvascular complications were less in type 1 individuals than in type 2 diabetics. The macrovascular disease-related hospitalizations were more common in the group of patients with diabetes type 2. In contrast, in the group of patients with diabetes type 1, although microvascular and macrovascular complications showed almost equal distribution, the hospitalizations due to the former were more frequent. The hospitalizations related to poor control of diabetes were almost equal in both groups of individuals and they were a result of hypoglycaemia, hyperglycaemia or deterioration of diabetes control ().
Table 3. Number of hospitalizations due to poor control of diabetes, micro- or macrovascular complications in patients with diabetes type 1 and type 2*.
Cost of hospitalizations
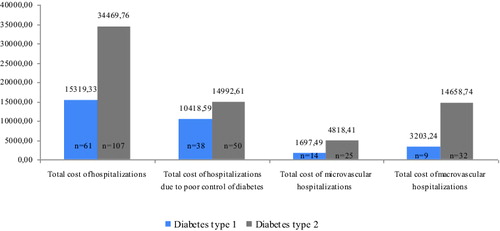
The cost analysis of the hospitalizations showed that the total cost of hospitalizations in the group of patients with diabetes type 2 was almost two-fold higher than in the patients with type 1 diabetes. Higher prevalence of the cost of treatment of macrovascular disease-related complications over microvascular ones was also observed ().
Figure 2. Total cost (EUR) of hospitalizations for the observed patients. Note: n is the number of hospitalized patients; some were hospitalized more than once for different reasons.
The hospitalization costs were further divided into costs of hospitalizations due to poor control of diabetes, microvascular complications and macrovascular complications. They were compared to the 6-month cost of diabetes pharmacotherapy and concomitant diseases therapy in the three studied reasons for hospitalization.
For the group of patients with diabetes type 1 who were hospitalized during the observed period, the cost of hospitalizations due to poor control of diabetes was 32% of the total cost of treatment, microvascular disease-related hospitalizations accounted for 14% of the total cost and macrovascular disease-related hospitalizations, for 31% of the total cost of treatment for those patients. In the group of the diabetes type 2 patients with hospitalizations, the cost of hospitalizations as a percentage of the total cost of treatment was 45%, 30% and 44% for hospitalizations due to poor control of diabetes, microvascular complications and macrovascular complications, respectively.
The cost comparison showed that the costs of hospitalizations due to poor control of diabetes were almost twice as high as the costs of diabetes pharmacotherapy and concomitant diseases therapy in patients with diabetes type 2 (). In the diabetes type 1 patients, the hospitalization costs due to poor control of diabetes were also higher than the cost of concomitant diseases treatment but a little lower than the cost of diabetes pharmacotherapy.
Figure 3. Cost (EUR) of hospitalizations depending on the reason compared to the cost of pharmacotherapy and cost of treatment of concomitant diseases for the observed period.
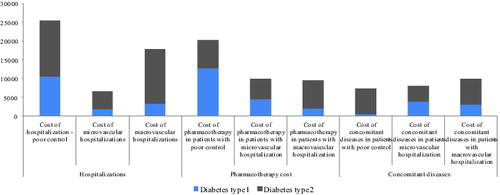
The costs of hospitalizations due to microvascular complications were lower than both the cost of diabetes and concomitant treatment for the patients with diabetes type 1 but higher than the cost of concomitant treatment in the group of patients with diabetes type 2. This lower proportion of the cost of microvascular disease-related complications compared to the total cost may be due to the lower cost of the healthcare services paid by the NHIF.
The cost of macrovascular disease-related hospitalizations was almost two-fold higher than the cost of diabetes pharmacotherapy and concomitant diseases treatment in the diabetes type 2 group. In the group of patients with diabetes type 1, these costs were also higher but closer to the cost of pharmacotherapy. Thus, the cost of hospitalizations due to macrovascular complications was the major cost driver of hospital care in both groups of patients.
Average cost per patient comparison
Comparative analysis of the average cost per patient between pharmacotherapy, concomitant diseases therapy and cost of hospitalizations due to poor control of diabetes and related micro- and macrovascular complications is presented in and .
Table 4. Average cost per patient with diabetes type 1 (in EUR).
Table 5. Average cost per patient with diabetes type 2 (in EUR).
The comparative analysis of the average cost per patient showed that diabetes type 2 was associated with a higher average cost of hospitalization regardless of the reason ( and , last column). On the contrary, the average cost of pharmacotherapy per patient with type 1 diabetes, except for those suffering from macrovascular complications ( and , first column), was higher. The cost of concomitant diseases therapy was high in the group of patients with diabetes type 1 suffering from micro- and macrovascular complications and low for the patients with poor diabetes control ( and , middle column). In some cases, the standard deviation was shown to be higher than the average value, which highlights the diversity of costs among patients with complications.
Sensitivity analysis
The results from the sensitivity analysis showed that the factor that would have a major impact on the total cost of hospitalizations for both diabetes type 1 () and type 2 () patients is the variation in the cost of hospitalizations due to macrovascular complications and poor diabetes control.
Figure 4. Tornado diagram on the impact of uncertain input parameters in the model on the total average cost of hospitalizations in the observed cohort of patients with diabetes type 1.
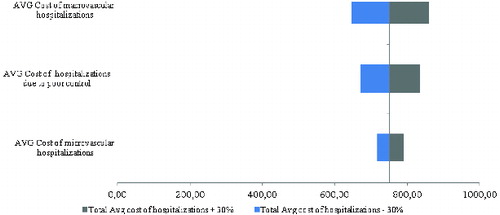
Figure 5. Tornado diagram on the impact of uncertain input parameters in the model on the total average cost of hospitalizations in the observed cohort of patients with diabetes type 2.
Studies from other authors revealed that the micro- and macrovascular complications of diabetes mellitus increase the direct medical costs.[Citation24] Their estimation and consideration of their impact is important in the process of decision making. Many studies on the cost and burden of diabetes-related complications have been performed, all showing that management of diabetes complications significantly increases the total costs in terms of hospital care. In the USA, the direct medical event costs for macrovascular complications related to diabetes type 2 varied from $3874 to $40,209 and from $372 to $31,226 for microvascular complications.[Citation26]
In five European Union countries (Italy, Germany, Spain, UK and France), a study on the diabetes expenditures and burden of disease shows that management of diabetes complications increases the average cost per patient, as the inpatient costs are significantly higher than the outpatient costs, probably due to the relatively low costs of maintaining good glycaemic control with medications and regular monitoring.[Citation27] The conclusion that the highest costs are the inpatients costs is partly supported by our results, which also add more evidence that the macrovascular complications are more costly.
A multi-country comparative analysis in three regions (Asia, Eastern Europe and Established Market Economies) on the hospital utilization and costs associated with diabetes complications shows that major complications significantly increase the hospital resources utilization and costs.[Citation28] The analysis shows that heart failure is the event associated with highest probability for hospitalization across the regions (93%–96%) and nephropathy, with the lowest probability (15%–26%). Taking into consideration the differences in the observed regions, the probabilities of hospitalization were considered lowest in Asia and highest in the Established Market Economies. All complications included in the analysis led to significant increase of the hospital costs but the heart failure events and coronary and cerebrovascular events attributed the most, accounting for Int$1800, Int$3000 and Int$4000 in Asia, Eastern Europe and Established Market Economies, respectively.[Citation28]
In Poland, for example, the direct medical costs of hospitalizations due to diabetes-related complications accounted for 332 million EUR in the period of 2005–2009 and were five times higher than the direct costs of hospital treatment of diabetes per se.[Citation29] In this study, we did not observe such a huge variation probably due to differences in the cost of healthcare resources.
In Lithuania, a study including 726 patients with diabetes type 2 shows that, in 2011, the mean annual cost of hospitalization per patient was 1160.16 EUR.[Citation30] The cost included pharmacotherapy and diabetes supplies. The majority of patients were diagnosed with at least one diabetes-related chronic complication. A correlation between the number of complications and the increase of average annual cost per patient was observed, accounting for up to 1588.98 EUR.[Citation30]
The results from our study are similar, demonstrating that diabetes is a costly disease when complications develop. In Bulgaria, the costs due to complications are the leading ones, especially when patients should be hospitalized. Complications are inevitable but to delay them is one of the major goals in long-term diabetes management. Having in mind the results from our study, we could recommend that the NHIF improve the planning not only of the cost of medicines therapy, but also of the hospitalizations costs.
Conclusions
This combined retrospective and prospective observational study showed that, in Bulgaria, type 2 diabetes is more costly than type 1 when hospitalizations occur. The cost of macrovascular complications is higher than that of microvascular ones probably due to considerable prevalence of hypertension. The difference in the hospitalizations costs between type 1 and type 2 may result from different patients' characteristics but needs to be systematically studied in order to inform policy makers. Micro- and macrovascular complications increase the direct medical costs and have impact on the total cost of treatment of diabetes. That is why it is important that they be taken into consideration in the process of decision making.
Disclosure statement
Two of the authors in this study, namely Vasil Valov and Marcin Czech, are employees of Novo Nordisk.
References
- WHO Media Centre [Internet]. Geneva: World Health Organization; c2015. Diabetes, Fact sheet N°312; January 2015 [cited 2015 Mar 10]; [about 4 screens]. Available from: http://www.who.int/mediacentre/factsheets/fs312/en/
- Zhang P, Zhang X, Brown J, Vistisen D, Sicree R, Shaw J, Nichols G. Global healthcare expenditure on diabetes for 2010 and 2030. Diabetes Res Clin Pract. 2011;87(3):293–301.
- Shaw JE, Sicree RA, Zimment PZ. Global estimates of the prevalence of diabetes for 2010 and 2030. Diabetes Res Clin Pract. 2010;87(1):4–14.
- Arredondo A. Type 2 diabetes and health care costs in Latin America: exploring the need for greater preventive medicine. BMC Medicine. 2014;12:136. Available from: http://www.biomedcentral.com/1741-7015/12/136
- International Diabetes Federation. Diabetes atlas. 5th ed. Brussels: Taylor & Francis; 2011.
- Roglic G, Unwin N, Bennett PH, Mathers C, Tuomilehto J, Nag S, Connolly V, King H. The burden of mortality attributable to diabetes: realistic estimates for the year 2000. Diabetes Care. 2005;28(9):2130–2135.
- Borisova AM, Zaharieva S, Tankova T, Petkova M, Hristov V, Koprivarova K. Preporaki za dobra klinichna praktika pri zaharen diabet [Guidelines on the treatment of diabetes mellitus]. Sofia: Taylor & Francis; 2013. Bulgarian. Available from: http://endo-bg.com/pictures/Preporuki-diabed.pdf
- Khan R. Economic consequences of diabetes mellitus in the US in 1997. Diabetes Care. 1998;21:296–308.
- Abrass CK. Diabetic nephropathy: mechanisms of mesangial matrix expansion. West J Med. 1995;162(4):318–321.
- McFarlane SI, Farag A, Sowers J. Calcium antagonists in patients with type 2 diabetes and hypertension. Cardiovascular Drug Rev. 2003;21(2):105–118.
- Pashkunova S, Ivanov V, Savov A. Savremenen pogled v patogenezata na diabetnata nefropatia [Contemporary view of the pathogenesis of diabetic nephropathy]. Vivata [Internet]. 2012 Mar 21 [cited 2015 Jan 20] [about 5 screens]. Available from: http://vivata.bg/diabetic-nephropathy
- Whaley-Connel A, Sowers JR. Hypertension and insulin resistance. Hypertension. 2009;54:974–980.
- Zhang P-Y. Cardiovascular disease in diabetes. Eur Rev Med Pharmacol Sci. 2014;18:2205–2214.
- Anwer Z, Sharma PK, Garg VK, Kumar N, Kumari A. Hypertension management in diabetic patients. Eur Rev Med Pharmacol Sci. 2011;15:1256–1263.
- Cade WT. Diabetes-related microvascular and macrovascular diseases in the physical therapy setting. Phys Ther. 2008;88(11):1322–1335.
- Chibber R, Molinatti PA, Rosatto N, Lambourne B, Kohner EM. Toxic action of advanced glycation end products on cultured retinal capillary pericytes and endothelial cells: relevance to diabetic retinopathy. Diabetologia. 1997;40(2):156–164.
- Fowler MJ. Microvascular and macrovascular complications of diabetes. Clinical Diabetes. 2008;26(2):77–82.
- Czech A, Cypryk K, Czupryniak L, Gajewska D, Grzeszczak W, Gumprecht J, Idzior-Waluś B, Jarosz-Chobot P, Kalarus Z, Karnafel W, Kokoszka A, Koblik T, Korzon-Burakowska A, Kowalska I, Loba J, Majkowska L, Małecki M, Mamcarz A, Mirkiewicz-Sieradzka B, Młynarski W, Noczyńska A, Raczyńska K, Sieradzki J, Słowik A, Solnica B, Stankiewicz A, Szadkowska A, Szelachowska M, Wender-Ożegowska E, Wierusz-Wysocka B, Zozulińska-Ziółkiewicz D. Zalecenia kliniczne dotyczące postępowania u chorych na cukrzycę, 2014 [Clinical guidelines for the management of patients with diabetes, 2014]. Diabetologia Kliniczna. 2014;3(A):S1–71.( Polish)
- Bjegovic V, Terzic Z, Marinkovic J, Latic N, Sipetic S, Laaser U. The burden of type 2 diabetes in Serbia and the cost-effectiveness of its management. Eur J Health Econ. 2007;8:97–103.
- Gordois A, Shuffham P, Shaerer A, Oglesby A. The health care costs of diabetic nephropathy in the United States and the United Kingdom. J Diabetes Complicat. 2004;18:18–26.
- Hex N, Bartlet C, Wright D, Taylor M, Varley D. Diabetic Med. 2012;29:855–862.
- Doneva M, Valov V, Borisova A-M, Tankova T, Savova A, Manova M, Czech M, Petrova G. Comparative analysis of the cost of insulin treated patients in Bulgaria. Biotechnol Biotechnol Equip. 2013;27(2):3748–3752.
- Valov V, Doneva M, Borisova A-M, Tankova T, Czech M, Manova M, Savova A, Peikova L, Petrova G. Regional differences in diabetic patients' pharmacotherapy in Bulgaria. Eur Rev Med Pharmacol Sci. 2014;18:1499–1506.
- National Health Insurance Fund [Internet]. Sofia: Taylor & Francis; c2009–2015 [cited 2014 Nov 20]. Bulgarian. Available from: www.nhif.bg
- National Council on Prices and Reimbursement of Medicinal Products [Internet]. Sofia: NCPRMP. Positive Drug List [cited 2014 Nov 20]. Bulgarian. Available from: www.ncpr.bg
- O'Brien JA, Patrick AR, Caro J. Estimates of direct medical costs for microvascular and macrovascular complications resulting from type 2 diabetes mellitus in the United States in 2000. Clin Ther. 2003;25(3):1017–1038.
- Kanavos P, van den Aardweg S, Schurer W. Diabetes expenditure, burden of disease and management in 5 EU countries. Taylor & Francis [Internet]. 2012 [cited 2015 Jan 20]. Available from: http://www.lse.ac.uk/LSEHealthAndSocialCare/research/LSEHealth/MTRG/LSEDiabetesReport26Jan2012.pdf
- Clarke PM, Glasziou P, Patel A, Chalmers J, Woodward M, Harrap SB, Salomon JA. Event rates, hospital utilization, and costs associated with major complications of diabetes: a multicountry comparative analysis. PLoS Med. 2010;7(2):e1000236.
- Lesniowska J, Schubert A, Wojna M, Skrzekowska-Baran I, Fedyna M. Costs of diabetes and its complications in Poland. Eur J Heatlh Econ. 2014;15(6):653–660.
- Domeikiene A, Vaivadaite J, Ivanauskiene R, Padaiga Z. Direct cost of patients with type 2 diabetes mellitus healthcare and its complications in Lithuania. Medicina. 2014;50(1):54–60.