
Abstract
Early and quick identification of wheat Waxy genes is important in different industries and in determining the quality of bread. A stable multiplex polymerase chain reaction (PCR) system was established to identify the three Waxy (Wx) genes in wheat. Three Waxy genes – A, B and D were amplified simultaneously by using two primer pairs that produce target sequences of 230/265 bp, 854 and 204 bp, respectively. By application of these two primer pairs Wx-A1, Wx-B1 and Wx-D1 genes can be detected in a single PCR, which can be helpful for breeders as a marker assisted selection in wheat quality breeding programmes. Also, by using two primer pairs, a maximum and minimum number of polymorphic bands were observed for Aegilops speltoites (B group) (100%) and Triticum durum (AB), and Triticum aestivum (ABD groups) (0.00%), respectively. The B group recorded the highest unbiased expected heterozygosity (0.282) and Shannon's index values (0.430), whereas the lowest values of unbiased expected heterozygosity (0.00) and Shannon's index (0.00) were recorded for the AB and ABD groups.
Introduction
Starch is the main constituent of wheat grain that comprises ∼65%–75% of its dry weight. This macromolecule is composed of two types of glucose polymers: amylose and amylopectin [Citation1] with a ratio of 22%–35% amylose and 68%–75% amylopectin. The ratio affects the starch properties, such as gelatinization, pasting and gelation, which are determinants of the end-use quality of flour from bread wheat (Triticum aestivum L.).[Citation2] Therefore, starch with different amylose–amylopectin ratios is needed for various applications in the industry.[Citation3] The granule-bound starch synthase or waxy protein is the key enzyme for amylose synthesis in wheat grain.[Citation4] The tetraploid wheat Triticum turgidum (2n = 4x = 28 AABB) and the hexaploid wheat Triticum aestivum (2n = 6x = 42 AABBDD) contain two and three waxy genes, respectively. These genes are located in the Waxy locus on the group-7 chromosomes of each genome.[Citation5,Citation6] The variability of waxy proteins in tetraploid and hexaploid wheat has been studied in detail and it showed low polymorphism levels,[Citation7–9] even when compared with other proteins of wheat grain, such as the storage proteins, glutenins and gliadins. Each of these Waxy genes has 11 exons and 10 introns, according to Murai et al. [Citation10]. These genes have similar molecular weight, therefore the identification of allelic variations among them is difficult.
New methods, such as sodium dodecyl sulphate–polyacrylamide gel electrophoresis (SDS-PAGE), light measurement, bioinformatics and sequencing, have been employed for germplasm screening for quality traits.
Maryami and Fazeli [Citation11] reported by using bioinformatic methods that there is a high variation of Waxy genes at nucleotide level in different wheats. Guzma´n and Alvarez [Citation12] used a sequencing method to identify phylogenetic relationships among Waxy genes of different species and concluded that there were high variations among them. Polymorphisms between durum wheat and wheat bread were shown by SDS-PAGE.[Citation13] However, polymorphism studies in relative wheat species, such as the Aegilops genus, have been very limited and few accessions have been analysed.[Citation14,Citation15] The Aegilops genus was important in the evolution of cultivated wheat. Two of the three genomes of bread wheat have been traced to this genus. The ancestor of the D genome of wheat is Aegilops tauschii Coss. [Citation16] and although the origin of the B genome has not been established, the species of the Sitopsis section may be the donors of this genome.[Citation17] The Aegilops species are suitable sources of new Waxy variants with different enzymatic activities that could enlarge the gene pool of modern wheats. The analysis of Waxy genetic variations in the Aegilops genus could be useful to elucidate the evolutionary relationship within this genus and between this genus and other wheats.
Multiplex polymerase chain reaction (PCR) methods have been used to study the genetic diversity of Waxy genes in different populations of wheat.[Citation18] In the multiplex PCR, two or more genes can be detected simultaneously. This technique can be efficiently used in marker-assisted selection for Waxy genes, which will improve the Waxy wheat selection. Lu et al. [Citation18] demonstrated a quick identification of the three genes in Waxy wheat using a multiplex PCR. The aim of this study was to investigate the genetic diversity and allelic genes among different wheat populations, including cultivated and wild cultivars, and to identify the various alleles in different wheat species, in order to examine the phylogenetic relationship between Waxy genes of other Poaceae species.
Materials and methods
Plant material
A total of 71 genotypes, including samples from eight diploid and tetraploid species of the Aegilops genus, as well as five wild species of the Triticum genus from Iran with different genomes were studied ().
Table 1. Genotypes of the Triticum and Aegilops wheat species used in this study.
DNA extraction and PCR amplification
DNA extraction procedure was based on the cetyltrimethylammonium bromide method.[Citation19] DNA concentration was determined using a UV visible spectrophotometer (APEL, PD-303UV model Japan). The DNA samples were stored at −20 °C prior to the experiments. DNA quality was evaluated by a visual comparison with DNA standards in ethidium bromide-stained agarose Tris-acetate-ethylenediaminetetraacetic acid (EDTA) (TAE) gels. Two primer pairs, which were designated in earlier studies,[Citation20,Citation21] were used to amplify the Waxy genes in different wheat species. PCR was carried out in a 20 µL reaction mixture, containing 2 µL template DNA, 1 µL of each primer, 0.53 µL of each dNTP, 1.8 µL MgCl2, 0.3 U of Taq DNA polymerase in 2 µL of 10 × PCR buffer (20 mmol/L, pH 8.4). The amplification process was run on BioRAD Thermal Cycler (USA) and included an initial denaturation at 94 °C for 4 min, followed by five cycles of denaturation at 92 °C for 30 s, primer annealing at 95 °C melting temperature (Tm) for 4 min, DNA elongation at 72 °C for 5 min, followed by five cycles of denaturation at 92 °C for 40 s; primer annealing at 50 °C (as listed in ) for 60 s, 72 °C for 2 min and a last extension at 72 °C for 5 min. The amplification products were separated in 1.5% agarose gels (Ultrapure, Invitrogen), run in 1 × TAE buffer (pH 8) and stained with ethidium bromide. As molecular markers, we used 100–1500 bp DNA ladder (Fermentas).
Table 2. Specific primers used in this study.
Data analyses
The amplicons were scored as present (1) or absent (0) and each of them was treated independently, regardless of its intensity. A cluster analysis was conducted by the pairwise dissimilarity matrices generated by Jaccard's coefficient of dissimilarity using DARwin (Ver 5.0.158). Correlations between the two matrices, obtained with two marker types, were estimated by the means of the Mantel matrix correspondence test.[Citation22] The obtained matrix of dissimilarity was analysed using the Neighbour Joining (NJ) algorithm. To evaluate the goodness of fit of the NJ cluster analysis, the Mantel test in XLSTAT (2014) software was utilized to calculate the cophenetic correlation coefficients between the dendrogram and the original genetic similarity matrix. Genetic divergence among populations was investigated using Nei's unbiased genetic distance. The genetic diversity parameters, shown in , were estimated. Mantel test was performed to evaluate the correlation between the matrices genetic and geographic distances. A principal component analysis (PCA) was also performed by using software GenALEx version 6.41 [Citation23,Citation24] to display the genetic relationship among individuals with different genomes (A, B, D, AB and ABD) across each study site. The genetic similarity indices between all possible pairs of individuals within each population were also computed.[Citation25] Analysis of molecular variance (AMOVA) was carried out in GenALex (ver 6.4) for analysis of partitioning of variation between and within populations.
Table 3. Calculation of genetic indices in different wheat groups.
Results and discussion
Genetic diversity and classification analysis among wheat populations
The genetic diversity parameters of different populations are summarized in . The unbiased expected heterozygosity and Shannon's information indices of different geographic groups of germplasms in group B were 0.282 and 0.430, respectively. Also, in both AB and ABD groups, these parameters were calculated as 0.00. The B group was more heterogeneous with a greater number of alleles. To assess the degree of similarity between the different groups, the Nei corrected index and NJ algorithm data of different groups were plotted on a dendrogram (). The obtained dendrogram divided the groups into three major categories. The results of the cluster analysis largely showed a lack of correlation between genetic and geographic diversity. In this study, the A and D groups showed the greatest genetic similarity. Therefore, it can be concluded that they were located in a cluster, because of the close phylogenetic relationship between the Aegilops and Triticum species. Also, amplification of DNA genomics by using two primer pairs for all populations showed that B group had 100% polymorphism; however, no polymorphism was observed in other populations.
Figure 1. Dendrogram, obtained from five different wheat populations with neighbour joining algorithm based on Jaccard's coefficient.
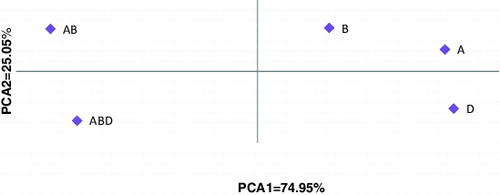
The results from the PCA indicated that the first and second components represented 74.95% and 25.05% of the information among the samples for Waxy B, A and Waxy D, respectively. The groups that were closer to the coordinate centre had the highest allelic frequencies and heterogeneity. When compared with other groups, group B had the shortest distance from the centre axis and groups A and D had the shortest distance between two groups. The results from this diagram were consistent with the results from the cluster analysis, in which the D and ABD groups had the largest distance between two groups and groups A and D were the most similar ones ().
Figure 2. Diagram of the two-dimensional distribution of different groups of wheat waxy genes on the first and second axis.
Partitioning of variation among and within populations of different geographical origins
The results of the AMOVA analysis indicated that the majority of the genetic variation in Waxy genes in different wheat populations was due to within population variation (). There was a highly significant difference between Waxy genes in different wheat populations from different regions of Iran.
Table 4. Analysis of molecular variances (AMOVA) summary for five groups of Waxy genes in wheat.
Bread wheat quality is a main factor in breeding programmes that are controlled by genetics. Waxy genes (Wx-A1, Wx-B1 and Wx-D1) are responsible for amylose synthesis in hexaploid wheat grains, which is a major factor in wheat quality. Using the loci of these three proteins, phylogenetic relationships among wheats can also be studied. The Aegilops genus played an important role in the evolution of wheat cultivars. Two of the three genomes of bread wheat belong to this genus. Although the origins of genome B (2n = 2x = 14, SS) are unclear, Aegilops speltoites may be a good candidate for this genome's ancestor.[Citation26] Diversity at the nucleotide level of Waxy genes between the Aegilops and Triticum genera has been applied to analyse phylogenetic relationships. The results were consistent with the origins of genomes A, B and D.[Citation14,Citation27–31] To identify the Wx-D1 gene of Aegilops species in the present study, species with U (Aegilops umbellulata), MD (Aegilops crassa), CU (Aegilops triuncialis), UM (Ae. neglecta), DM (Ae. crassa), UM (Ae. ovata) and C (Ae. caudata) genomes () were used. It was observed that the PCR product of the M, C and U genomes produced a 204 bp band, which was similar in size with that of Ae. tauschii. Thus, the genomes, which were identified [Citation32,Citation33] appeared to be related and were likely Ae. tauschii ancestors.[Citation34,Citation35] Additionally, Li et al.[Citation36] studied the molecular characteristics of Waxy genes in Ae. tauschii and showed that the Wx-D1 sequences in the Aegilops species formed a group. The Waxy gene sequences from tomato and rice formed a second group and the sequence of Arabidopsis and peas formed the third group. Also, they showed that the barley sequence was similar to that of the Aegilops wheat species. In different studies, Triticum urartu, a wild diploid wheat (2n = 2x = 14, AA), was reported in the wheat poliploid genome.[Citation37,Citation9] In the present study, the investigation of population with A genome by PCR analysis revealed that Wx-A gene in populations was from Triticum boeoticum. However, other studies reported the opposite result.[Citation12,Citation38] Additionally, Aegilops populations with the S genome were used to identify Wx-B genes. PCR products confirmed the relationship between Wx-B and Wx-S genes and showed that the likely wild ancestor was Aegilops speltoides. This corroborates the results of previous studies.[Citation33,Citation12] The present study showed that Wx-A and Wx-D genes had the highest similarity, which may be due to the close phylogenetic relationship between the Triticum and Aegilops genera. Petersen et al. [Citation39] investigated the phylogenetic relationship between Aegilops and Triticum genera and also reported a close resemblance between A and D genomes, which likely had a common ancestor. Due to factors, such as migration, selection and mutation, the genetic characteristics of populations have been altered. Different studies reported, while studying the U, M, N and C genomes that the pair homologs of these genomes that exist on the A and D chromosome, are genetically the most similar.[Citation40–42]
Conclusions
The present study was the first report of using multiplex PCR to assess the genetic variability and differentiation among the Waxy genes of different wheat populations, widely distributed in Iran. Phylogenetic analysis of Waxy genes can be studied in different species of wheat using specific primers. Variation between Aegilops and Triticum genus with different genomes is a useful tool for phylogenetic analysis among A, B and D genomes in different species. Our results indicated that application of these primers can be suitable for the purpose. In our study, Waxy B gene showed high diversity that has a key role in starch quality. This is why, in future researches, the sequences of the polymorphic fragment target for Waxy B gene must be identified. Also, it is necessary to test the expression of this polymorphic fragment in different wheats.
Disclosure statement
No potential conflict of interest was reported by the authors.
References
- James MG, Denyer K, Myers AM. Starch synthesis in the cereal endosperm. Curr Opin Plant Biol. 2003;6:215–222.
- Zeng M, Morris CF, Batey IL, Wrigley CW. Sources of variation for starch gelatinization, pasting, and gelation properties in wheat. Cereal Chem. 1997;74:63–71.
- Baldwin PM .Starch granule-associated proteins and polypeptides: a review. Starch/Staerke. 2001;53:475–503.
- Nakamura T, Yamamori M, Hirano H, Hidaka S. Production of waxy (amylose-free) wheats. Mol Gen. 1995;248:253–259.
- Chao S, Sharp PJ, Worland AJ, Warham EJ, Koebner RMD, Gale MD. RFLP-based genetic maps of wheat homoeologous group 7 chromosomes. Theor Appl Genet. 1989;78:495–504.
- Ainsworth C, Clark J, Balsdon J. Expression, organization and structure of the genes encoding the waxy protein (granule-bound starch synthase) in wheat. Plant Mol Biol. 1993;22:67–82.
- Rodriguez-Quijano M, Nieto-Taladriz MT, Carrillo JM. Polymorphism of waxy proteins in Iberian hexaploid wheats. Plant Breed. 1998;117:341–344.
- Miller TE. Systematic and evolution. In: Lupton FGH, editor. Wheat breeding: its scientific basis. London: Taylor & Francis; 1987 p. 1–30.
- Urbano M, Margiotta B, Colaprico G, Lafiandra D. Waxy proteins in diploid, tetraploid and hexaploid wheats. Plant Breed. 2002;121:465–469.
- Murai J, Taira T, Ohta D. Isolation and characterization of the three Waxy genes encoding the granule-bound starch synthase in hexaploid wheat. Gene. 1999;234:71–79.
- Maryami Z, Fazeli A. Phylogenetic analysis of waxy genes in wheat's using bioinformatics methods. Int J Biosci. 2013;3(9):23–28.
- Guzma´n C, Alvarez JB. Molecular characterization of a novel waxy allele (Wx-Au1a) from Triticum urartu Thum. ex Gandil. Genet Resour Crop Evol. 2012;59:971–979.
- Yamamori M, Quynh NT. Differential effects of Wx-A1, -B1 and -D1 protein deficiencies on apparent amylose content and starch pasting properties in common wheat. Theor Appl Genet. 2000;100:32–38.
- Yan L, Bhave M, Fairclough R, Konik C, Rahman S, Appels R. The genes encoding granule-bound starch synthases at the waxy loci of the A, B, and D progenitors of common wheat. Genome. 2000;43:264–272.
- Caballero L, Bancel E, Debiton C, Branlard G. Granulebound starch synthase (GBSS) diversity of ancient wheat and related species. Plant Breed. 2008;127:548–553.
- Dvorˇa´k J, Luo MC, Yang ZL. Restriction fragment length polymorphism and divergence in the genomic regions of high and low recombination in self-fertilizing and cross-fertilizing Aegilops species. Genetics. 1998;148:423–434.
- Tsunewaki K, Ogihara Y. The molecular basis of genetic diversity among cytoplasms of Triticum and Aegilops species. II. On the origin of polyploid wheat cytoplasms as suggested by chloroplast DNA restriction fragment patterns. Genetics. 1983;104:155–171.
- Lu LD, Hou CL, Chen L, Yin GH, Deng CL, Gao WJ, Yang XQ, Tan GX. Molecular identification on Waxy genes in wheat using multiple-PCR. Hereditas (Beijing). 2009;31(8):844–848.
- Doyle JJ, Doyle JL. A rapid DNA isolation procedure for small quantities of fresh leaf tissue. Phytochem Bull. 1987;19:11–15.
- Shariflou MR, Sharp PJ. A polymorphic microsatellite in the 3' end of ‘waxy’ genes of wheat, Triticum aestivm. Plant Breed. 1999;118(3):275–277.
- Shariflou MR, Hassani ME, Good G, Sharp PJ. Tightly linked DNA markers for the waxy loci in bread wheat. Paper presented at: 10th International Wheat Genetics Symposium. 2003 Sep; Paestum, Italy; p. 831–834.
- Mantel N. The detection of disease clustering and a generalized regression approach. Cancer Res. 1967;27:209–220.
- Peakall R, Smouse PE. GenAlEx 6: genetic analysis in Excel. Population genetic software for teaching and research. Mol Ecol Notes. 2006;6:288–95.
- Kumar S, Tamura K, Nei M. MEGA3: integrated software for molecular evolutionary genetics analysis and sequence alignment. Brief Bioinform. 2004;5:150–163.
- Sneath PHA, Sokal RR. Numerical taxonomy. The principles and practice of numerical classification. San Francisco, CA: Taylor & Francis; 1972.
- Feldman M. The origin of cultivated wheat. In: Bonjean AP, Angus WJ, editors. The world wheat book. A history of wheat breeding. Paris: Taylor & Francis; 2001 p. 3–56.
- Mason-Gamer RJ, Weil CF, Kellogg EA. Granule-boundstarch synthase: structure, function, and phylogeneticutility. Mol Biol Evol. 1998;15:1658–1673.
- Mason-Gamer RJ. Origin of North American Elymus (Poaceae: Triticeae) allotetraploids based on granulebound starch synthase gene sequences. Syst Bot. 2001;26:757–768.
- Ingram AL, Doyle JJ. The origin and evolution of Eragrostistef (Poaceae) and related polyploids: evidence from nuclear waxy and plastid rps16. Am J Bot. 2003;90:116–122.
- Fortune PM, Schierenbeck KA, Ainouche AK, Jacquemin J, Wendel JF, Ainouche ML. Evolutionary dynamics of waxy and the origin of hexaploid Spartina species (Poaceae). Mol Phylogenet Evol. 2007;43:1040–1055.
- Li W, Gao Z, Xiao W, Wei YM, Liu YX, Chen GY, Pu ZE, Chen HP, Zheng YL. Molecular diversity of restriction enzyme sites, Indels and upstream open reading frames. (uORFs) of 50 untransalted regions (UTRs) of Waxy genes in Triticum L. and Aegilops L. species. Genet Resour Crop Evol. 2012;59:1625–1647.
- Dvorˇa´k J, Zhang HB. Reconstruction of the phylogeny of the genus Triticum from variation in repeated nucleotide sequences. Theor Appl Genet. 1992;84:419–429.
- Wang S, Li X, Wang K, Wang X, Li S, Zhang Y, Guo G, Zeller FJ, Hsam SLK, Yan Y, Gustafson P. Phylogenetic analysis of C, M, N, and U genomes and their relationships with Triticum and other related genomes as revealed by LMW-GS genes at Glu-3 loci. Genome. 2011;54:273–284.
- Maryami Z, Fazeli A, Mehrabi AA. Identification of variation for Wx-D genome in wheat and its ancestor. Adv Environ Biol. 2014;8(7):2012–2016.
- Ortega R, Alvarez JB, Guzman C. Characterization of the Wx- gene in diploid Aegilops species and its potential use in wheat breeding. Genet Resour Crop Evol. 2014;61:369–382.
- Li W, Liu AJ, Sheng YZ, Chen GY, Pu ZI, Liu YX. Molecular charaterization of Waxy gene in Aegilops tauschii. Asian J Plant Sci. 2013;12(1):34–39.
- Johnson BL. Identification of the apparent B-genome donor of wheat. Can J Genet Cytol. 1975;17:21–39.
- Maryami Z, Fazeli A, Mehrabi AA. Investigation of diversity of Waxy-A1 gene using amplification in different spices in A genome wheat's. Adv Environ Biol. 2014;8(7):2004–2007.
- Petersen G, Seberg O, Yde M, Berthelsen K. Phylogenetic relationships of Triticum and Aegilops and evidence for the origin of the A, B, and D genomes of common wheat (Triticum aestivum). Mol Phylogenet Evol. 2006;39:70–82.
- Fernández-Calvín B, Orellan J. Relationship between pairing frequencies and genome affinity estimations in Aegilops ovata × Triticum aestivum hybrid plants. Heredity. 1992;68:165–172.
- Cifuentes M, Blein M, Benavente E. A cytomolecular approach to assess the potential of gene transfer from a crop (Triticum turgidum L.) to a wide relative (Aegilops geniculata Roth.) Theor Appl Genet. 2006;112:657—664.
- Zaharieva M, Monneveux P. Spontaneous hybridization between bread wheat (Triticum aestivum L.) and its wild relatives in Europe. Crop Sci. 2006;46:512–527.