
 ?Mathematical formulae have been encoded as MathML and are displayed in this HTML version using MathJax in order to improve their display. Uncheck the box to turn MathJax off. This feature requires Javascript. Click on a formula to zoom.
ABSTRACT
The direct production of hydrogen from various carbohydrates of lignocellulosic biomass is examined by using single-chamber membrane-free microbial electrolysis cells. The mixed microbial culture was enriched with 20 mmol L−1 2-chloroethane sulphonate and 10 mmol L−1 sodium acetate as a carbon source. Hydrogen was produced from all carbon sources used, including monosaccharides (glucose, galactose, mannose, xylose and arabinose) and disaccharides (maltose, saccharose and cellobiose). Hydrogen gas (18 mL) was produced using 3.33 mmol L−1 maltose and 20 mL of hydrogen was produced using cellobiose after 14 d of operation. Methane was not produced under any of the tested conditions. The effects of sugar concentration were also examined. Hydrogen production rates varied from 0.01 m3 d−1 m−3 to 0.09 m3 d−1 m−3. The maximum hydrogen yield ranged from 14% to 111%. Our results suggested that carbohydrates, such as maltose and cellobiose, are suitable carbon sources for hydrogen production, when methanogens are suppressed.
Introduction
Microbial electrolysis cells (MECs) are novel biotechnological tools that can convert organic matter found in biomass into hydrogen. Recent studies have focused on MEC technology because of its potential as a revolutionary alternative.[Citation1,Citation2] Electrogenic micro-organisms degrade organic compounds, leading to the generation of hydrogen by applying electric current.[Citation3] Lignocellulosic biomass is rich in complex carbohydrates that can be used to feed micro-organisms for the production of renewable energy sources, such as ethanol, methane and electricity.[Citation4–6] Most micro-organisms cannot utilize lignocellulosic materials directly and pretreatment processes (e.g. acid or enzymatic pretreatment) are necessary for the efficient utilization of these sources.[Citation7,Citation8] The composition of lignocellulosic hydrolysates vary and these carbon sources are utilized by various kinds of micro-organisms for the production of hydrogen, as well as for the production of methane by methanogens.[Citation9,Citation10] The acid hydrolysis of lignocellulosic materials leads to the production of sugar mixtures, including glucose, xylose and some phenolic compounds.[Citation11] One of the principal challenges in the application of MEC technology is the relative utilization of lignocellulose-derived carbohydrates for hydrogen production in MECs. Therefore, a better understanding of the major carbon sources found in biomass should help to enhance the hydrogen production efficiency.
The acid hydrolysates of lignocellulosic biomass supposedly contain all of the carbohydrates examined in this study. However, it is not known which carbohydrates are preferred for hydrogen generation in MECs. Therefore, the carbohydrate hydrogen production profiles of these carbohydrates should be investigated. Comparison of these carbohydrates will help to optimize the hydrolyzation process of lignocellulosic materials for renewable hydrogen generation.
In this study, the performance of various hexoses (glucose, mannose, galactose), pentoses (xylose, arabinose) and disaccharides (maltose, saccharose, cellobiose) was examined in single chamber membrane-free MECs. The effect of sugar concentration on biohydrogen production was also tested.
Materials and methods
Chemicals
Glucose, mannose, xylose, arabinose and cellobiose were purchased from Alfa Aesar (Karlsruhe, Germany). Galactose and maltose sugars were purchased from Amresco (Solon, Ohio, USA). Saccharose was purchased from VWR Chemicals (Leuven, EC). All other chemicals were of analytical grade and were obtained from commercial sources.
Enrichment of micro-organisms
A mixed bacterial culture that was originally enriched from a local domestic wastewater treatment plant (Pasakoy Advanced Biological Wastewater Treatment Plant, Istanbul, Turkey) and that had been previously cultured in MECs by using 10 mmol L−1 sodium acetate and 2-chloroethane sulphonate (CES) was used as a source of electro-active bacteria in the enrichment step, as previously reported.[Citation12] The strain was cultured in 100 mL volume air-tight rubber septa sealed syringe bottles containing 80 mL of growth medium under strict anaerobic conditions purging a mixture of N2 / CO2 gas for 10 min. The medium was prepared as previously described and consisted of the following compounds: 0.1 g L−1 KCl, 0.15 g L−1 NH4Cl, 0.6 g L−1 Na2HPO4, 0.82 g L−1 sodium acetate, 2.5 g L−1 NaHCO3, 10 mL L−1 trace element solution, 10 mL L−1 vitamin solution and 1 mL L−1 selenite–tungstate solution.[Citation13] The pH of the medium was adjusted to neutral after boiling for 30 min, cooling down to room temperature and sterilized by autoclaving (121 ºC for 15 min). Filter-sterilized fumarate solution (0.5 mL of 40 mmol L−1 stock solution per 10 mL of the medium) was then added to the individual bottles as a terminal electron acceptor. Finally, 20 mmol L−1 CES was added to the culture bottles.
Each bottle was inoculated with bacteria and placed in a rotary shaker at 37 ºC. On the fourth day of culture, the cells were harvested by centrifugation (Beckman Coulter Allegra X-30) (4500 rpm for 15 min at 4 °C) and washed with sterile anaerobic phosphate buffer solution (pH 7.0, 100 mmol L−1). The cell biomass was then resuspended using the sterile medium to initiate the experiments and transferred into the MECs sealed with an aluminium cap. All subsequent incubations were performed at 30 ºC ± 2 ºC.
Construction and operation of MECs
Single chamber MECs constructed by using glass serum vials (17 mL) were used to investigate the hydrogen production by a mixed culture, as reported previously.[Citation14] The anodes (2 cm × 1 cm) were made of carbon cloth Lot No: 14032102 (FuelCells, TX, USA) and the cathodes (2 cm × 1 cm) were made of carbon cloth Lot No: CTO32414 (FuelCells, TX, USA) containing 0.5 mg cm−2 Pt catalyst. The electrodes were connected by titanium wire. MECs were sealed with rubber stoppers and aluminium caps and purged with N2/CO2 gas (80:20 ratio) to remove the oxygen. The MECs were then inoculated with enriched micro-organisms obtained from a running MEC and operated at an applied voltage of 0.7 V. MECs without inoculum were used as a control group. The solution was replaced with fresh medium by using a sterile syringe in batch mode, when the hydrogen production started to decrease.
The following carbon sources were examined in this study: glucose (6.7 mmol L−1), mannose (6.7 mmol L−1), galactose (6.7 mmol L−1), xylose (8 mmol L−1), arabinose (8 mmol L−1), maltose (3.33 mmol L−1), saccharose (3.33 mmol L−1) and cellobiose (3.33 mmol L−1). The medium solution (100 mmol L−1 ionic strength) consisted of: NH4Cl (0.31 g L−1), NaH2PO4·H2O (5.84 g L−1), Na2HPO4·7H2O (15.47 g L−1), KCl (0.13 g L−1), a mineral solution (12.5 mL) and a vitamin solution (12.5 mL), as previously reported.[Citation13] The different molar concentrations of the carbohydrates were used in order to standardize the total organic carbon (TOC) concentration (480 mg L−1) in the medium. In order to understand the effects of the carbohydrates on the accumulated hydrogen production (mL), the following concentrations were examined until the hydrogen production decreased (for 14 d): 3.3 mmol L−1 for glucose, galactose, mannose; 4 mmol L−1 for xylose and arabinose; 1.65 mmol L−1 for maltose, saccharose and cellobiose. Lower concentrations were chosen in order to achieve the same TOC.
The MECs were purged using a mixture of N2/CO2 gas for 10 min and 0.7 V was applied to the MECs by connecting the positive pole of a power supply (GPS-3030DD, Good Will DC, CA, USA) to the anodes. A multimeter (ADC24, Picolog; Cambridgeshire, UK), connected to a computer (HP 2311×), was used to record the voltage measurements across a 2.2 Ω external resistor placed in series between the positive terminal of the power supply and the anode of each reactor. All MECs were run simultaneously.
Analyses and calculations
The gases generated in MECs were regularly measured and released using an air-tight glass syringe (1 mL). The composition was analysed using a gas chromatograph (Agilent, 7820A; J&W Scientific, USA) equipped with a thermal conductivity detector (AGT-64332A) and a column (113-3133 GS-carbonplot, 30 m, 0.32 mm, 3 mm, J&W Scientific, USA), with argon as the carrier gas (185 °C heater, column flow 2.8 mL min−1, pressure 12,734 psi (89,631.8 Pa).[Citation12]
EquationEquation (1)(1)
(1) was used for the calculation of the expected gas production (H2, CH4, CO2):
(1)
(1) where VEt (mL) is the expected specific gas (H2, CH4, CO2) production at sample time t based on integrated current over time in coulombs (C), F is the Faraday's number (96.485 C mol−1), Ct is the total coulombs by integrating the current over time and VM is the molar gas volume (25.200 mL mol−1 at 30 °C).[Citation12,Citation14] The hydrogen yield (YH2) (%) was calculated based on the amount of hydrogen generated over the total substrate used, as previously reported.[Citation14] Actual ratio was calculated based on moles of substrate used per moles of H2. The volumetric H2 production rates, QH2 (m3 day−1 m−3) was calculated based on the measured hydrogen production rate normalized to the solution volume.[Citation14]
Results and discussion
Hydrogen production by mixed microbial culture
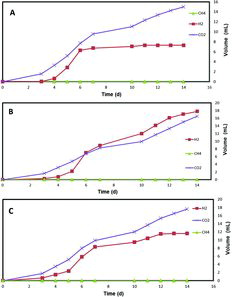
No methane was detected in any of the experiments, while the biohydrogen production profiles varied across the various tested conditions. shows the gas production levels using 6.7 mmol L−1 of the hexoses (glucose, galactose and mannose). The accumulated amounts of CO2 and H2 by using glucose were 15 mL and 8 mL, respectively. However, galactose resulted in equal proportions of CO2 and H2. Mannose generated more CO2 than H2 (18 mL and 12 mL, respectively). In MECs, in which electrogenic micro-organisms play an important role, hydrogen is expected to be generated at a greater proportion than other gases and this depends on the applied voltage. Our results showed that the microbial culture used here preferred hexose sugars for fermentation, when the methane generation is suppressed. These results indicated that fermentation was overcome by a hydrogen generation process. Treatment with CES resulted in the elimination of methanogenic micro-organisms, resulting in hydrogen generation. For better hydrogen generation efficiency in future studies, the microbial culture should be designed with this in mind.
Figure 1. Gas (H2, CH4, CO2) production by a mixed culture in single chamber membrane-free MECs using 6.7 mmol L−1 hexose monosaccharides (glucose (A), galactose (B) and mannose (C)) as carbon sources.
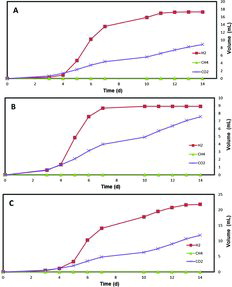
shows the gas generated by the pentoses (xylose and arabinose) at a concentration of 8 mmol L−1. The hydrogen production was lower, compared to that obtained from the hexose sugars. CO2 production was fourfold and threefold higher than H2 production, when using xylose and arabinose, respectively. Among all of the carbohydrates used in the study, the highest hydrogen production was achieved when using the disaccharides (maltose, saccharose and cellobiose). About 18 mL of H2 was produced using 3.33 mmol L−1 maltose, while cellobiose produced about 20 mL of hydrogen after 14 d of operation () When using the pentoses, there was no methane generation and the amount of H2 was lower than that of the CO2 production. Saccharose (3.33 mmol L−1) generated 9 mL of H2 with an almost equal quantity of CO2 produced (). These results suggested that disaccharides (maltose and cellobiose) are the most suitable carbon sources for hydrogen production, when methanogens are suppressed.
Figure 2. Gas (H2, CH4, CO2) production by a mixed culture in single chamber membrane-free MECs using 8 mmol L−1 pentose monosaccharides (xylose (A) and arabinose (B)) as carbon sources.
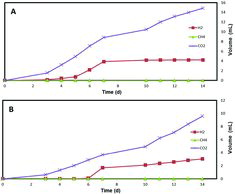
Figure 3. Gas (H2, CH4, CO2) production by a mixed culture in single chamber membrane-free MEC using 3.33 mmol L−1 disaccharides (maltose (A), saccharose (B) and cellobiose (C)) as carbon sources.
Electrogenic micro-organisms can utilize a wide variety of carbohydrates for electricity generation in microbial fuel cells. Acidic hydrolysates of lignocellulosic materials contain a mixture of sugars that can feed micro-organisms for electricity, biohydrogen or biodiesel production.[Citation15–17] The composition of the hydrolysate may vary depending on the hydrolysis conditions. In this respect, the hydrolysation process should be optimized for the production of higher disaccharide concentrations when methanogens are suppressed in MECs.
Performance of MEC
shows the obtained gas amounts when using lower concentrations of carbohydrates in MECs. Similar gas production results were observed while the amounts of gases were lower. Similarly, lower concentrations of disaccharides generated higher hydrogen yield.
Table 1. MEC gas production under low carbohydrate concentrations.
The maximum theoretical hydrogen yield (YH2) ranged from 14% to 111% (). Glucose produced the highest maximum YH2 (83%) with actual ratio of 10 mol H2/mol glucose, and mannose produced the lowest YH2 (55%) with actual ratio of 6.6 mol H2/mol mannose, among the tested hexoses. The usage of xylose resulted in a higher YH2 (20%) than arabinose (14%) and the actual ratio values were also higher (1.95 mol H2/mol xylose, 1.41 mol H2/mol arabinose, respectively). Among the tested disaccharides, the usage of cellobiose resulted in the highest YH2 (111%) with an actual ratio of 24.3 mol H2/mol cellobiose, whereas lower YH2 (45%) was obtained by using saccharose (with actual ratio of 10 mol H2/mol saccharose). YH2 (88%) with an actual ratio of 19.3 mol H2/mol maltose was obtained by using maltose as a substrate. These results indicated that the theoretical hydrogen yield was higher in the presence of disccharides, including cellobiose and maltose, when compared to the other examined carbohydrates. Lalaurette et al. [Citation18] reported that the overall hydrogen yield of 9.95 mol H2/mol glucose for the cellobiose was reported using a two-stage fermentation and MEC process.
The volumetric H2 production rates were in the range from 0.01 m3 d−1 m−3 to 0.09 m3 d−1 m−3 at 0.7 V. The usage of galactose resulted in the highest rate (0.07 m3 d−1 m−3), when compared to glucose and mannose (0.03 m3 d−1 m−3, 0.05 m3 d−1 m−3, respectively). The lowest hydrogen production rates were observed in xylose and arabinose (0.02 m3 d−1 m−3, 0.01 m3 d−1 m−3, respectively). Hydrogen production rates (0.07 m3 d−1 m−3 and 0.09 m3 d−1 m−3) were achieved by using maltose and cellobiose, respectively. Hu et al. [Citation14] reported higher hydrogen production rates by using larger volume of MECs, possibly because of the difference in MEC configuration.[Citation14] Accumulation of carbon dioxide was higher in hexose and pentose sugars, when compared to disaccharides. The anaerobic oxidation of hexoses and pentoses to CO2 is shown in the following equations:
(2)
(2)
(3)
(3)
An example of fermentation of hexoses to acetic acid is given in the following equation:
(4)
(4)
The methanogenesis in micro-organisms is a type of anaerobic respiration, and the reaction can be written as follows:
(5)
(5)
Inhibiting methanogens in culture using CES resulted in the accumulation of CO2, when hexose and pentose sugars were used as substrates. These results indicated that the fermentation outcompeted the hydrogen production in the presence of hexoses and pentoses, when the methanogenesis is suppressed, while hydrogen production is preferred in the presence of disaccharides. The possible reason for the higher amount of H2 production from cellobiose in comparison to glucose might be found in the microbial consortium, which needs further examination.
Conclusions
The present results showed that hydrogen was produced from all of the examined carbon sources, including monosaccharides (glucose, galactose, mannose, xylose and arabinose) and disaccharides (maltose, saccharose and cellobiose).The gases, including hydrogen and carbon dioxide, were generated at lower concentrations of carbohydrates, whereas hydrogen was produced at higher amounts when using disaccharides. Our results showed that carbohydrates, such as maltose and cellobiose, are suitable carbon sources for the production of hydrogen, when methanogens are suppressed. Methanogenesis can be inhibited by using anaerobic enrichment techniques under experimental conditions. In conclusion, lignocellulosic biomass containing the examined carbohydrates could be used for the production of renewable hydrogen generation in MECs.
Disclosure statement
No potential conflict of interest was reported by the authors
Additional information
Funding
References
- Sun R, Zhou A, Jia J, et al. Characterization of methane production and microbial community shifts during waste activated sludge degradation in microbial electrolysis cells. Bioresour Technol. 2015;175:68–74.
- Zhang Y, Angelidaki I. Microbial electrolysis cells turning to be versatile technology: recent advances and future challenges. Water Res. 2014;56:11–25.
- Escapa A, San-Martín MI, Mateos R, et al. Scaling-up of membraneless microbial electrolysis cells (MECs) for domestic wastewater treatment: Bottlenecks and limitations. Bioresour Technol. 2015;180:72–78.
- Cai J, Wu W, Liu R. An overview of distributed activation energy model and its application in the pyrolysis of lignocellulosic biomass. Renew Sustain Energy Rev. 2014;36:236–246.
- Yue Z, Li W, Yu H. Application of rumen microorganisms for anaerobic bioconversion of lignocellulosic biomass. Bioresour Technol. 2013;128:738–744.
- Kotarska K, Świerczyńska A, Dziemianowicz W. Study on the decomposition of lignocellulosic biomass and subjecting it to alcoholic fermentation: study on the decomposition of lignocellulosic biomass lignocellulosic biomass. Renew Energy. 2015;75:389–394.
- Zheng Y, Zhao J, Xu F, et al. Pretreatment of lignocellulosic biomass for enhanced biogas production. Prog Energy Combust Sci. 2014;42:35–53.
- Kadier A, Simayi Y, Kalil MS, et al. A review of the substrates used in microbial electrolysis cells (MECs) for producing sustainable and clean hydrogen gas. Renew Energy. 2014;71:466–472.
- Xu F, Wang Z, Li Y. Predicting the methane yield of lignocellulosic biomass in mesophilic solid-state anaerobic digestion based on feedstock characteristics and process parameters. Bioresour Technol. 2014;173:168–176.
- Ren N, Wang A, Cao G, et al. Bioconversion of predicting the methane yield of lignocellulosic biomass to hydrogen: Potential and challenges. Biotechnol Adv. 2009;27:1051–1060.
- Jönsson LJ, Alriksson B, Nilvebrant N. Bioconversion of lignocellulose: inhibitors and detoxification. Biotechnol Biofuels. 2013;6:16.
- Catal T, Lesnik KL, Liu H. Suppression of methanogenesis for hydrogen production in single-chamber microbial electrolysis cells using various antibiotics. Bioresour Technol. 2015;187:77–83.
- Lovley DR, Phillips EJP. Novel mode of microbial energy metabolism: organic carbon oxidation coupled to dissimilatory reduction of iron or manganese. Appl Environ Microbiol. 1988;54:1472–1480.
- Hu H, Fan Y, Liu H. Hydrogen production using single-chamber membrane-free microbial electrolysis cells. Water Res. 2008;42:4172–4178.
- Catal T, Li K, Bermek H, et al. Electricity production from twelve monosaccharides using microbial fuel cells. J Power Sources. 2008;175:196–200.
- Kabir MM, Niklasson C, Taherzadeh MJ, et al. Biogas production from lignocelluloses by N-methylmorpholine-N-oxide (NMMO) pretreatment: effects of recovery and reuse of NMMO. Bioresour Technol. 2014;161:446–450.
- Kim I, Seo YH, Kim G, et al. Co-production of bioethanol and biodiesel from corn stover pretreated with nitric acid. Fuel. 2015;143:285–289.
- Lalaurette E, Thammannagowda S, Mohagheghi A, et al. Hydrogen production from cellulose in a two-stage process combining fermentation and electrohydrogenesis. Int J Hydrogen Energy. 2009;34:6201–6210.