
 ?Mathematical formulae have been encoded as MathML and are displayed in this HTML version using MathJax in order to improve their display. Uncheck the box to turn MathJax off. This feature requires Javascript. Click on a formula to zoom.
ABSTRACT
In this study the effect of trace elements on methanogenesis was investigated during mixed anaerobic fermentation using a single-factor experiment in the present study. The most effective concentrations of Fe0, Fe2+, Co2+ and Ni2+ that were added were 1500, 250, 0.3 and 0.6 mg/L, respectively. The optimal trace element combination was 0.58 mg/L Ni2+, 1200 mg/L Fe0 and 0.34 mg/L Co2+ by the ternary quadratic general rotary unitized design method. The degree of influence exerted by trace elements on the cumulative methane yields decreased in the order of Ni2+, Fe0 and Co2+, and the maximum CH4 yield was 241.6 mL/g volatile solids (VS), according to a regression equation. The non-dissolved organic carbon hydrolytic process showed a good fit with the first-order kinetic model. The maximum value of CH4 was 312.87 mL/g VS. Compared to the control, the bioconversion efficiencies of CH4 and CO2 production increased by 36.76% and 74.50%, respectively, at the optimal trace element combination. The obtained results provide new knowledge for improvements in the efficiency of anaerobic fermentation biogas production.
Introduction
With rapidly growing populations and economies, energy sources have been decreasing dramatically, and large amounts of animal dung and crop straw have been produced.[Citation1–4] Therefore, human beings are challenged by the energy pinch and by the environmental contamination. As is known, animal dung and crop straw could be used as energy sources. Consequently, many researchers have paid much attention to resource recovery, which is the key for easing energy problems and solving environmental problems simultaneously.[Citation5] Some of the disposal methods for animal dung and crop straw treatment are straw biogasification technology, aerobic composting technology and biohydrogen production.[Citation6–11] There are some disadvantages with these methods. Straw biogasification leads to the production of solid impurities, such as dust particles, and biogas impurities, such as sulphur, nitrogen and chlorine compounds, which could result in secondary pollution.[Citation12] Aerobic composting technology is very poor with regard to sanitary conditions and requires meticulous attention to key parameters.[Citation13] Low hydrogen yield heavily constricts the use of biohydrogen production.[Citation14] Hence, the large amount of work is done to develop new ideas for animal dung and crop straw utilization. Generally, animal dung is considered to be an excellent co-substrate because of its high nitrogen content and its wide range of nutrients, which are needed by methanogens. Furthermore, anaerobic fermentation biogas production is an efficient path for biomass regeneration for various applications, such as cooking with biogas, providing energy for cars and generating power for electricity. Thus, the co-fermentation of animal dung with crop straw seems to be promising, and anaerobic fermentation methanogenesis has attracted extensive attention worldwide.[Citation15–18]
However, the use of anaerobic fermentation processes for methane production has been demonstrated to be quite complex. Biogas production is affected by pretreatment methods used for dung and straw and by temperature, the ratio of carbon to nitrogen, and trace elements.[Citation19] Furthermore, it has been shown that trace elements are also essential nutrients for micro-organism activity [Citation20,Citation21] and for the structure of enzymes, such as methyl-coenzyme M reductase and the coenzyme M methyltransferase complex.[Citation22–24] In addition, some trace elements could promote anaerobic fermentation methane production, the loading of the system and the conversion rate of wastes.[Citation25–27] However, the reports published to date primarily concentrate on investigating the effect of a single element on fermentation. Also, the kinetics related to substrate hydrolysis are essentially absent from these reports.
Based on the co-fermentation of cow dung (CD) and corn straw (CS), the aims of this study were: (Equation1(1)
(1) ) to optimize the concentrations of Fe0, Fe2+, Co2+ and Ni2+ added in the system, using a single-factor experiment and obtain the effect order of Ni2+, Fe0, Co2+ and the effect of the optimal combination of trace elements on the biogas production characteristics by introducing the ternary quadratic general rotary unitized design method; (Equation2
(2)
(2) ) to reflect the non-dissolved organic carbon (NDOC) hydrolysis process by hydrolysis kinetics; (3) to investigate the effect of the optimal combination on volatile fatty acid (VFA) concentrations in fermentation biogas slurry; and (4) to discuss the effect of the optimal combination on daily biogas yields. The results will provide technical support for improving the efficiency of anaerobic fermentation biogas production.
Materials and methods
Substrates and seed sludge used for anaerobic fermentation processes
The CD was collected from a dairy farm at the Hebei University of Science and Technology . The CD was collected 10 h prior to use in batch experiments. The CS was collected from Nanli farmland. The dried straw was ground into particles of less than 0.5 mm. The granule sludge (GS), which was used as the inoculum, was obtained from an anaerobic reactor from the Ningjin starch wastewater treatment plants. Iron powder, FeSO4·7H2O, CoCl2·6H2O and NiCl2·6H2O were all analytical grade and purchased from Tianjin Chemical Ltd (Tianjin Chemical Ltd, Tianjin, China).
Experimental set-up and procedures
Mixed anaerobic fermentation experiments were carried out using conical flasks (150 mL) and graduated cylinders (250 mL), which were used as fermentation flasks and biogas extractors, respectively. Biogas was collected using the water displacement method. Conical flasks were sealed by rubber plugs, in which the pH was recorded using a pH electrode. The concentrations of each trace element were recorded at the beginning of the tests. Biogas volumes and their composition were monitored daily. Three parallel experiments were conducted. All of the parameters were taken as averages.
Mixed anaerobic fermentation with Fe0, Fe2+, Co2+ and Ni2+
According to some reports, [Citation28–31] the best initial conditions for mixed anaerobic fermentative biogas production are total solids (TS) 8%, C/N 26 and inoculum 25%. The contents of TS, C and N in CD, CS and inoculum could be measured. Based on our previous study, the optimal loading rate (i.e. volatile solids (VS) per unit of reactor volume) was 46.67 g/L, the optimal proportion of CD and CS was 5:1(VS), the optimal volume of inoculum was 533.33 mL/L, and the optimal particle size of the CS was less than 0.5 mm. Therefore, 30.02 g CD, 2.85 g CS, 80 mL inoculum and 37.2 mL water were mixed evenly after calculations, and different trace elements, namely, Fe0 (0, 100, 500, 1000, 1500 and 3000 mg/L), Fe2+ (0, 10, 100, 250, 500 and 1000 mg/L), Co2+ (0, 0.06, 0.3, 0.6 and 3 mg/L) and Ni2+ (0, 0.06, 0.6, 3, and 6 mg/L) were added. The mixtures were sealed into the 150 mL conical flasks, which were placed in a water bath to maintain a constant temperature (38 ± 1 °C).
Rao et al. [Citation32] demonstrated that the biogas production curve corresponds to a slower flat curve when complex solid organic materials are used as substrates. Hence, apart from the cumulative methane yield and methane production rate constant, the lag phase (λ) is also an important factor used to reflect the efficiency of anaerobic digestion. The lag phase can be calculated using the modified Gompertz model, which is a typical ‘S’ style curve equation, as follows [Citation33,Citation34]:
(1)
(1) where M(t) is the cumulative methane yield at time t (mL/g VS), Pm is the methane potential maximum production (mL/g VS), Rm is the maximum methane production rate (mL/(g VS·d)), λ is the lag phase (d), t is the duration of the assay (d) and e is exp(1) = 2.7183.
Optimization of the Ni2+, Fe0 and Co2+ concentrations by the ternary quadratic general rotary unitized design method
The ternary quadratic general rotary unitized design was used to investigate the cooperative effect of Ni2+, Fe0 and Co2+ on fermentation. The concentrations of Ni2+ (X1), Fe0 (X2) and Co2+ (X3) were chosen as investigated factors, and the cumulative methane yield per unit mass material (VS) was chosen as the dependent variable (Y). The table of coded factors and levels is shown in
Table 1. Coding table of experimental factors and levels.
Verification experiments
To investigate the effect of trace elements on the hydrolysis, acidification and methanation of the substrates, further verification tests with the optimal combination were conducted. Two sets of parallel experiments were carried out. One was for biogas yield and biogas composition measurement, and another was used for VFAs measurement by taking samples of 3 mL of slurry at 1, 2, 5, 10, 16 and 30 days. Similarly, the controls were set up without trace elements.
The carbon element (mg/L) was from CD, CS and GS at the beginning of fermentation and comprised CH4, CO2, organic carbon and inorganic carbon in the biogas slurry and total organic carbon (TOC) in the non-dissolved solids at the end of fermentation. Hence, the NDOC (mg/L) at time t could be calculated according to the carbon balance. The first-order kinetic model was used to describe the hydrolysis kinetics of NDOC. It was calculated as follows:
(2)
(2) where C0 is the NDOC concentration (mg/L), C is the NDOC concentration at time t (mg/L), K is the hydrolysis rate constant (d−1), t is the time (d) and a is a constant.
Analytical methods
TOC in the substrate was measured using the modified Tyurin method.[Citation35] The TS, VS, C and N were determined according to standard methods [Citation36].
The pH was determined using a pH meter (PHS-3C, Mettler, China). Biogas composition (CH4 and CO2) was determined using a gas chromatography (GC) system (GC-7890 Techcomp, China) equipped with a packed column (2 m × Ф3 mm) and a thermal conductivity detector. Argon was used as the carrier gas at a flow rate of 21 mL/min. The operating temperatures of the column, injector and detector were 40, 110 and 140 °C, respectively. Before the analysis, soluble metabolites were centrifuged at 10,000 r/min for 15 min and then acidified using formic acid and filtered through a 0.22 μm membrane. The alcohols and VFA concentrations in the solution were also analyzed by a biogas chromatography unit (GC-7900 Techcomp, China) using a flame ionization detector equipped with a capillary column (Agilent DB-FFAP, 30 m × 0.25 mm × 0.25 μm). The temperatures of the column, oven and detector were 118, 220 and 240 °C, respectively. The carrier gas was nitrogen at a flow rate of 1.1 mL/min and a split ratio of 10:1. The TOC in the biogas slurry was measured using a TOC analyzer (TOC-Vcpn, Shimadzu, Japan). The dissolved iron, cobalt and nickel were measured by flame atomic absorption spectrometry (AA-680, Shimadzu, Japan).
Data analysis
Data presented in figures are mean values with standard deviation from three independent experiments. Statistical analysis was carried out using the Origin 8.5.1 software. The cumulative methane yields in a single-factor experiment were fitted using the modified Gompertz model, using the Curve Expert (version 1.4) software. The optimization of trace element concentrations using the ternary quadratic general rotary unitized design method was performed using the Design Expert (version 8.0) software. Statistical significance was established at a P-value less than 0.05. The first-order kinetic model for describing the hydrolysis kinetics of NDOC was obtained by the Origin 8.5.1 software.
Results and discussion
Effect and kinetics of trace elements on mixed anaerobic fermentation
The effect of different Fe0, Fe2+, Co2+ and Ni2+ concentrations on mixed anaerobic fermentation was studied and the modified Gompertz model was used to predict the cumulative methane yields and obtain the lag times.
Effect of trace elements on biogas production and dissolved trace elements in biogas slurry
The effect of different Fe0, Fe2+, Co2+ and Ni2+ concentrations on mixed anaerobic fermentation is illustrated in . Each batch test was conducted over a period of 30 days.
Figure 1. Effect of Fe0 (A), Fe2+ (B), Co2+ (C) and Ni2+ (D) concentrations on average daily biogas yield and dissolved trace elements.
Fe is an electron carrier in enzymatic reactions and an activator that enhances enzyme activity. It is antagonistic towards the toxicants produced during the fermentation process. Fe has a vital function in microbial activities, and different amounts of iron are needed by various species of microflora. As shown in A), the average daily biogas yield exhibited an increase, followed by a decline, when Fe0 concentrations were increased from 0 to 3000 mg/L and reached the maximum (95 mL) when the Fe0 concentration was 1000 mg/L. The average daily methane content variation was the same as that of the average daily biogas yield, and the methane content reached a peak (56%) when the Fe0 concentration was 1500 mg/L (data not shown).
Therefore, low Fe0 concentrations that are too low would decrease the activity of the fermentation community, and an excessively high concentration is toxic to the micro-organisms, leading to less biogas production. Consequently, the optimal Fe0 concentration range was from 1000 to 1500 mg/L.
The dissolved iron concentration in the biogas slurry was investigated after fermentation. It increased first, then slightly decreased and finally increased sharply with the increase in Fe0 concentration from 0 to 3000 mg/L. There was 0.7 mg/L dissolved iron in the biogas slurry without Fe0, which most likely resulted from residual metal additives in the cattle feeds. When Fe0 concentrations were 500, 1000 and 1500 mg/L, the content of dissolved iron showed little difference (<1.3 mg/L). This result could be due to microbial utilization, iron salt precipitation, metal chelating and Fe0 deposition, which lead to stable dissolved iron concentrations. Dissolved iron still existed, although some sediment had been generated when 3000 mg/L Fe0 was added.
The effect of the Fe2+ concentration on the average daily biogas yield is shown in B). The results showed that the average daily biogas yield first increased and then decreased depending on the Fe2+ concentration. In addition, the peak value (93 mL) was achieved when the Fe2+ concentration was 250 mg/L. The average daily methane content reached a maximum when the Fe2+ concentration was 500 mg/L (data not shown). Consequently, 250–500 mg/L was determined to be the optimum concentration range. B) also illustrates that the dissolved iron concentration increased gradually in a Fe2+ concentration-dependent manner. In the system with 100 mg/L Fe2+, the percentage of dissolved iron increased from 3.8% to 21.9%, compared to that in the 100 mg/L Fe0 system, indicating that higher solubility was obtained with less Fe2+.
As is known, there is 0.075 mg Co (0.075 mg Co/g dry cell weight) in 1 g dry cell weight of methanogens,[Citation37] and Co plays an important role in micro-organisms. C) illustrates that the average daily biogas yield first increased and then decreased when the Co2+ concentration increased from 0 to 3 mg/L. It reached its peak value (94 mL) when the Co2+ concentration was 0.3 mg/L. The maximum average daily methane percentage of 56% was obtained at the Co2+ concentration of 0.06 mg/L (data not shown). Too little or excess Co2+ would reduce micro-organism activity. Hence, the optimal Co2+ concentration range was determined to be 0.06–0.3 mg/L. Dissolved cobalt concentrations in the biogas slurry increased with increasing Co2+ concentrations. It should be noted that 0.3 mg/L dissolved cobalt was detected even without any Co2+ addition.
When the Ni2+ concentration increased from 0 to 0.6 mg/L, the average daily biogas yield was on the increase, reaching a plateau in the range of 0.6–6 mg/L Ni2+. The maximum value (98 mL) appeared when the Ni2+ concentration was 0.6 mg/L (D)). The maximum average daily methane percentage of 56% was obtained at the Ni2+ concentration of 0.06 mg/L (data not shown). Hassan et al. [Citation38] also reported that small amounts of nickel in the medium-enhanced biogas and methane production, both of which decreased at higher Ni2+ concentrations. Therefore, in our study, the optimal Ni2+ concentration was determined to be in the range of 0.06–0.6 mL. D) shows that the dissolved nickel concentration in the biogas slurry increased parallel to the increase in Ni2+ concentration. In comparison, 0.4 mg/L dissolved nickel was detected in the control (without the addition of Ni2+). A possible explanation could be the heavy metal additives in the cattle feed. For example, 0.48 mg/L dissolved nickel was detected in the variant in which 0.6 mg/L of Ni2+ was added. Ashley et al. [Citation39] demonstrated that the methane bacteria activity is restrained in the presence of more than 1 mg/L Ni2+ during sludge anaerobic fermentation. However, Takashima and Speece [Citation40] found that the optimum Ni2+ concentration range was from 0.012 to 5 mg/L, in batch-mode experiments.
Modified Gompertz model
During the mixed anaerobic fermentations with different Fe0, Fe2+, Co2+ and Ni2+ concentrations, the cumulative methane yields were calculated. Compared with the control, moderate concentrations of trace elements were beneficial to methane production. According to EquationEquation (1)(1)
(1) , the maximum values of 181.76, 164.32, 166.19 and 178.04 mL/g VS (increases of 29.58%, 17.07%, 16.05% and 35.56% compared with the control) correspond to the addition of 1500 mg/L Fe0, 250 mg/L Fe2+, 0.3 mg/L Co2+ and 0.6 mg/L Ni2+, respectively. There were small discrepancies in cumulative methane production between the theoretical values in the modified Gompertz model and the experimental values. The lag times were 1.39, 1.06, 2.01 and 1.06 days, compared with the control (3.04 days). Thus, the lag time was obviously affected by the trace elements.
Optimization of trace element concentrations using the ternary quadratic general rotary unitized design method
The ternary quadratic general rotary unitized design method was used to investigate the effect of Ni2+, Fe0 and Co2+ concentrations on anaerobic fermentation methane production and to obtain the optimal combination, where cumulative methane production (per gram VS) was used as the response value, and the concentrations of Ni2+ (X1), Fe0 (X2) and Co2+ (X3) were chosen as variables. The results of the ternary quadratic general rotary combination design are shown in , and the variance analysis is shown in .
Table 2. Optimization of ternary quadratic general rotary unitized design experiments.
Table 3. Variance analysis of the results shown in 2.
From , there are a total of 20 experimental points. The zero point was repeated six times to estimate the error. The regression equation at the 0.05 significant level is
F2 was greater than F0.05 (9, 5) = 4.77, and P = 0.0429 < 0.05 (), indicating that F2 was significant at the 0.05 level and the regression of quadratic equation was significant. The lack of fit (F1) was smaller than F0.05 (5, 5) = 5.05, indicating that F1 was insignificant at the 0.05 level (i.e. there is no significant difference, because P < 0.05). Therefore, the model fitted well with the actual experiment.
The P values were used as a tool to check the significance of each factor. The result showed that the effects of Ni2+, Fe0 and Co2+ concentrations on the cumulative methane production were highly significant (P < 0.01). The effects of the interaction between Ni2+ and Fe0 concentrations and that between Fe0 and Co2+ concentrations on the cumulative methane production were also significant (P < 0.05). The coefficient of the equation showed that the effect order of the factors was X1 > X2 > X3, in other words Ni2+ > Fe0 > Co2+. The optimal trace element combination was determined to be 0.58 mg/L Ni2+, 1200 mg/L Fe0 and 0.34 mg/L Co2+, according to the regression equation.
Hydrolysis kinetics of non-dissolved organic carbon
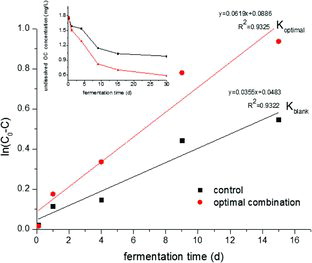
Anaerobic fermentation was investigated using the optimal trace element combination, and the NDOC in the system and the control both showed a good fit with first-order kinetics (). The NDOC concentration was calculated using the carbon conversion principle, and the variation is given in the inset. Two values for R2 were greater than 0.93, demonstrating that the model is consistent with the hydrolytic process of NDOC in the anaerobic fermentation. The hydrolysis rate constant with the optimal combination was greater than the control (Koptimal = 1.74 Kcontrol); therefore, the hydrolytic process in 1–15 days could be considered to be mainly accelerated by the studied trace elements.
Figure 2. First-order kinetics model for NDOC in fermentation process with optimal trace elements combination. Inset: NDOC concentration change curves with time.
Effect of the optimal combination on VFA concentrations and biogas production
Effect of the optimal combination on VFA concentrations in the biogas slurry
As shown in , the effect of the optimal trace element combination on the overall trend of VFA concentration change was not considerable when compared with the control, although at some time points there were certain variations in the VFA concentrations. Acetic acid and butyric acid concentrations both decreased dramatically in the first two days and then remained below 100 mg/L (A) and 3(B)). However, the propionic acid concentration was influenced tremendously and accumulated to 501 mg/L in the control, while it was consumed to a concentration of less than 40 mg/L in the first five days with the optimal combination (C)). It is speculated that propionic acid metabolism or fermentation types could be accelerated or changed by moderate trace elements; thus, acid production (mostly propionic acid) could be avoided. The variation in the total VFA (acetic acid, butyric acid and propionic acid) concentration was provided by converting it into COD in D). The concentration was lower than the control in the first 10 days, indicating that trace elements were beneficial to the fermentation.
Figure 3. Effect of optimal trace elements combination on VFA concentrations in fermentation biogas slurry: acetic acid (A); butyric acid (B); propionic acid (C); VFAs concentration by converting into COD (D).
Effect of optimal combination on biogas production
shows that the daily biogas yields present both decreased gradually in the system of the optimal combination and the control. The daily biogas yield for the optimal combination was greater than the control during the entire fermentation cycle. Therefore, it can be speculated that the methanation stage could be accelerated in the first 15 days with the optimum combination, and hydrolysis became the limited stage in the last 15 days, with VFA concentrations decreasing.
Figure 4. Effect of the optimal trace elements combination on daily biogas yields.
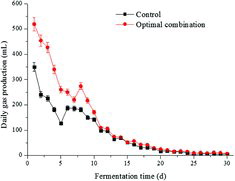
Methane (CH4) content rapidly increased to over 60% from the first day to the seventh day and then remained stable at 60%–68% for the control and the optimal combination. The CO2 content variations were similar to those of CH4. They rapidly increased to over 30% from the first day to the seventh day and then decreased to less than 15%.
The maximum cumulative methane yields were 312.87 mL/g VS in the optimal combination and 228.78 mL/g VS in the control. They were fitted by the modified Gompertz model in Curve Expert, and their correlation coefficients, R2, were all greater than 0.99, indicating that this model reflected the real methanogenic process well. The maximum methane production rate increased by 46.40%, the lag time was shortened by 0.24 days, i.e. the lag periods were 0.28 and 0.04 days in the optimal combination and the control (data not shown) and the fermentation cycle was shortened by 0.85 days.
The substrate utilization is reflected by the efficiency of CH4 bioconversion and CO2 bioconversion (the ratio of the actual and the theoretical). The theoretical yields of CH4 and CO2 could be calculated according to chemometrics.[Citation41]
As shown in , the maximum cumulative CH4 and CO2 yields increased by 36.76% and 74.54%, respectively, compared with the control. The efficiency of CH4 biotransformation and CO2 biotransformation increased by 36.76% and 74.50%, respectively. Therefore, the biotransformation biogas production efficiency of the fermentation substrate can be improved using moderate concentrations of trace elements.
Table 4. Effect of optimal combination on biogas production performance.
The results obtained in this study are consistent with those of other authors. For example, Qiang et al. [Citation27] also found that Fe, Co and Ni could enhance the fermentation of food waste. Ma et al. [Citation42] studied the effect of Fe2+ concentration on some enzyme activities during methane production from blue-green algae by anaerobic digestion and the total methane yield reached 986.7 mL with 3 mg/L Fe2+ added, which was 43 times of the control.
Since microbial populations are known to be an important factor in anaerobic fermentative biogas production, future research should focus on the microbial populations as an object of impact. Manure and the GS in the bioreactor after perennial fermentation could both be used as an inoculum. As there are much more bacteria in manure, using an inoculum from manure will also be considered in future research.
Conclusions
This study investigated the influence of trace elements on biogas production, using a single-factor experiment. The optimal concentrations for Fe0, Fe2+, Co2+ and Ni2+ alone were 1500, 250, 0.3 and 0.6 mg/L, respectively. In addition, the ternary quadratic general rotary unitized design method was used to investigate the effect of the Ni2+, Fe0 and Co2+ concentrations on anaerobic fermentation methane production, and the optimal trace elements combination was 0.58 mg/L Ni2+, 1200 mg/L Fe0 and 0.34 mg/L Co2+. The result showed that the effect order of the factors was Ni2+ > Fe0 > Co2+. The hydrolytic process of the NDOC showed a good fit with a first-order kinetic model, and the hydrolysis rate constant with the optimal trace element combination was 1.74 times that of the control (from 1st to 15th day). The maximum CH4 yield of 312.87 mL/g VS was achieved under optimal conditions. Biotransformation biogas production efficiency of a fermentation substrate can be improved using moderate concentrations of trace elements.
Acknowledgements
Therefore, this study could provide theoretical support for anaerobic fermentation biogas production.
Dısclosure statement
No potential conflict of interest was reported by the authors.
Additional information
Funding
References
- Dorado AD, Husni S, Pascual G, et al. Inventory and treatment of compost maturation emissions in a municipal solid waste treatment facility. Waste Manage. 2014;34:344–351.
- Maier S, Oliveira LB. Economic feasibility of energy recovery from solid waste in the light of Brazil's waste policy: the case of Rio de Janeiro. Renew Sustainable Energy Rev. 2014;35:484–498.
- Wani KA, Mamta, Rao RJ. Bioconversion of garden waste, kitchen waste and cow dung into value-added products using earthworm Eisenia fetida. Saudi J Biol Sci. 2013;20:149–154.
- Ro KS, Hunt PG, Jackson MA, et al. Co-pyrolysis of swine manure with agricultural plastic waste: laboratory-scale study. Waste Manage. 2014;34:1520–1528.
- Xie S, Lawlor PG, Frost JP, et al. Effect of pig manure to grass silage ratio on methane production in batch anaerobic co-digestion of pig manure and grass silage. Bioresour Technol. 2011;102:5728–5733.
- Chiang KY, Lin YX, Lu CH, et al. Gasification of rice straw in an updraft gasifier using water purification sludge containing Fe/Mn as a catalyst. Int J Hydrogen Energy. 2013;38:12318–12324.
- Calvo LF, Gil MV, Otero M, et al. Gasification of rice straw in a fluidized-bed gasifier for syngas application in close-coupled boiler-gasifier systems. Bioresour Technol. 2012;109:206–214.
- Külcü R, Yaldiz O. The composting of agricultural wastes and the new parameter for the assessment of the process. Ecol Eng. 2014;69:220–225.
- Bhamidimarri SMR, Pandey SP. Aerobic thermophilic composting of piggery solid wastes. Water Sci Technol. 1996;33:89–94.
- Petric I, Helić A, Avdić EA. Evolution of process parameters and determination of kinetics for co-composting of organic fraction of municipal solid waste with poultry manure. Bioresour Technol. 2012;117:107–116.
- Liu CM, Wu SY, Chu CY, et al. Biohydrogen production from rice straw hydrolyzate in a continuously external circulating bioreactor. Int J Hydrogen Energy. 2014;39:19317–19322.
- Šulc J, Štojdl J, Richter M, et al. Biomass waste gasification – can be the two stage process suitable for tar reduction and power generation? Waste Manage. 2012;32:692–700.
- Kopčić N, Domanovac MV, Kučić D, et al. Evaluation of laboratory-scale in-vessel co-composting of tobacco and apple waste. Waste Manage. 2014;34:323–328.
- Xia A, Cheng J, Ding LK, et al. Enhancement of energy production efficiency from mixed biomass of Chlorella pyrenoidosa and cassava starch through combined hydrogen fermentation and methanogenesis. Appl Energy. 2014;120:23–30.
- Corro G, Paniagua L, Pal U, et al. Generation of biogas from coffee-pulp and cow-dung co-digestion: infrared studies of postcombustion emissions. Energy Convers Manage. 2013;74:471–481.
- Fantozzi F, Buratti C. Biogas production from different substrates in an experimental continuously stirred tank reactor anaerobic digester. Bioresour Technol. 2009;100:5783–5789.
- Li YQ, Zhang RH, He YF, et al. Anaerobic co-digestion of chicken manure and corn stover in batch and continuously stirred tank reactor (CSTR). Bioresour Technol. 2014;156:342–347.
- Yusuf MOL, Ify NL. The effect of waste paper on the kinetics of biogas yield from the co-digestion of cow dung and water hyacinth. Biomass Bioenergy. 2011;35:1345–1351.
- Nachaiyasit S, Stuckey DC. Effect of low temperatures on the performance of an anaerobic baffled reactor (ABR). J Chem Technol Biot. 1997;69:276–280.
- Takashima M, Speece RE. Mineral nutrient requirements for high-rate methane fermentation of acetate at low SRT. J Water Pollut Control Fed. 1989;61:1645–1650.
- Goodwin JAS, Wase DAJ, Forster CF. Effects of nutrient limitation on the anaerobic upflow sludge blanket reactor. Enzyme Microb Tech. 1990;12:877–884.
- Diekert G, Konheiser U, Piechulla K, et al. Nickel requirement and factor F430 content of methanogenic bacteria. J Bacteriol. 1981;148:459–464.
- Thauer RK. Biochemistry of methanogenesis: a tribute to Marjory Stephenson. Microbiology. 1998;144:2377–2406.
- Thauer RK, Kaster AK, Goenrich M, et al. Hydrogenases from methanogenic archaea, nickel, a novel cofactor, and H2 storage. Annu Rev Bioche. 2010;79:507–536.
- Pobeheim H, Munk B, Lindorfer H, et al. Impact of nickel and cobalt on biogas production and process stability during semi-continuous anaerobic fermentation of a model substrate for maize silage. Water Res. 2011;45:781–787.
- Gustavsson J, Yekta SS, Sundberg C, et al. Bioavailability of cobalt and nickel during anaerobic digestion of sulfur-rich stillage for biogas formation. Appl Energy. 2013;112:473–477.
- Qiang H, Lang D, Li Y. High-solid mesophilic methane fermentation of food waste with an emphasis on iron, cobalt, and nickel requirements. Bioresour Technol. 2012; 103:21–27.
- Pang XP, Niu MF, Wang SY, et al. Anaerobic fermentation conditions of mixed corn straw and pig excreta in North China. Chin J Ecol. 2011;30(1):126–130.
- Zhang ZH, Hu SB, Ma W, et al. Experiment on co-fermentation and anaerobic fermentation of livestock manure and wheat straw. Agr Res Arid Areas. 2010;28(6):87–90.
- Zhang CL, Li YB, Bu DS, et al. Biogas yield and its relations with the duration and temperature of mixed anaerobic fermentation of livestock dungs and wheat straw. Chin J Appl Eco. 2008;19(8):1817–1822.
- Liu DJ. Experiment on biogas fermentation with different proportion of corn straw mixed with cow dung. China Biogas. 2009;27(4):13–15.
- Rao M, Singh S, Singh A, et al. Bioenergy conversion studies of the organic fraction of MSW: assessment of ultimate bioenergy production potential of municipal garbage. Appl Energy. 2000;66:75–87.
- Kafle GK, Kim SH. Anaerobic treatment of apple waste with swine manure for biogas production, batch and continuous operation. Appl Energy. 2013;103:61–72.
- Kafle GK, Kim SH, Sung KI. Ensiling of fish industry waste for biogas production, a lab scale evaluation of biochemical methane potential (BMP) and kinetics. Bioresour Technol. 2013;127:326–336.
- Institute of Soil Science, Chinese Academy of Sciences. Soil physicochemical properties analysis. 1st ed. China: Institute of Soil Science; 1978.
- American Public Health Association. Standard methods for the examination of water and wastewater. Washington (DC): Public Health Association; 1995.
- Peng YZ, Zhang SJ, Wang SY. Heavy-metal ions in the biological treatment of municipal landfill leachate. Tech Equip Environ Pollut Control. 2006;7(1):1–5.
- Hassan D, Tandon SM. Response of a cattle dung methane fermentation to nickel. Biol Waste. 1987;22(4):261–268.
- Ashley NV, Davies M, Hurst T. The effect of increased nickel ion concentrations on microbial populations in the anaerobic digestion of sewage sludge. Water Res. 1982;16(6):963–971.
- Takashima N, Speece RE. Mineral requirements for methane fermentation. Crit Rev Env Sci Technol. 1990;19(5):465–479.
- Heo NH, Park SC, Kang H. Effects of mixture ratio and hydraulic retention time on single-stage anaerobic co-digestion of food waste and waste activated sludge. J Environ Sci Health. 2004;39(7):1739–1756.
- Ma SL, Liu H, Yan Q. Effect of Fe2+ concentration on the enzymes during methane production from Taihu blue algae by anaerobic digestion. J Food Sci Biotechnol. 2011;30(2):306–310.