
ABSTRACT
Two maize populations (GE440 × Sd7 and NC300 × Gm1002) were used in this study. Molecular markers like simple sequence repeat (SSR) and sequence-tagged site (STS) were used to identify resistance genes linked to Fusarium ear rot (Fusarium verticillioides). Also, quantitative trait locus (QTL) mapping was used to detect resistance genes on maize chromosomes. The co-dominant microsatellite markers (bnlg1063, umc2082, bnlg1621, umc2013, bnlg1740, umc2059 and SSR85) and STS (STS06) were amplified polymorphic bands and candidate markers linked to Fusarium ear rot resistance genes in maize. Seven QTLs were identified ranging from 2 to 7 for each trait. QTLs were distributed on two chromosomes and associated with grain yield/main ear and 100 kernel weight. The present study indicated that microsatellite and STS primers might be useful for developing improved cultivars.
Introduction
Maize (Zea mays L.) is the third most important cereal crop in the world. Maize belongs to the grass family Poaceae; it is grown in every suitable agricultural region of the world. Maize is a diploid species with a chromosome number of 2n = 2X = 20, and it has a moderate genome size of about 2.400 Mb.[Citation1]
In Africa, maize is increasingly becoming an important non-traditional agricultural export crop. In addition to strong demand for maize as a food crop, the demand for maize is projected to rise with increasing population growth and an expanding need for livestock feed. Production of maize grain is insufficient relative to the needs for the food and feed consumption in many areas. Accordingly, increasing maize production is considered essential for food security in developing countries. In Egypt, the harvested area of maize was 1,041,345 ha and the production was 8.094 MT with an average yield of 7772.3 kg/ha.[Citation2]
Fusarium ear rot is one of the most important diseases of maize [Citation3], from economic importance view, it is responsible for severe yield losses.[Citation4] Fumonisin production is associated with mycotoxicoses of animals and human.[Citation5]
The ear rot is characterized by cottony mycelium growth that typically occurs on a few kernels. Typically, infection occurs close to ear tips and is commonly associated with damage and injury caused by ear bores. This ear rot and mould can result in monetary losses for seed producers and grain producers, as it will result in lower quality grain, but more concerning is that the ear rot indicates toxins called fumonisins and the contamination of produced grains with the mycotoxin fumonisin.[Citation6]
Microsatellites or simple sequence repeats (SSRs) are highly informative co-dominant markers composed of tandemly repeated nucleotide sequence flanked by unique sequences in the genome. Microsatellites are locus specific and evenly distributed along chromosomes.[Citation7]
The sequence-tagged site (STS) is a relatively short sequence which can be specifically amplified by polymerase chain reaction (PCR) and detected in the presence of all other genomic sequences and whose location in the genome is mapped. STS allows heterozygotes to be distinguished from the two homozygotes. Resistance to Fusarium ear rot found in maize is quantitative.[Citation8]
A quantitative trait locus (QTL) is the location of a gene or a cluster of genes affecting a trait that is measured on a quantitative scale. The goal of QTL mapping is to establish linkage between marker alleles. Linkage maps indicate the position and relative genetic distances between markers along chromosomes. One important use of linkage maps to identify chromosomal locations containing major genes and QTL associated with traits of interest.[Citation9]
QTL mapping of resistance to Fusarium ear rot in maize have been reported.[Citation10–16] Recently, a genome-wide association study to detect allele variants associated with increased resistance to Fusarium ear rot in maize core diversity panel of 267 inbred lines evaluated in two sets of environments.[Citation17]
The aim of this study was to identify SSR, STS and QTL mapping markers linked to Fusarium ear rot resistance genes in F2 population of maize.
Materials and methods
Plant materials and populations development
Two maize populations, white (GE440 × Sd7) and yellow (NC300 × Gm1002) were used in this study. The population were derived from the crosses of US lines GE440 and NC300, and inbred lines were obtained from Department of Crop Science, North Carolina State University, Raleigh, NC, USA. The GE440 is derived from the open-pollinated variety Hastings prolific,[Citation18] and it is resistant to Fusarium ear rot with poor agronomic characteristics, poor root lodging resistance and overall poor yield. The resistant inbred, NC300, is derived from the tropical hybrids pioneer X105A, pioneer X306B and H5.[Citation19]
The Egyptian maize lines (Sd7 and Gm1002) were obtained from Maize Research Department, Field Crop Research Institute, Agricultural Research Center, Egypt, and characterized by susceptible to Fusarium ear rot with a good agronomic quality.
Molecular marker experiments
Molecular marker study was performed on one population (NC300 × Gm1002) only. DNA was extracted according to Doyle and Doyle.[Citation20]
SSR analysis and PCR amplification
A set of seven microsatellite primers were used in this study and the sequences are shown in and were obtained from Pharmacia Biotech, HP79 NA, England. The sequences of these primers were obtained from maize GDB database (www.maizeegdb.com) [Citation21] which reported in previous works to be linked to Fusarium ear and stalk rots.
Table 1. List of the seven SSR-marker-generated polymorphism between the parents.
The SSR–PCR method was carried out, according to Röder et al.[Citation7] Amplification was performed in a thermal cycler (Thermolyne Ampitron) programmed for 1 cycle of 3 min at 94 °C and 45 cycles were performed with 1 min at 94 °C, 1 min 50–60 °C (depending on the individual microsatellite), 2 min at 72 °C and a final extension step of 10 min at 72 °C. All PCR products were resolved in 2.5% agarose in 1X TBE buffer. Images were recorded and photographed on gel documentation system (Dolphin-DOC, Wealtec, USA).
STS analysis and PCR amplification
One STS primer developed by Melchinger [Citation22] was used, because it was reported as linked to Fusarium stalk rot. PCR amplifications were performed in 25 µL reaction with 2.5 µL of 10X magnesium-free PCR buffer, 1.5 µL of magnesium chloride (25 m mol/L), 2.0 µL of dNTPs and 1 µL of each forward and reverse primer (100 pmol/µL) and 100 ng of DNA. Primer annealing temperatures varied from 57 to 59 °C depending on the primers. All PCR products were resolved in 3% agarose gel in 0.51X TBE buffer.
Bulked segregant analysis
Bulked segregant analysis (BSA) was used in conjunction with SSR and STS analyses [Citation23] to find markers linked to genes of interest. Resistant and susceptible bulks were prepared from F2 individuals by pooling aliquots containing 50 ng/µL from each of 14 susceptible and 14 resistant F2-selected plants. PCR was carried out on the bulks and parental DNA samples using SSR and STS primers as described above. Based on the evaluations of DNA bulks, individual F2 plants were tested to confirm a correlation with the Fusarium ear rot resistance alleles and analysed with co-segregating primes to confirm SSR and STS markers’ linkage to the Fusarium ear rot resistance genes.
Data and linkage analysis
Map manager QTX version 0.22 [Citation24] was used to analyse the linkage relationship of markers detected from bulked segregant analysis. The Kosambi's mapping function was used.
Results and discussion
The development of modern biotechnologies and their introduction into the selection process in the form of MAS technologies has promoted scientific and technical progress in the creation of varieties and hybrids that are resistant to sources of disease. The identification of markers makes it possible to subsequently achieve effective transfer of genes that control resistance to Fusarium rot into susceptible maize genotypes so as to create resistant genotypes and prevent losses.[Citation21] The precise determination of the genomic position of QTL and of their gene effects is still an area of extensive quantitative genetic and biometrical research.[Citation22] Based on the screening of polymorphism between resistance and susceptible parents of NC300 × Gm1002 and GE440 × Sd7 populations with seven SSR and one STS primers, population derived from NC300 × Gm1002 gave 15 polymorphic markers and population derived from GE440 × Sd7 gave 10 polymorphic markers. Seven SSR primers gave polymorphic bands suitable to differentiate between the two parents.
SSR markers analysis
SSR markers are currently considered as the molecular markers of choice and are rapidly being adapted by plant researchers for precise estimation of diversity. The reproducibility of microsatellites is such that they can be used efficiently by different research laboratories to produce consistent data.[Citation25]
Each of these seven markers was used to screen DNA bulks of the 10 resistant and the 10 susceptible F2 plants. SSR markers (bnlg1063, umc2082, bnlg1621, umc2013, bnlg1740, umc2059 and SSR85) were amplified polymorphic bands, and generated two polymorphic fragments. One fragment for resistant bulk and parent, and another polymorphic were present in susceptible bulk and parents (–).
Figure 1. Experimental validation of bn1g1063 SSR marker in 20 lanes in F2 cross individuals.
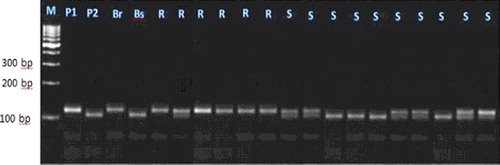
Figure 2. Experimental validation of bn1gumc2082 SSR marker in 20 lanes in F2 crosses individuals.
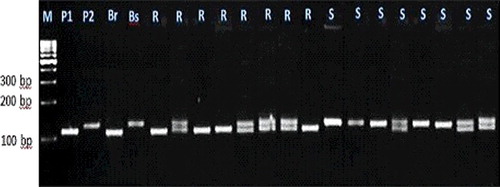
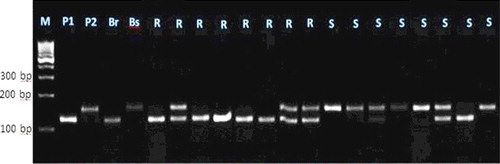
Figure 3. Experimental validation of bn1g1621 SSR marker in 20 lanes in F2 crosses individuals.
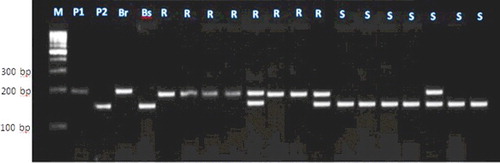
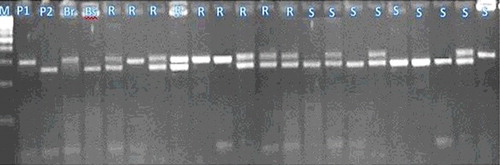
Figure 4. Experimental validation of umc2013 SSR marker in 20 lanes in F2 crosses individuals.
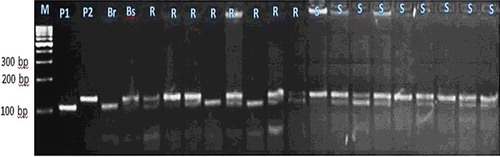
Figure 5. Experimental validation of bn1g1740 SSR marker in 20 lanes in F2 crosses individuals.
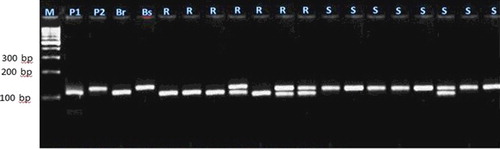
Figure 6. Experimental validation of umc2059 SSR marker in 20 lanes in F2 crosses individuals.
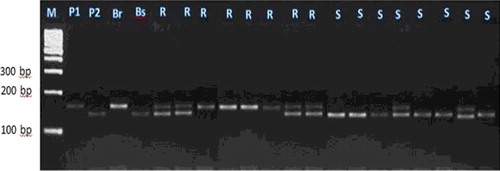
Figure 7. Experimental validation of SSR85 SSR marker in 20 lanes in F2 crosses individuals.
Li et al. [Citation15] detected 207 polymorphic SSR markers with average genetic distance of 8.83 centi-Morgan (cM). SSR-based molecular diversity analysis of 27 maize inbred lines had produced 23 polymorphic alleles from 10 markers with an average of 2.3 alleles per locus and mean polymorphic information content of 0.45.[Citation26]
For the markers bnlg1063, bn1g1621, and SSR85, alleles of the tolerant parent were larger than those in the sensitive parent. These loci were inherited in a Mendelian co-dominant manner. In contrast, for the markers umc2082, umc2013, bnlg1740 and umc2059, alleles from the resistant parent were smaller than those in the susceptible parent.
Molecular markers have proven to be a valuable tool for assessing the genetic diversity in many crop species. SSR markers are co-dominant, abundant, high polymorphic and dispersed throughout plant genome based on the survey across genomes. The average SSR density was one SSR every 15.48 kb. These may propose an advanced method for genetic differences existing among plant genomes at DNA level and also the differences involved in sequencing and procedures.[Citation27] This observation was similar to Nikhou et al. [Citation28] indicating that SSR are efficient markers to classify closely related lines. SSR markers were able to detect the extent of genetic diversity and to detect considerable level of genetic diversity among maize hybrids.
STS marker analysis
Only one primer STS06 generates two polymorphic fragments, one fragment of 300 bp was present in resistant bulk and resistant parent and another polymorphic fragment at 270 bp was present in susceptible bulk and in susceptible parent. The STS06 allele from the susceptible was smaller than from the resistant parent. This locus was inherited in a Mendelian co-dominant manner. There were clear co-segregations between the amplification of the smaller STS06 allele and the F2 plants showing the susceptible phenotypes. The co-dominant STS marker (STS06) was able to identify the heterozygotes. The segregation ratio was 1 (66 resistant homozygote: 2 (154 heterozygote): 1(60 susceptible homozygote) in the genotyping F2 plants. The ratio fitted the expected Mendalian ratio 1:2:1 ().
Table 2. Significant association between Fusarium ear rot resistance and markers (SSR and STS) in the 280 F2 plant population using Chi square (χ2) and simple regression (r2) analysis.
To check for potential co-segregation of DNA fragments and Fusarium ear rot resistance phenotypes, simple regression analysis was carried out in order to confirm an association between co-dominant STS marker and Fusarium ear rot resistance genes in F2 progenies This indicates that STS marker (STS06) was linked with Fusarium ear rot resistance genes ().
Figure 8. STS fragments produced by STS06.
The results showed that the regression analysis for the relationship between the presence of the marker, STS06, and Fusarium ear rot resistance phenotypes of F2 individuals was significant (P > 0.05) and they recorded r2 = 0.30 (). This indicates that the STS marker (STS06) was linked with Fusarium ear rot resistance genes.
The reproducibility of microsatellites is such that they can be used efficiently by different research laboratories to produce consistent data.[Citation25]
Mapping of QTLs for Fusarium ear rot resistance
The linkage relationship between the seven SSR markers (bnlg1063, umc2082, bnlg1621, umc2013, bnlg1740, umc2059 and SSR85), STS marker (STS06) and Fusarium ear rot resistance genes was estimated using the F2 population, deriving from the cross between NC300 ‘resistant parent’ and GM 1002 ‘susceptible parent’. The genetic distances between the seven SSR markers, STS marker (STS06) and Fusarium ear rot resistance genes were determined as 16.8, 20.7, 17.1, 26.7, 17.6, 26.9, 29.4 and 26.4 cM, respectively, with LOD scores of 36.4, 26.7, 33.7, 18.9, 33.2, 18.1, 13.5 and 16.5, respectively (; ). Therefore, SSR markers bnlg1063, umc2082, bnlg1621, umc2013, bnlg1740, umc2059 and SSR85 and STS marker (STS06) were linked to the QTL for Fusarium ear rot resistance genes and explained 24%, 23%, 26%, 17%, 32%, 16%, 17% and 13% of the total phenotypic variation, respectively.
Table 3. Genetic characteristics of QTL related to Fusarium ear rot resistance genes in the 280 F2 plants population.
Figure 9. SSR markers (bnlg1063, umc2082, bnlg1621, umc2013, bnlg1740, umc2059 and SSR85), STS marker (STS06) and QTL for Fusarium ear rot resistance genes were located through the MAPMAKER QTL analysis. All distances are given in centi-Morgan, using Kosambi's mapping function.
One-way ANOVA was carried out using marker genotypes as groups. The ANOVA on seven SSR markers and STS marker (STS06) and genotypes as groups for the Fusarium ear rot resistance established high and significant association between SSR markers and STS marker and phenotype (). The single-marker ANOVA analysis revealed that the bnlg1063-linked QTL, umc2082-linked QTL, bnlg1621-linked QTL, umc2013-linked QTL, bnlg1740-linked QTL, umc2059-linked QTL and SSR45-linked QTL accounted for 24%, 23%, 26%, 17%, 32%, 16%, 17% and 13% of the total phenotypic variation, respectively, in Fusarium ear rot resistance in the F2 population. In all of the detected QTLs, additive effects were negative. This indicates contribution of QTL alleles in these loci from the resistant parent NC300 (). This indicates the relative importance of additive gene effects in controlling Fusarium ear rot resistance in F2 population. Therefore, it will be feasible to transfer favoured alleles from both the parents to elite maize varieties as recurrent lines; hence the QTL mapping population will be very useful in transferring favoured alleles from both the parents by further backcrossing and marker-assisted breeding.
Table 4. Analysis of variance of Fusarium ear rot resistance of F2 progeny on seven SSR and STS markers.
The genetic distance between the eight markers (7 SSR + 1 STS) and Fusarium ear rot resistance genes were determined with LOD scores. Therefore, these markers were linked to QTL for Fusarium ear rot resistance genes. A total of seven QTLs were identified ranging from two to seven QTLs for each trait. Two QTLs (bins3.06 and 6.07) were putatively consistent QTL for 100 kernel weight (KW), grain yield/main ear and grain yield per plant traits (, ).
Table 5. Genetic characteristics of QTL related to agronomic traits of the 280 F2 plants derived from NC300 × GM1002 population using SSR and STS markers.
Zhao et al. [Citation29] showed that an integrated approach can be effective if sources of information complement each other. In their study on kernel weight, grain yield/main ear and grain yield per plant traits prediction accuracy could be increased significantly. Some unique results employed the molecular events involved in the establishment of resistance against Fusarium verticillioides in maize, which provided an important source of markers for the development of disease-resistant maize genotypes and may have relevance to study other pathosystems involving mycotoxin-producing fungi [Citation30].
In the present study, seven QTL regions that affected both Fusarium ear rot and 100 kernel weight (100 KW), two QTL regions affected both Fusarium ear rot and each of grain yield of the main ear by QTLs (), most of the QTLs identified for 100 KW, GYME and GYP had small (GYME) and grain yield per plant (GYP) were identified. QTLs for 100 KW were detected in chromosomes 3, 4, 5, 6, 10. QTLs on chromosomes 4 and 6 were linked to the three traits, and the two QTLs for GYME and GYP were located in similar regions on chromosomes 4 and 6 with the same LOD scores, indicate that markers linked to these regions could be used for MAS selection for both Fusarium ear rot and agronomic traits. A better understanding of the QTL that underlines these traits would provide new impetus and opportunities for more targeted selection programmes based on MAS of the relevant QTL.
Composite interval mapping identified by Fernando et al. [Citation31] shows a total of 15 QTLs were detected for maize weevil parameters which were located on six chromosomes, explaining between 14% and 51% of phenotypic variation and 27% and 81% of the genotypic variation. The QTL obtained for grain weight losses was located in bin2.05, which explained 15% of phenotypic variation. The ear rot resistance quantitative trait loci were analysed by composite interval mapping with a mixed model (MCIM) across the environment. Li et al. [Citation15]detected four QTLs on chromosomes 3, 4, 5 and 6. The resistance allele at each of these four QTLs wascontributed by the resistant parent BT-1 and accounted for 2.5%–10.2% of the phenotypic variation. Also, four QTLs on chromosomes 3, 4, 5 and 6 flanked by markers bn1g1621 were detected and bn1g1137 that identified five QTLs on chromosomes 3, 4, 7 and 9 under environmental condition,[Citation32] and Nikolic et al. [Citation33] detected QTL map under drought condition for yield components. Jambhulkar [Citation34] reported that one QTL was present on chromosome 1 located on marker MK13 for ear height character.
Genetic analysis and major QTL were detected for maize kernel size and weight in multi-environments.[Citation35] A further recent study by Zhang et al. [Citation36] proposed a method for increasing genome-based prediction accuracy by systematically exploiting the wealth of published QTL information through integration into the genomic relationship matrix.
Conclusion
The results showed that the regression analysis for the relationship between the SSR markers and the phenotypes of F2 maize population, evaluated under Fusarium ear rot severity for 100 KW, yield/main ear and grain yield per plant traits was highly significant .This indicates that the SSR markers were associated with the 100 KW. Grain yield/main ear and grain yield per plant traits as an indicator for Fusarium ear rot resistance genes were determined and ranged from 36.5 to 53.0 cM. Therefore, these SSR markers were linked to the QTL for the 100 KW, grain yield/main ear and grain yield per plant traits, as an indicator for Fusarium ear rot resistance genes.
Disclosure statement
No potential conflict of interest was reported by the authors.
Additional information
Funding
References
- Cai H., Maize. In: Kole C, editor. Genome mapping and molecular breeding in plants. Vol. 1, Cereals and millets. Berlin/Heidelberg: Springer-Verlag; 2006. p. 135–153.
- Food and Agriculture Organization of the United Nations. FAOSTAT database. Rome: FAO; 2014. Available from: http://faostat.Fao.org.
- Maschietto V, Lanubile A, Marocco A. Mapping candidate genes for Fusarium ear rot resistance. Maize Genet Coop Newslett. 2011;85:1–2.
- Costa RS, Môro FV, Môro JR, et al. Relationship between caryopsis morphological characteristics and Fusarium ear rot in corn. Pesq Agropec Bras. 2003;38(1):27–33.
- Richard JL. Some major mycotoxins and their mycotoxicoses – an overview. Int J Food Microbiol. 2007;119(1–2):3–10.
- Hung HJ, Holland B. Diallel analysis of resistance to Fusarium ear rot and fumonisin contamination in maize. Crop Sci. 2012;52(5):2173–2181.
- Röder MS, Korzum V, Wendehake KJ. A microsatellite map of wheat. Genetics. 1998;149:2007–2023.
- Clements MJ, Maragos CM, Pataky JK, et al. Sources of resistance to fumonisin accumulation in grain and Fusarium ear and kernel rot of corn. Phytopathology. 2004;94:251–260.
- Collard BCY, Jahufer MZZ, Brouwer JB, et al. An introduction to markers quantitative trait loci (QTL) mapping and marker-assisted selection for crop improvement: the basic concepts. Euphytica. 2005;142(1–2):169–196.
- Ding JQ, Wang XM, Chander S, et al. QTL mapping of resistance to Fusarium ear rot using a RIL population in maize. Mol Breed. 2008;22(3):395–403.
- Rey JI, Cerono J, Lu'quez J. Identification of quantitative trait loci for resistat to maize ear rot caused by fusarium moniliforme Sheldon and common rust caused by Pucciniasorghi in Argentinian maize germplasm. Rev Fac Agron La Plata. 2009;108(1):1–8.
- VanOpdorp NJ. Predicted QTL locations for fusarium ear rot (FER) resistance in maize and the generation of improved FER resistant maize inbred lines [dissertation]. West Lafayette (IN): Purdue University; 2009. Available from: http://docs.lib.purdue.edu/dissertations/AAI1469941/.
- Xiang KL, Reid M, Zhang ZM, et al. Characterization of correlation between grain moisture and ear rot resistance in maize by QTL met analysis. Euphytica. 2012;183:185–195.
- Yang Q, Yi GM, Guo YL, et al. A major QTL for resistance to Gibberella stalk rot in maize. Theor Appl Genet. 2010;121:673–687.
- Li Z, Ding J, Wang R,et al. A new QTL for resistance to Fusarium ear rot in maize. J Appl Genet. 2011;52(4):403–406.
- Chen J, Ding J, Li H, et al. Detection and verification of quantitative trait loci for resistance to Fusarium ear rot in maize. Mol Breed. 2012;30(4):1649–1656.
- Zila CT, Samayoa LF, Santiago R, et al. A genome-wide association study reveals genes associated with Fusarium ear rot resistance in a maize core diversity panel. Genes Genomes Genet. 2013;3(11):2095–2104.
- Jenkis MT, Robert AL. Evaluating the breeding potential of inbred lines of corn resistant to the leaf blight caused by Helminthosporium turcicum. Agron J. 1959;51:93–95.
- Senior ML, Murphy JP, Goodman MM, et al. Utility of SSRs for determining similarities and relationships in maize using an agarose gel system Crop Sci. 1998;38(4):1088–1098.
- Doyle JJ, Doyle JL. Isolation of plant DNA from fresh tissue. Focus. 1990;12:13–15.
- Kozhukhova NE, Sivolap YM, Varenyk BF. Marking loci responsible for resistance of maize to Fusarium rot. Cytol Genet. 2007;41(2):98–102.
- Melchinger AE. Genetic diversity and heterosis. In: Coors JG, Pandey S, editors. Genetics and exploitation of heterosis in crops. Madison (WI): ASA/CSSA/SSSA; 1999. p. 99–118.
- Michelomore RW, Paran I, Kesseli RV. Identification of markers linked to disease- resistance genes by bulked segregant analysis: a rapid method to detect markers in specific genomics regions by using segregating populations. Proc Natl Acad Sci U S A. 1991;88:9828–9852.
- Meer J, Robert H, Cand F, et al. Map manager version 0.22. 2002. Available from: http://manager.roswellpark.org/mmQTX.html
- Saghai-Maroof MA, Soliman KM, Jorgensen RA, et al. Ribosomal DNA spacer-length polymorphism in barely: Mendelian inheritance chromosomal location and population dynamics. Proc Natl Acad Sci U S A. 1984;81(24):8014–8018.
- Kanagarasu S, Nallathambi G, Ganesan KN, et al. Determination of genetic polymorphism among indigenous and exotic maize inbreds using microsatellite markers. Afr J Biotechnol. 2013;12(39):5723–5728.
- Xu J, Liu L, Xu Y, et al. Development and characterization of simple sequence repeat markers providing genome-wide coverage and high resolution in maize. DNA Res. 2013; 20(520):497–509.
- Nikhou F, Ebrahimi A, Shiri M. Genetic diversity assessment among maize hybrids using SSR markers. Tech J Eng Appl Sci. 2013;13:3831–3834.
- Zhao Y, Mette MF, Gowada M, et al. Bridging the gap between marker-assisted and genomic selection of heading time and plant height in hybrid wheat. Heredity. 2014;112(6):638–645.
- Lanubile A, Ferrarini A, Maschietto V, et al. Functional genomic analysis of constitutive and inducible defense responses to Fusarium verticillioides infection in maize genotypes with contrasting ear rot resistance. BMC Genomics. 2014;15(1):710–725.
- Fernando F, Alvarez C, William M, et al. Genetic mapping of QTLfor maize weevil resistance in a RIL population of tropical maize. Theor Appl Genet. 2015;128:411–419.
- Liu XH, Zhenh ZP, Tan ZB, et al. Quantitative trait locus (QTL) mapping for 100-kernel weight of maize (Zea mays L.) under different nitrogen regimes. Afr J Biotechnol. 2012;9(49):8283–8289.
- Nikolic' V, Andjelkovic' D, Dodig S, et al. Identification of QTLs for drought tolerance in maize, II: yield and yield components. Genetika. 2013;45(2):335–341.
- Jambhulkar NN. QTL identification in presence of QTL x environment interaction. Int J Comput Eng Manag. 2012;15:89–94.
- LiuY, Wang L, Sun C, et al. Genetic analysis and major QTL detection for maize kernel size and weight in multi-environments. Theor Appl Genet. 2014;127(5):109–1037.
- Zhang Z, Ober U, Erbe M, et al. Improving the accuracy of whole genome prediction for complex traits using the results of genome wide association studies. Plos One. 2014;9:93017. doi:10.1371