
ABSTRACT
Psammosilene tunicoides is an important herb used in traditional Chinese medicine. It has been proved to benefit the stomach and treat rheumatism and gout. On the market, this herbal medicine is frequently adulterated by the related species Silene viscidula. Correct identification of P. tunicoides is important to ensure herbal quality, safety, authenticity and health for consumers. However, the identification of the P. tunicoides and S. viscidula species is complicated because of their morphological similarities. Therefore, a reliable method to authenticate these two medicinal plants is needed. In this study, the ITS2 barcode region coupled with high-resolution melting (Bar-HRM) was evaluated as a novel approach for differentiating P. tunicoides from its adulterant S. viscidula. Our findings showed that Bar-HRM not only detected the adulteration, but also quantified the most common admixture. Bar-HRM sensitivity in adulterant detection was assessed by analysing samples mixed with different proportions of S. viscidula and P. tunicoides control. The results are presented as a linear regression with R2 = 0.9852, which implied the capability of the method to detect adulteration. This study is significant to verify the authenticity for better quality control of this herbal species.
Introduction
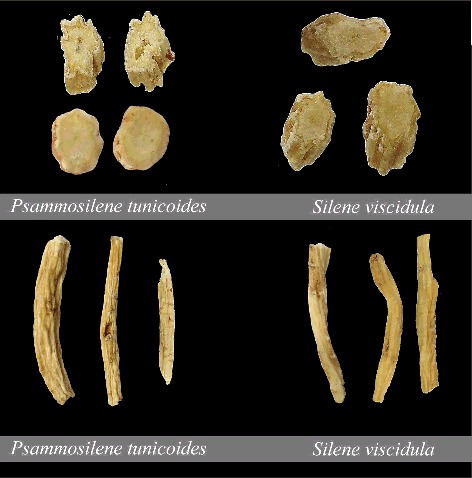
The genus Psammosilene belongs to the Caryophyllaceae family and has only one species, namely, Psammosilene tunicoides. The dried roots of P. tunicoides have been used as a traditional Chinese medicine to treat rheumatism, haemostasis, trauma haemorrhage and gout for thousands of years.[Citation1] With the increase in market demand and destruction of wild resources, P. tunicoides is diminishing at an alarming rate and has been listed as a second-degree nationally protected plant.[Citation2] Given its high market demand, P. tunicoides has a relatively high market price compared with other related medicinal plants. This demand has led to substantial adulteration with other species, such as Silene viscidula. Market surveys identified S. viscidula as one of the main medicinal adulterants in the processed products of P. tunicoides.[Citation3] Therefore, the correct identification of P. tunicoides is important to ensure herbal quality, safety, authenticity and health for consumers. However, identifying between these two medicinal materials is complicated because of their similar morphology (). They differ only by the shape of flowers, leaves and stems, and these characteristics are difficult to observe when the materials are dried, cut or pulverized.[Citation4] Currently, various criteria and methods have been developed to authenticate medicinal species, including the use of morphological characteristics, chemical profiles, high performance liquid chromatography and simple sequence repeats markers, etc.[Citation5–9] Nevertheless, these methods may be limited by morphological similarities and chemical variation among samples, or high cost. Thus, a reliable method to authenticate these medicinal plants is needed.
Figure 1. Morphology of P. tunicoides and S. viscidula.
DNA-barcoding is a new technique that uses universal primers to amplify small, conservative ends of DNA fragments to identify species.[Citation10,Citation11] DNA-barcoding provides more subjective and accurate results compared with the traditional methods, and it is also an effective complement to traditional identification methods.[Citation12,Citation13] In recent years, the DNA-barcoding technology has been increasingly used in some fields for species identification, food safety testing and biodiversity studies.[Citation14–16] Chen et al. [Citation17] utilized DNA-barcoding to authenticate medicinal plants and suggested that ITS2 can be used as a universal barcode for these plants. Since then, the ITS2 region has been shown to discriminate a wide range of plants.[Citation18–20] High-resolution melting (HRM) is a novel polymerase chain reaction (PCR)-based method that allows genotyping polymorphisms, mutation scanning and sequence matching by discriminating DNA sequence variants based on the shape of whole melting transitions (Tm) of real-time PCR products.[Citation21,Citation22] This method has been widely used in medical research applications, including detection of cancer-specific mutations [Citation23,Citation24]; moreover, it is also utilized to authenticate plant species and their processed products, as well as to accurately quantify adulterants in food products.[Citation25–30] However, the application of HRM analysis in the authentication of herbal products is still in its initial stages, and the studies on the classification and identification of herbal products are few.[Citation31–33]
In this study, we set out to develop a rapid, sensitive and generally useful Bar-HRM method to identify P. tunicoides and its adulterant S. viscidula. In addition, we validated their genotypes by sequencing to verify if the HRM analysis profile agrees with nucleotide sequencing data. Finally, Bar-HRM sensitivity in adulterant detection was assessed by analysing samples mixtures containing different proportions of S. viscidula in commercial product of P. tunicoides. Distinguishing between these two medicinal materials will enhance the quality control and management strategies for this herbal plant.
Materials and methods
Plant materials
A total of 30 typical medicinal materials were used in the validation of the HRM assay. These comprised 15 P. tunicoides and 15 S. viscidula samples. All the samples were procured from different parts of China (), and were authenticated by Prof. Yulin Lin of the Institute of Medicinal Plant Development (IMPLAD), Chinese Academy of Medical Sciences. The voucher samples were deposited in the Herbarium of IMPLAD. Besides, 8 ITS2 sequences were retrieved from GenBank (Their GenBank IDs were HQ585914, JF978143, HQ585916, AY517545, HQ585917, HQ585920, EF567119 and HQ585922, respectively).
Table 1. Description of the plant materials used in this study.
DNA isolation and HRM-PCR amplification
Total DNA was extracted using the protocol of the Plant Genomic DNA Kit (Tiangen Biotech Co., Beijing, China), and the DNA concentration was quantified using a spectrophotometer (Qubit 3.0, Invitrogen Co., Carlsbad, CA USA). The DNA samples were then diluted to 50 ng/μL working concentration and stored at 4 °C until further use. The real-time PCR reaction mixture (25 μL) contained 50 ng of genomic DNA, 12.5 μL of 2 × HRM PCR master mix, 1 μL of 10 μmol/L of forward and reverse primers (ITS2F: 5′-ATG CGA TAC TTG GTG TGA AT-3, ITS3R: 5′-GAC GCT TCT CCA GAC TAC AAT-3′) and distilled water up to the final volume. RT-PCR was performed in a Rotor-Gene Q MDx (QIAGEN) under the following conditions: 94 °C for 3 min, followed by 40 cycles of 94 °C for 30 s, 56 °C for 30 s and 72 °C for 45 s. The fluorescent data were acquired at the end of each extension step during the PCR cycles. HRM analysis was performed immediately following the completion of PCR amplification. The temperature was raised from 70 to 90 °C at 0.15 °C degree increments with a 2 s hold time for each acquisition step. Fluorescence was continuously monitored during the slow warming up of the gradient curve with a sharp fluorescence drop near the denaturation temperature. The Rotor-Gene Q software was used to analyse the melting profiles. The negative derivative of the fluorescence (F) over temperature (T) (dF/dT) curve displays Tm, and the normalized raw curve depicts the decreasing fluorescence against increasing temperature. Genotypes of test samples were identified by selecting a representative sample for each species. Based on a confidence threshold of 90%, a confidence percentage for each genotype was calculated.
Sequencing of PCR products
To verify the HRM analysis results, each PCR product was directly sequenced in two directions using the automated ABI 3730 XL sequencer (Applied Biosystems, Foster City, CA, USA). Sequence assembly and the generation of consensus sequences were completed using CodonCode Aligner (CodonCode, Dedham, MA, USA). Complete ITS2 sequences were retrieved according to hidden Markov model based model analysis. Sequence alignment, Kimura 2-parameter (K2P) distance calculations and phylogenetic tree construction were carried out using MEGA5.1 software.
HRM sensitivity assessment
To evaluate the sensitivity and accuracy levels of the HRM methodology in the detection and quantification of adulterants, a serial proportion of S. viscidula sample was mixed with P. tunicoides control to produce progressive ratios of 1%, 5%, 7%, 10%, 15%, 20%, 30% and 50%. The admixture samples were then ground to fine powder, from which 0.5 g was randomly collected for DNA extraction. Real-time PCR amplification and melting profile analysis were performed as described above.
Data analysis
Regression analysis (R2) was done using Origin 7.5 software.
Results and discussion
Identification of herbal products with HRM analysis of universal ITS2 barcoding region
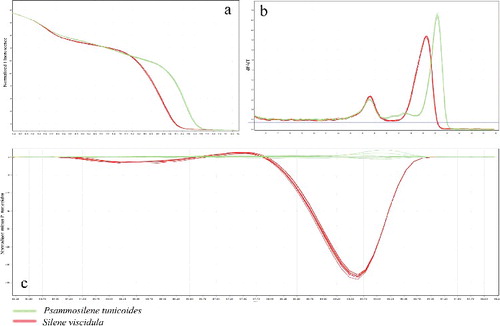
The universal ITS2 primer was used to amplify DNA-fragments from P. tunicoides and its adulterant S. viscidula, and the resulting amplicons were analysed using HRM. The melting curves of HRM were obtained based on the pattern of temperature-shifted curves and difference plot (). As shown in ((a)), the barcode marker ITS2 was specific to these two species with different melting profiles running parallel to each other, making them easily distinguishable. The two genotypes were separated by incremental shifts on the x-axis, with S. viscidula to the left and P. tunicoides to the right ((b)). Improved visualization and separation of variant melting curves from each species were demonstrated in the difference curves ((c)). One curve of P. tunicoides set for genotype and used as baseline revealed the differences between the genotypes under investigation and showed that all genotypes used could be visually distinguished by their melting curves. These results indicated that these two species were indeed different ((c)). Finally, genotype confidence percentages (GCPs) were calculated, and a cut-off value of 90% was used to assign a genotype for each barcode region. With this approach, all samples were successfully genotyped, and these two species were sufficiently and confidently identified.
Figure 2. Melting curve profiles of amplicons obtained by HRM analysis of the two species with the ITS2 type indicated. (a) Normalized plot of ITS2 primer showing the differentiation of the melting temperature (Tm) of these two species in HRM analysis. (b) Representative profiles of the melting curves (derivative melt curves) of ITS2 amplicons. (c) Difference graph of the two species, using P. tunicoides as a reference genotype.
Species authentication using DNA sequencing
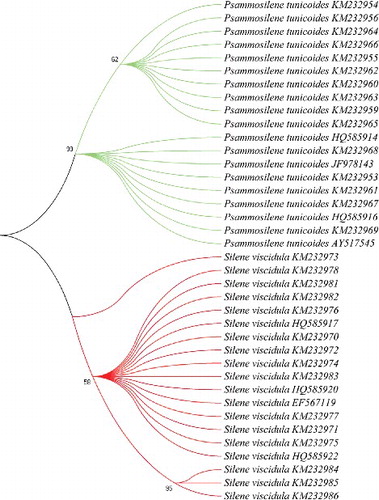
To validate the results of HRM analysis, amplicon sequences of all samples from the two species were analysed. The detected sequences amplified from the ITS2 markers were used to construct a phylogenetic tree using the neighbour-joining (NJ) cluster algorithm. The analysis showed that P. tunicoides formed one clade, which could be successfully distinguished from its adulterant S. viscidula, suggesting the sequencing results agreed with those obtained by Bar-HRM ().
Figure 3. Phylogenetic tree of P. tunicoides and its adulterant S. viscidula constructed with the ITS2 sequences using the NJ method. The bootstrap scores (1000 replicates) are shown (≥50%) for each branch.
Quantitative detection of P. tunicoides adulterants with Bar-HRM analysis
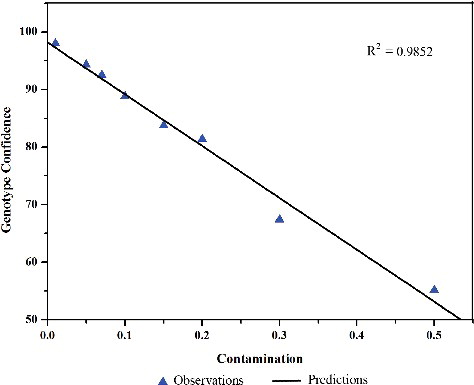
To confirm the sensitivity and accuracy levels of the HRM assay, the detection limit of adulterated P. tunicoides products was evaluated by adding an increasing quantity of standard S. viscidula samples to P. tunicoides. DNA was then extracted from the admixture samples and HRM analysis was performed on the ITS2 region. As illustrated in , the dissociation of the P. tunicoides amplicon revealed the actual degree of contamination resulting from adulteration at a precise level. The results are presented as a linear regression with R2 = 0.9852 (). This R2 value suggests high correlation of the fluorescence mean with the artificial samples used. Using this approach, we were able to detect S. viscidula at 10% of the total admixture when assayed in combination with P. tunicoides ((c)).
Figure 4. Adulterations of S. viscidula mixed with P. tunicoides detected by HRM analysis. (a) Normalized melting profiles obtained from different mixtures containing 50%, 30%, 20%, 15%, 10%, 7%, 5% and 1% of S. viscidula in P. tunicoides. (b) High-resolution melting curves (derivative melt curves) of the ITS2 region primer assay. (c) Reference-corrected normalized fluorescence plot of high-resolution melting using ‘P. tunicoides’ as genotype.
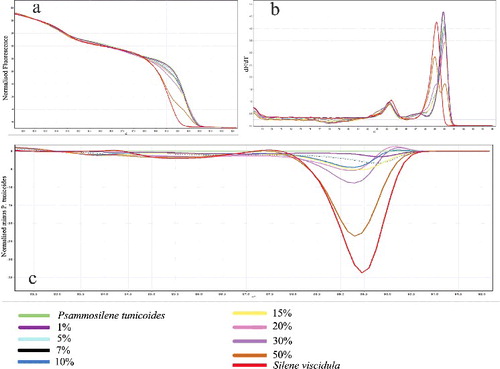
Figure 5. Pure S. viscidula was mixed with P. tunicoides in progressive proportions (1%, 5%, 7%, 10%, 15%, 20%, 30% and 50%). The results are presented as a linear regression with R2 = 0.9852.
Bar-HRM authentication of herbal products: a potential application
In previous studies, DNA-barcoding was widely applied to detect substitution and adulteration in herbal medicines, but it is a relatively expensive and time-consuming process. Moreover, herbal products found in China's local markets are commonly sold as processed products. When differentiating these processed forms (e.g. tablets or powdered form) from products with an admixture of elements of other species, it is impossible to identify the constituent species only through the DNA-barcoding method. DNA extracted from these products yielded a contaminative amplification PCR product (contaminating background signal leads to a poor quality read of sequencing signal). In contrast to DNA-barcoding methods, the Bar-HRM method uses the melting curve changes caused by the release of an intercalating DNA dye from a DNA duplex denatured by increasing temperature.[Citation34] This method opens up the possibility of its application in cases where DNA-barcoding fails (e.g. admixture detection).[Citation35] In addition, this novel and reliable approach does not require electrophoretic separation or additional handling because the whole analysis is conducted in a closed tube system. Bar-HRM has allowed us to easily determine herbal species in processed products within 4 h. Therefore, the Bar-HRM method developed in this study shows great potential as a tool in the detection of adulteration and/or substitution in herbal products, especially in processed forms.
Conclusions
In this study, we identified the presence of P. tunicoides and its major adulterant S. viscidula using HRM coupled with universal nuclear (ITS2) DNA-barcoding region. The results showed that Bar-HRM allowed not only the identification of adulteration, but also the quantification of the most common admixture. Using the ITS2 region, we could quantify that the adulteration of S. viscidula with P. tunicoides was as low as 10% in the medicinal admixture. These results were also validated by sequence analysis of the ITS2 region, which revealed that the two species were indeed different from each other. This method was further proven and confirmed via a standard curve of a very high correlation coefficient (R2 = 0.9852), suggesting that Bar-HRM is a rapid, sensitive and accurate method to distinguish and authenticate P. tunicoides species and reveal adulteration in its processed products. In the future, we could also use this powerful method to test for the adulteration of other commonly used commercial herbal products.
Disclosure statement
No potential conflict of interest was reported by the authors.
Additional information
Funding
Related Research Data
References
- Chinese Pharmacopoeia Commission. The pharmacopoeia of the People's Republic of China. Vol. 1. Beijing: Chemical Industry Press; 2005.
- Xie H, Qian ZG, Yang YW. Basically studies on biological characters and protection of Psammosilene tunicoides in Yunnan. J Yunnan U Traditional Chinese Med. 2003;26(1):8–11. Chinese.
- Liao CL, Liu CS, Zhang YY, et al. Accurate identification of Psammosilene tunicoides and its confused species by systematic identification method. China J Chinese Materia Med. 2013;38(8):1134–1137. Chinese.
- Song M, Zhang WB, Zhang YQ, et al. Identification of Psammosilene radix and its adulterants by ITS2 sequence. World Sci Technol/Modernization Traditional Chinese Med Materia Med. 2014;16(8):1730–1734. Chinese.
- Wu L, Sun W, Wang B, et al. An integrated system for identifying the hidden assassins in traditional medicines containing aristolochic acids. Sci Rep [Internet]. 2015 [cited 2015 Sep 12];5:1138. Available from: http://dx.doi.org/10.1038/srep11318
- Lau CB, Cheng L, Cheng BW, et al. Development of a simple chromatographic method for distinguishing between two easily confused species, Hedyotis diffusa and Hedyotis corymbosa. Nat Prod Res. 2012;26(15):1446–1450.
- Li M, Jiang RW, Hon PM, et al. Authentication of the anti-tumor herb Baihuasheshecao with bioactive marker compounds and molecular sequences. Food Chem. 2010;119(3):1239–1245.
- Shen Y, Li Y, Liu TT, et al. Microscopical and physicochemcical identification of 3 sources of Curcumae Rhizoma. Chem Res and Appl. 2014;26(2):267–270. Chinese.
- Li XL, Lu JH, Xie LB, et al. Development of EST-SSR primers and genetic relationship analysis in four Glycyrrhiza L. Species. Acta Bot Boreali-Occidentalia Sin. 2015;35(3):480–485. Chinese.
- Ryan GT. DNA barcoding does not compete with taxonomy. Nature. 2005;434:1067.
- Miller SE. DNA barcoding and the renaissance of taxonomy. Proc Natl Acad Sci USA. 2007;104:4775–4776.
- Min XJ, Hickey DA. Assessing the effect of varying sequence length on DNA barcoding of fungi. Mol Ecol Notes. 2007;7:365–373.
- Ross HA, Murugan S, Li WL. Testing the reliability of genetic methods of species identification via simulation. Syst Biol. 2008;57:216–230.
- Gao T, Yao H, Song JY, et al. Evaluating the feasibility of using candidate DNA barcodes in discriminating species of the large Asteraceae family. BMC Evol Biol [Internet]. 2010 [cited 2015 Sep 12];10:324. Available from: http://www.biomedcentral.com/1471-2148/10/324
- Galimberti A, Mattia FD, Losa A, et al. DNA barcoding as a new tool for food traceability. Food Res Int. 2013;50:55–63.
- Yan LJ, Liu J, Michael M, et al. DNA barcoding of Rhododendron (Ericaceae), the largest Chinese plant genus in biodiversity hotspots of the Himalaya–Hengduan Mountains. Mol Ecol Resour. 2014;15(4):932–944.
- Chen SL, Yao H, Han JP, et al. Validation of the ITS2 region as a novel DNA barcode for identifying medicinal plant species. PLoS One [Internet]. 2010 [cited 2010 Jan 7];5(1):e8613. Available from: http://dx.doi.org/10.1371/journal.pone.0008613
- Sun ZY, Gao T, Yao H, et al. Identification of Lonicera japonica and its related species using the DNA barcoding method. Planta Med. 2011;77:301–306.
- Pang X, Shi L, Song J, et al. Use of the potential DNA barcode ITS2 to identify herbal materials. J Nat Med. 2013;67(3):571–575.
- Zomuanpuii R, Ringngheti L, Brindha S, et al. ITS2 characterization and Anopheles species identification of the subgenus Cellia. Acta Trop. 2013;125(3):309–319.
- Wittwer CT. High resolution DNA melting analysis: advancements and limitations. Hum Mutat. 2009;30(6):857–859.
- Vietina M, Agrimonti C, Marmiroli N. Detection of plant oil DNA using high resolution melting (HRM) post PCR analysis: a tool for disclosure of olive oil adulteration. Food Chem. 2013;141:3820–3826.
- Krypuy M, Newnham GM, Thomas DM, et al. High resolution melting analysis for the rapid and sensitive detection of mutations in clinical samples: KRAS codon 12 and 13 mutations in non-small cell lung cancer. BMC Cancer [Internet]. 2006 [cited 2006 Dec 21];6:295. Available from: http://www.biomedcentral.com/1471-2407/6/295
- Lin CY, Li MJ, Chang JG, et al. High-resolution melting analyses for genetic variants in ARID5B and IKZF1 with childhood acute lymphoblastic leukemia susceptibility loci in Taiwan. Blood Cells Mol Dis. 2014;52:140–145.
- Madesis P, Ganopoulos I, Anagnostis A, et al. The application of Bar-HRM (Barcode DNA-High Resolution Melting) analysis for authenticity testing and quantitative detection of bean crops (Leguminosae) without prior DNA purification. Food Control. 2012;25:576–582.
- Sakaridis I, Ganopoulos I, Argiriou A, et al. A fast and accurate method for controlling the correct labeling of products containing buffalo meat using High Resolution Melting (HRM) analysis. Meat Sci. 2013;94:84–88.
- Druml B, Cichna-Markl M. High resolution melting (HRM) analysis of DNA – Its role and potential in food analysis. Food Chem. 2014;158:245–254.
- Ganopoulos I, Madesis P, Darzentas N, et al. Barcode High Resolution Melting (Bar-HRM) analysis for detection and quantification of PDO “Fava Santorinis” (Lathyrus clymenum) adulterants. Food Chem. 2012;133(2):505–512.
- Bosmali I, Ganopoulos I, Madesis P, et al. Microsatellite and DNA-barcode regions typing combined with High Resolution Melting (HRM) analysis for food forensic uses: a case study on lentils (Lens culinaris). Food Res Int. 2012;46(1):141–147.
- Kalivas A, Ganopoulos I, Xanthopoulou A, et al. DNA barcode ITS2 coupled with high resolution melting (HRM) analysis for taxonomic identification of Sideritis species growing in Greece. Mol Bio Rep. 2014;41(8):5147–5155.
- Singtonat S, Osathanunkul M. Fast and reliable detection of toxic Crotalaria spectabilis Roth. in Thunbergia laurifolia Lindl. herbal products using DNA barcoding coupled with HRM analysis. BMC Complement Altern Med [Internet]. 2015 [cited 2015 May 30];15:162. Available from: http://dx.doi.org/10.1186/s12906-015-0692-6
- Osathanunkul M, Madesis P, Boer HD. Bar-HRM for authentication of plant-based medicines: evaluation of three medicinal products derived from Acanthaceae species. PLoS One [Internet]. 2015 [cited 2015 May 26];10(5):e0128476. Available from: http://dx.doi.org/10.1371/journal.pone.0128476
- Osathanunkul M, Suwannapoom C, Ounjai S, et al. Refining DNA barcoding coupled high resolution melting for discrimination of 12 closely related Croton species. PLos One [Internet]. 2015 [cited 2015 Sep 25];10(9):e0138888. Available from: http://dx.doi.org/10.1371/journal.pone.0138888
- Sun W, Li JJ, Xiong C, et al. The potential power of Bar-HRM technology in herbal medicine identification. Front Plant Sci. [Internet]. 2016 [cited 2016 Mar 30];7:e8613. Available from: http://dx.doi.org/10.3389/journal.fpls.2016.00367
- Buddhachat K, Osathanunkul M, Madesis P, et al. Authenticity analyses of Phyllanthus amarus using barcoding coupled with HRM analysis to control its quality for medicinal plant product. Gene. 2015;573(1):84–90.