
ABSTRACT
Accurate assessment of liver fibrosis is a critical aspect of diagnosis, prognosis prediction, surveillance strategies, therapeutic planning and monitoring, and also for validation of non-invasive surrogates of fibrosis. Traditional histopathological stagings depend on subjective visual interpretation process of architectural changes of fibrosis without providing quantification as continuous numerical data, but rather in the form of discrete staging. This makes high level reproducibility practically impossible in its application, which should be minimized in scientific research. In the light of increasing demand for an objective method, digital image analysis (DIA) technology has been increasingly implemented for liver fibrosis assessment. Potential advantages and applications of reproducible quantitative fibrosis ratio measurements with DIA include performing broader scale of statistical analysis and comparison between studies, monitoring minor but potentially important quantity changes during fibrosis regression or progression (especially in the context of therapeutic trials), and to be a better histological reference standard for validity and accuracy of surrogates of fibrosis. DIA may also have a potential role within the new perspective of redefining and sub-classifying cirrhosis. Since DIA algorithm covers multiple domains of hepatopathology and engineering, it may seem to be complicated to a researcher. This review provides an understanding of all basic steps, techniques, clinical applications of computerized image analysis for the particular purpose of liver fibrosis aiming its better implementation in hepatology research. Further work is required for standardization of all stages of pre-imaging, digital image acquisition and digital image processing steps for generation of reproducible outputs.
Introduction
Liver fibrosis is a common pathological pathway resulting from chronic inflammation of hepatic parenchyma regardless of the aetiology. The deposition of excess and abnormal extracellular matrix (ECM) rich in fibril-forming collagens is the hallmark of liver fibrosis.[Citation1] Progressive accumulation of the ECM leads to distortion of hepatic architecture and eventually to cirrhosis which is accompanied by important clinical implications such as liver function impairment, consequences of portal hypertension (PHT) and hepatocellular carcinoma (HCC).
Accurate assessment of the extent of liver fibrosis is a critical aspect for guiding the diagnosis, prognosis prediction, initiation of surveillance strategies (HCC and oesophageal varices), planning antiviral treatment, monitoring changes in fibrosis with therapy and also for validation of non-invasive surrogates of fibrosis. In these respects, histological assessment of liver tissue has been regarded as the reference standard.
The traditional histopathological stagings, such as Knodell, Metavir, Ishak and Scheuer systems incorporate a number of categories ranging from no fibrosis to cirrhosis in a stepwise manner describing the architectural changes in terms of fibrous septa, bridge or nodule formation, without providing a measurement for the fibrosis quantity as a continuous numerical variable. These scoring systems are subject to high rate of inter- and intra-observer variability [Citation2] limiting the reproducibility of the process.
Morphometric assessment of histopathological sections by computer-assisted digital image analysis (DIA) has been implemented with the intention to assess the quantity of liver fibrosis in a reproducible and standardized manner avoiding the observer's bias. Morphometry refers to the quantitative analysis of forms, and in histopathology defines the measurements from tissue sections. DIA is, in essence, the process of analysing digital images displayed to the computer monitor which are acquired by a digital camera connected to a microscope.
Most previous studies explored liver fibrosis using different methodology, software and equipment set-ups precluding comparison of results and standardization, which adversely affected its wide adoption in clinical hepatology. Therefore, a clear understanding of the methodological and technological aspects of each phase is required.
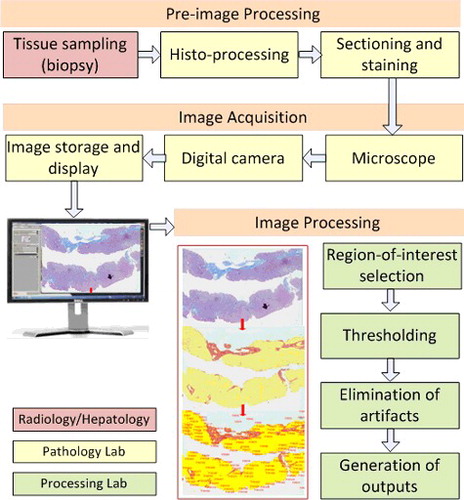
To fully comprehend the liver fibrosis DIA, steps starting from tissue sampling to image analysis process (), should be well defined and matched to the requirements and expectations of the clinical use. DIA process essentially covers multiple domains of hepatopathology and engineering which can be somewhat complicated to a researcher in the medical profession. This review provides an understanding of all basic steps, techniques and clinical implementation of DIA for the particular purpose of liver fibrosis enabling researchers to better design and carry out studies.
Figure 1. Digital image analysis process starting from biopsy to quantification of final results.
Discussion
Technical considerations
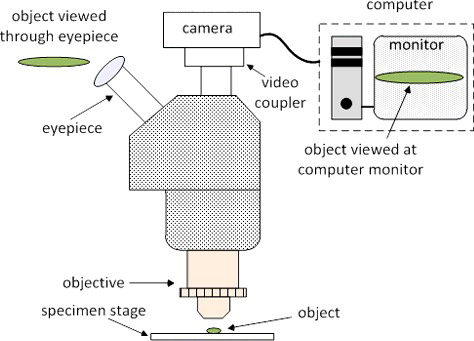
Typical DIA process involves a microscope, digital camera, video coupler, computer and the image analysis software (). Key technical aspects of the process are optical resolution, optical magnification, digital camera resolution and sampling, overall magnification and colour image analysis of target features. Optical resolution, which is defined as the smallest distance apart at which two points on a specimen can still be observed separately, is solely determined by the type of the objective lens used in the microscope.[Citation3,Citation4] Optical magnification enlarges this distance for better view either at the eyepiece of the microscope or at the computer monitor. Optical view of the image is regarded as the analog domain whereas digital camera and computer monitor view is regarded as the digital domain. Transforming the picture from optical (analog) domain to digital domain, technical characteristics of the digital camera such as sensor size and type, pixel size, representation of colour depth become important. Often megapixel size of a digital camera is confused with its spatial resolution ability, which is largely limited by the image sensor and the image processor (Supplementary Figure S2). High megapixel size does not necessarily translate into better picture clarity. Optical resolution together with the optical magnification ability play a central role in final digital resolution and picture clarity, thus high megapixel in digital cameras does not necessarily imply better resolution and picture clarity in digital images.
Figure 2. Typical set-up on optical microscope with digital image acquisition.
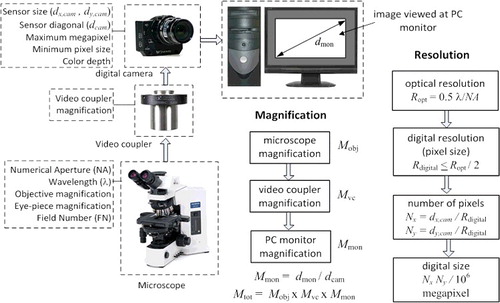
Another highly confused aspect of DIA process is the amount of total magnification when the sample is viewed on a computer monitor. A wide range of magnification values such as 2x, 4x, 20x, 40x and 100x have been stated in the method sections of DIA studies, some indicating that these values are the optical magnification without clarifying how much the final image is magnified and some did not even mention whether this value is of the objective (Mobj) or the final image. Total magnification (Mtot) of the final digital image which DIA is applied to, must be stated and calculated from the parameters like objective magnification, video coupler magnification, digital camera sensor format and the computer monitor (viewing area) size. These aspects of the DIA process are summarized in . Detailed analysis of each technical feature is presented in Supplementary Section.
Figure 3. System parameters for magnification and resolution; Mobj, Mvc, Mmon and Mtot represent microscope magnification, video coupler magnification, PC monitor magnification and total magnification, respectively; dmon, dcam, dx,cam and dy,cam represent diagonal dimension of monitor and diagonal dimension of camera sensor, horizontal size of camera sensor and vertical size of the camera sensor, respectively; Ropt, Rdigital and λ represent optical resolution, digital resolution and wavelength, respectively; Nx, and Ny represent number of pixels in horizontal and vertical directions, respectively.
In a study conducted by our group, we compared trichrome proportionate areas (TPA) from 50x and 100x magnified images, which captured whole and some part of the liver histological sections, respectively.[Citation5] In our experience capturing the whole slide may allow a better estimate for the whole liver fibrosis ratio, while capturing only some part (which was generally more fibrotic as perceived by the pathologist in our study) may overestimate the fibrotic area, and also may be prone to subjectivity and higher inter-observer variability which should be minimized in scientific research. Very high magnification (that is able to capture only a part of the section, e.g. ≥100x) may provide a perfect resolution which can be used with the purpose to define features such as zonal progression or regression of fibrosis in detail.
Computer-assisted digital image analysis procedure
DIA of the sample basically involves colour representation of the image, image sharpening and noise removal, region-of-interest (ROI) selection, thresholding and segmentation, removal of artefacts, feature detection (area, number, shape formation, etc.) and quantification of the features. Depending on the image clarity, image sharpening and noise removal may not be deemed necessary.
In quantification of liver fibrosis area, DIA applies a segmentation process of partitioning the digital image of the biopsy section into multiple pixels enabling characterization and quantitative measurements of the intended regions with the aid of a computer and software used in analysing images. Typical process is illustrated in . The user first defines ROI's on the image demarking the areas of fibrosis, parenchyma and excluding the areas of potential artefact (e.g. staining debris) or areas unrelated with the fibrotic disease (e.g. liver capsule). Next, the user participates in an interactive thresholding process to determine the threshold for pixels that correspond to the regions of fibrosis areas and the liver parenchyma. After thresholding, the software converts the original image into a binary-coloured output by marking pixels that belong to fibrosis and parenchyma areas. Though the output is binary-coloured, the pixels of each area represent a spectrum of colour and intensity of the original image that is determined by the thresholding function. Finally, software extracts the quantitative information automatically by counting the similarly labelled pixels from the distinct regions of the image.
Figure 4. Digital image analysis steps performed on the image of a chronic hepatitis C patients’ biopsy interpreted as Ishak F6 by the pathologist, (a) original image, (b) region-of-interest (ROI) selection (bordering the specimen area), (c) manual thresholding (white voids within the sample represent steatosis), (d) fibrosis and parenchyma areas are converted into a binary colored overlay, (e) feature identification and extraction, (f) quantification of fibrosis and parenchyma areas, trichrome proportionate area is calculated as 0.287/(0.287 + 0.619) × 100% = 31.68%.
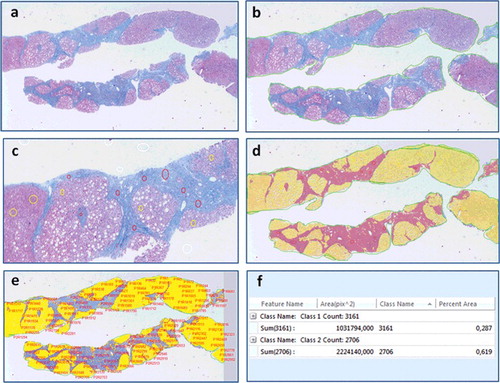
Artefacts can be eliminated manually if required. Although fully automatic feature extraction algorithms exist, in liver histopathology these algorithms exhibit mediocre performance due to low contrast difference between the target and neighbouring areas and rather complex structure of the sample. Thus, manual intervention to exclude artefacts is usually required. The aspects and importance of colour representation and basic morphological operations are discussed in Supplementary Section.
In most computer-assisted DIA studies of histological liver sections, the amount of fibrosis is expressed as a simple proportionate area (PA) ranging from 0% to 100% which is defined as the total area of fibrosis divided by the total area of the sample (fibrosis plus parenchyma) [Citation6–8], although some also considered the histological section thickness [Citation9,Citation10]. Recently, a new method – qFibrosis, quantitatively identifying and combining the spatial architectural features of pathological relevance (the number, length or texture of fibrillar collagen) by the automated computer-aided image analysis tool were also developed using the non-linear optical second harmonic generation/two-photon excitation fluorescence microscopy.[Citation11]
Pathological consıderations
Slide preparation involves a series of pre-imaging steps; tissue sampling, histo-processing, sectioning, staining quality should be ensured for the high quality final images and reliable results ().
Since core-aspiration needle samples represent just about 1/50,000 of the entire adult liver, the requirements for traditional histopathological staging like specimen size to minimize sampling variability will also apply to liver fibrosis PA measurements. Viral hepatitis studies have shown that biopsy size influences the pathological grading and staging,[Citation12] and a biopsy length of at least 25 mm is necessary for accurate staging with a semiquantitative score.[Citation13] Specifically, optimal biopsy length or portal tract number to achieve reliable PA estimates for the whole liver fibrosis ratio has not been defined. In one study, variability in collagen PAs (CPAs) related to 2, 5, 10 and 20 mm2 biopsy sizes were compared with 100 mm2 test area of each specimen, and found that most biopsies ≥5 mm2 had a relative variance <50%.[Citation7] They suggested that biopsies >5 mm2 in size were acceptable for CPA determination by quantitative DIA.[Citation7] Another study suggested that smaller biopsy specimens measuring at least 15 mm may be acceptable depending on the similar correlation coefficients between CPA and hepatic venous pressure gradient (HVPG) for either 15 or 20 mm long biopsies.[Citation6] Because DIA PA measurements rarely depend on morphological information, it may be less vulnerable to the quality of biopsy specimen according to current standards concerning the number of portal tracts or quality of the specimen (e.g. minimal fragmentation) for histopathological staging and still may provide reliable fibrosis quantification from suboptimal specimens. Sample adequacy for reliable fibrosis quantification may also be affected by the irregular distribution of fibrosis as a consequence of disease aetiology.
Apart from spatial resolution, colour contrast and consistency (no perceptual difference in colour to interpreters), and artefacts are important parameters affecting image quality, thus the accurate thresholding process. Colour consistency is affected from slide preparation and staining protocol, hardware and software components. The DIA studies have analysed sections histochemically stained by the widely used trichrome stain or by picrosirius red. Trichrome is a nonspecific stain for connective tissue components that has been widely used for routine fibrosis assessment, and picrosirius red is a stain primarily used to identify collagen. During the critical segmentation process of the digital image, the fibrotic areas are mainly distinguished from liver parenchyma and from the background by the identification of the colour. If the pixels of the fibrotic areas share the colour characteristics of the liver parenchyma, the process will assign similar label to pixels of these areas, creating an unreliable result. For this, colour and intensity used for staining fibrosis should significantly differ from the parenchyma, turning out digital images with more contrast and detail to facilitate the optimal thresholding by the software. Picrosirius red may generate better contrast difference between the collagen area and parenchyma, while the mottling and inconsistent colour tone and the lower contrast difference of trichrome may affect optimal thresholding, sometimes leading to technical artefacts which take time to eliminate manually. DIA method for liver fibrosis was shown to be highly reproducible by both picrosirius red (intra-class correlation coefficient (ICC) 0.970–0.999) [Citation6,Citation7] and trichrome stain (ICC 0.926–0.990) [Citation5,Citation14,Citation15]. We suggest that trichrome stain may be reasonable for routine purposes to determine the morphometric fibrosis content in clinical practice, where cost and time may preclude the use of picrosirius red or other stains like collagen immunohistochemistry stains in the pathology laboratories. Stains generating better contrast may be particularly valuable in investigating the fibrosis progression or regression by allowing more precise description of subtle changes in trials.
The directions of the pathologist are critical during the DIA process to exclude normal large portal tracts, or longitudinally cut portal tracts that can be mistaken for fibrous septa that should be discriminated from acquired portal fibrosis, as well as other collagenous structures unrelated with the fibrotic disease like the liver capsule and the blood vessels. These redundant fields should be removed from the digital image during morphometric assessment in order not to make an overdiagnosis for the fibrosis area or not to shadow DIA's discrimination ability of minor fibrosis changes in specimens from repeated biopsies.
Clinical implementation
The range of PA corresponding to each histopathological stage of liver fibrosis and the correlation of stages with PA values has been evaluated in different studies. The fibrosis quantity expressed as PA varied within a wide range within each stage, resulting in considerable overlap of PA values between adjacent, and even between the non-adjacent stages.[Citation5,Citation9] The reason is that histopathological systems are based on the evaluation of the pattern of architectural changes of fibrous tissue forming septa, bridges, or nodules without considering the nodule size, septal thickness or precise quantification of the extent of fibrosis as numerical data. Moderate to excellent correlations between fibrosis quantitity by PA and Ishak stages scores were reported by many previous studies.[Citation7,Citation14,Citation15] This statistical technique was criticized as an incorrect methodology [Citation16] since the number values assigned to the stages are categorical labels which are ordinal in nature and do not specifically represent a quantification in a numerical sense; e.g. Ishak stage 3 does not correspond to three times the fibrosis quantity of stage 1. Thus, numerical manipulation of these stage scores in statistical analysis is inappropriate and misleading.
The semiquantitative nature of histopathological stagings would inevitably result in heterogeneity of the fibrosis extent in similar stages of different studies making it difficult to draw a conclusion. Pathologist's subjective visual interpretation process makes a high level of reproducibility practically impossible in its application, even when consensus decisions are strictly performed. Thus, histopathological stagings may not serve as an ideal reference standard for validation of the non-invasive surrogates of fibrosis, like elasticity or serum parameters which themselves are continuous numerical variables. The relative imprecision can complicate the accuracy and cut-off assessments of these candidate methods. This may be one of the reasons for the discrepancy in elasticity cut-offs reported for discrimination of similar pathological stages from different studies. Therefore, a quantitative, numerical and reproducible approach (like the PA values) would be more appropriate as a histological correlate than a subjective and dichotomized categorization (absence or presence of ‘significant fibrosis’ or ‘cirrhosis’) to find out the true performances of non-invasive surrogates of fibrosis.
One reason for the increasing interest on computerized image morphometry in liver pathology is its obvious advantage to detect minor but potentially important amounts of fibrosis progression or regression over time or with treatment. Once thought to be irreversible, now several research has demonstrated the possibility of regression of liver fibrosis and even cirrhosis over time.[Citation17,Citation18] Using conventional histological staging to demonstrate the change in terms of one or more pathological stages would result in significant loss of information not allowing an accurate monitorization of the rate in fibrosis changes. Three studies assessing the histological assessment of fibrosis from interferon-treated chronic hepatitis C patients detected the change (reduction or increase) of fibrosis content only by image analysis quantification, while any significant score change could not be demonstrated by semiquantitative systems.[Citation9,Citation19,Citation20] In a cohort of patients with recurrent HCV hepatitis after liver transplantation fibrosis progression rate were histologically monitored, and quantitative measurement by CPA was found to be a better predictor of clinical decompensation than Ishak stage.[Citation8]
The most severe fibrosis category ‘cirrhosis’ is assigned as a single stage, but implies a very heterogeneous condition with a wide spectrum of clinical, histologic and hemodynamic aspects, leading to a highly variable prognosis with consequences such as PHT, hepatic encephalopathy and HCC at one end.[Citation21] With the current understanding, ‘cirrhosis’ is defined as a concept of dynamic process, rather than irreversible, ‘end-stage’ one.[Citation22,Citation23] The need for a sub-classification incorporating the histologic and hemodynamic aspects reflecting its progression, reversibility and prognosis within the perspective of a clinical-pathophysiological approach is emphasized.[Citation22] Conventional histopathological systems were not equipped for this requirement. The PA range corresponding to cirrhotic stage was shown to be dramatically wide in previous DIA studies (e.g. 44.1% TPA for Ishak F5-6 [Citation5] and 24.9% CPA with picrosirius red for Metavir F4 [Citation7]), which suggested that a measured PA value might promise as a predictive marker for decompensating events and in cirrhosis sub-classification. In some studies, the morphometric parameters like nodule size, septal thickness and PA were studied as clinical–pathological correlates and found to predict clinical decompensation [Citation24–27] and PHT measured by HVPG [Citation6,Citation25,Citation28].
Conclusions
We are arriving at a critical juncture in implementing the applications of digital technology in everyday practice of modern pathology such as whole slide scanning on a computer screen, digital archiving, image analysis, web accessibility for immediately consulting subspecialists’ opinion and efficient communication, which overall are expected to avoid medical errors, increase productivity, improve workflow, save time and cost, and thus offer an improvement of quality of health care.
In the light of increasing demand for an objective method not solely relying on pathologist's experience for the visual interpretation with a few steps of descriptive stage categories, digital imaging and analysis technique has been increasingly implemented in histopathological research of liver fibrosis. Potential advantages and applications of computerized image analysis of liver fibrosis include:
Provision of highly reproducible quantitative fibrosis ratio measurements expressed on a continuous arithmetic scale allowing to perform broader scale of statistical analysis and comparison between studies.
Digital fibrosis quantification appears to be optimal in monitoring the minor but potentially important quantity changes during fibrosis regression or progression between the sequential liver biopsies of pre- and post-treatment settings or in the natural course of disease. In particular, it is well suited for therapeutic trials to calculate the therapeutic benefit after antiviral or antifibrotic drugs.
DIA has the potential for becoming a promising tool within the new perspective of redefining and sub-classifying cirrhosis, since digital fibrosis ratio measurements seem to have prognostic and hemodynamic correlations in the cirrhosis setting.
Future research will address the role of digital fibrosis ratio cut-offs predicting subsequent clinical outcomes and linking to therapeutic and surveillance strategies (e.g. initiation of antiviral therapy, surveillance for PHT-induced or HCC) during the longitudinal follow-up of chronic liver disease patients in clinical settings.
More progress can be expected for the integration of non-invasive imaging techniques and serum markers into the clinical decision making process, as DIA measurements has been suggested to be a better histological reference standard than the categorical pathological stages to compare and reveal the validity and accuracy of available or new surrogates of fibrosis.
The implementation of computer image morphometry into routine clinical practice requires availability of resource allocation, participation of experienced technicians, additional time and financial cost. As a newly developed technology, it may take considerable time and effort for standardization and validation for complete readiness and full applicability to real clinical situations. Until present, there has been no consistency with respect to the design, equipment and set-ups being used for DIA of liver fibrosis in studies which makes the results difficult to compare. Liver fibrosis DIA algorithm is complex, and a close collaboration of skilled engineers and experienced pathologists is needed for standardization of all stages of the imaging chain for generation of outputs ensuring reproducible measurements: pre-imaging steps involving tissue sampling, histo-processing, sectioning, staining colour contrast and consistency; digital image acquisition steps involving microscope and camera characteristics and set-ups in order to sample a representative high resolution final image displayed on the computer monitor; digital image processing steps involving computer hardware and software components, ROI selection, accurate thresholding, minimization and elimination of artefacts.
Though PA assessment is clearly a distinct strategy from traditional histopathological systems, it does not involve fibrosis data beyond percentages such as the architectural patterns of fibrotic changes, rather it aids as a complementary tool at the point where the pathologist's eye does not perform well. Actual fibrosis state contains far more relevant information which cannot be minimized either only by a few steps of traditional histopathological stages or PA percentage data. Mathematical modelling of the patterns of liver fibrous architectural changes of pathophysiological relevance analysed by computer image morphometry may be anticipated as a new standard accelerating the progress in hepatology.
DIA_Review31012016_Supp_v1.1.docx
Download MS Word (172.1 KB)Disclosure statement
None.
Related Research Data
References
- Friedman SL. Mechanisms of hepatic fibrogenesis. Gastroenterology. 2008;134:1655–1669.
- Regev A, Berho M, Jeffers LJ, et al. Sampling error and intraobserver variation in liver biopsy in patients with chronic HCV infection. Am J Gastroenterol. 2002;97:2614–2618.
- Gonzalez RC, Woods RE. Digital image processing. 2nd ed. Upper Saddle River (NJ): Prentice Hall Prentice Hall; 2002.
- Banks S. Signal processing, image processing and pattern recognition. Englewood Cliffs (NJ): Prentice-Hall; 1990.
- Yegin EG, Yegin K, Karatay E, et al. Quantitative assessment of liver fibrosis by digital image analysis: relationship to Ishak staging and elasticity by shear-wave elastography. J Dig Dis. 2015; 16:217–227.
- Calvaruso V, Burroughs AK, Standish R, et al. Computer-assisted image analysis of liver collagen: relationship to Ishak scoring and hepatic venous pressure gradient. Hepatology. 2009;49:1236–1244.
- Huang Y, de Boer WB, Adams LA, et al. Image analysis of liver collagen using sirius red is more accurate and correlates better with serum fibrosis markers than trichrome. Liver Int. 2013;33:1249–1256.
- Manousou P, Burroughs AK, Tsochatzis E, et al. Digital image analysis of collagen assessment of progression of fibrosis in recurrent HCV after liver transplantation. J Hepatol. 2013;58:962–968.
- Goodman ZD, Becker RL, Pockros PJ, et al. Progression of fibrosis in advanced chronic hepatitis C: evaluation by morphometric image analysis. Hepatology. 2007;45:886–894.
- Fontana RJ, Goodman ZD, Dienstag JL, et al. Relationship of serum fibrosis markers with liver fibrosis stage and collagen content in patients with advanced chronic hepatitis C. Hepatology. 2008;47:1–10.
- Xu S, Wang Y, Tai DC, et al. qFibrosis: a fully-quantitative innovative method incorporating histological features to facilitate accurate fibrosis scoring in animal model and chronic hepatitis B patients. J Hepatol. 2014;61:260–269.
- Colloredo G, Guido M, Sonzogni A, et al. Impact of liver biopsy size on histological evaluation of chronic viral hepatitis: the smaller the sample, the milder the disease. J Hepatol. 2003;39:239–244.
- Bedossa P, Dargère D, Paradis V. Sampling variability of liver fibrosis in chronic hepatitis C. Hepatology. 2003;38:1449–1457.
- Campos CF, Paiva DD, Perazzo H, et al. An inexpensive and worldwide available digital image analysis technique for histological fibrosis quantification in chronic hepatitis C. J Viral Hepat. 2014;21:216–222.
- Lazzarini AL, Levine RA, Ploutz-Snyder RJ, et al. Advances in digital quantification technique enhance discrimination between mild and advanced liver fibrosis in chronic hepatitis C. Liver Int. 2005;25:1142–1149.
- Standish RA, Cholongitas E, Dhillon A, et al. An appraisal of the histopathological assessment of liver fibrosis. Gut. 2006;55:569–578.
- Arthur MJP. Reversibility of liver fibrosis and cirrhosis following treatment for hepatitis C. Gastroenterology. 2002; 122:1525–1528.
- Arif A, Levine RA, Sanderson SO, et al. Regression of fibrosis in virological nonresponders with chronic hepatitis C after therapy with interferon and ribavirin. Dig Dis Sci. 2003;48:1425–1430.
- Caballero T, Perez-Milena A, Masseroli M, et al. Liver fibrosis assessment with semiquantitative indexes and image analysis quantification in sustained-responder and non-responder interferon-treated patients with chronic hepatitis C. J Hepatol. 2001;34:740–747.
- Manabe N, Chevallier M, Chossegros P, et al. Interferon-alpha 2b therapy reduces liver fibrosis in chronic non-A, non-B hepatitis: a quantitative histological evaluation. Hepatology. 1993;18:1344–1349.
- D'Amico G, Garcia-Tsao G, Pagliaro L. Natural history and prognostic indicators of survival in cirrhosis: a systematic review of 118 studies. J Hepatol. 2006;44:217–231.
- Hytiroglou P, Snover DC, Alves V, et al. Beyond "cirrhosis": a proposal from the International Liver Pathology Study Group. Am J Clin Pathol. 2012;137:5–9.
- Garcia-Tsao G, Friedman S, Iredale J, et al. Now there are many (stages) where before there was one: in search of a pathophysiological classification of cirrhosis. Hepatology. 2010;51:1445–1449.
- Tsochatzis E, Bruno S, Isgro G, et al. Collagen proportionate area is superior to other histological methods for sub-classifying cirrhosis and determining prognosis. J Hepatol. 2014;60:948–954.
- Sethasine S, Jain D, Groszmann RJ, et al. Quantitative histological hemodynamic correlations in cirrhosis. Hepatology. 2012;55:1146–1153.
- Viola A, Jain D, Garcia-Tsao G. 233 Quantitative histological assessment in cirrhosis: septal thickness predicts clinical decompensation [ abstract]. J Hepatol. 2009;50:S94.
- Kutami, R, Girgrah, N, Wanless, IR, et al. The Laennec grading system for assessment of hepatic fibrosis: validation by correlation with wedged hepatic vein pressure and clinical features [abstract]. Hepatology. 2000;32:407A.
- Calvaruso V, Dhillon AP, Tsochatzis E, et al. Liver collagen proportionate area predicts decompensation in patients with recurrent hepatitis C virus cirrhosis after liver transplantation. J Gastroenterol Hepatol. 2012;27:1227–1232.