
ABSTRACT
Ramie (Boehmeria nivea L. Gaud) is one of the most important natural fibre crops. For enhanced crop development, it is necessary to understand its population structure and genetic relationships. In this study, we assessed the genetic diversity and population structure of 134 ramie accessions (with three plants per accession) from 12 regions by using 36 simple sequence repeat markers. The 36 microsatellite primers revealed 149 alleles in 134 ramie populations, with an average of 4.14 alleles per locus. The structure analysis divided the 134 ramie accessions into three groups (I, II and III), and into further six subgroups (a, b, c, d, e and f). In Subgroup b, 13 accessions were from Guizhou Province, 9 accessions were from Sichuan Province and the remaining 20 accessions were from Chongqing (4), Hunan (8), Guangxi (4), Jiangxi (2), Yunan (1) and Taiwan (1). In Subgroup d, 22 accessions were from Guizhou Province and the remaining 17 accessions were from Chongqing (6), Sichuan (5) and Yunnan (6). It can be inferred that the genetic background of these ramie accessions did not always correlate with their geographical regions. Similar results were found in Subgroups a and f. The pair-wise genetic similarity coefficients between the 134 accessions ranged from 0.390 to 0.939, which suggested that there was abundant genetic diversity in the ramie accessions. These markers have provided important information about the genetic structure of ramie, which can contribute to future breeding and improvement programmes for these resources.
Introduction
Ramie (Boehmeria nivea, Urticaceae; common name China grass) is one of the oldest and most important fibre crops, as it has been used for thousands of years [Citation1]. It is a perennial diploid (2n = 28) herbaceous plant, and the fibres stripped from the stem bast are smooth, long and with very good tensile strength. It is due to the high fibre quality that ramie is such a widely cultivated fibre crop in China, India and other South-East Asian and Pacific Rim countries, ranking second only to cotton in terms of growth area and quantity of fibre production in China [Citation2]. Ramie also finds application as a forage crop in China as well as in soil and water conservation in the Yangtze region, in the south of China [Citation3].
Genetic variability in natural populations is crucial for their evolutionary fitness and ecological adaptation [Citation4], whereas, in cultivated populations, the diversity is crucial for their genetic improvement [Citation5]. According to Vavilov [Citation6], the domestication of ramie took place in central and western China. Others have reported that ramie originated from the middle and lower reaches of the Yellow River based on the distribution of wild resources and historical data [Citation7]. However, the exact geographic region of domestication has not been identified yet [Citation8]. Today, the loss of ramie from its most important natural habitat in China and the need to effectively utilize its genetic resources in crop improvement, highlight the study of the genetic diversity of this species as fundamental.
To assess the genetic diversity in various crops, several molecular marker techniques are widely employed. For example, single nucleotide polymorphism in Miscanthus [Citation9], restriction fragment length polymorphism in rice [Citation10], amplified fragment length polymorphism (AFLP) in sesame [Citation11], random amplified polymorphic DNA (RAPD) in bean [Citation12] and simple sequence repeats (SSR) [Citation13] in switchgrass have all been used on a large scale, and there are different marker systems for studying the genetic diversity in different contexts [Citation14]. In addition, SSR markers have been widely used in genetic mapping and marker-assisted selection [Citation15,Citation16]. What makes SSRs such a powerful tool for genetic diversity studies is that SSRs have a high level of reproducibility, codominant nature and abundance [Citation17–23]. Therefore, to date, SSR markers have been utilized to determine the genetic diversity in ramie. Zhou et al. [Citation24] determined the genetic relationship between 20 cultivars using SSR. Meng et al. [Citation25] examined the genetic relationship between 38 and 13 wild germplasms of ramie with inter simple sequence repeat (ISSR) and RAPD markers, respectively. Liu et al. [Citation26,Citation27] evaluated 40 inbred lines of ramie by using sequence-related amplified polymorphism (SRAP) and ISSR markers. SSRs and SRAP were employed to assess the genetic diversity and relationship among 108 ramie cultivars [Citation28]. There are about 2000 ramie resources stored in the National Ramie Germplasm Nursery; however, the genetic diversity and population structure of most of them have not been described by using molecular marker techniques. In previous studies, the number of the used cultivars was less than 110. For better genetic evaluation of ramie, it is necessary to speed up the studies on the diversity and variability of ramie resources by using molecular marker techniques.
The aim of this study was to apply SSR markers to study the genetic diversity and population structure of 134 ramie accessions, which have originated from China, in different regions. The objectives of this research were to investigate the population structure and assess the genetic relationships among these ramie germplasms. This information would contribute to understanding the genetic relationship between different accessions, providing basic data for choices of ramie breeding material.
Materials and methods
Plant materials
A total of 134 ramie accessions () were provided by the Institute of Bast Fiber Crops, Chinese Academy of Agricultural Sciences. These accessions included 36 ones from Guizhou Province, 24 ones from Hunan Province, 18 ones from Sichuan, 14 ones from Hubei province, 12 ones from Chongqing, 10 ones from Jiangxi, 9 ones from Guangxi, 7 ones from Yunnan Province and another 4 accessions from Shanxi, Taiwan, Hainan and Jiangsu, respectively. The accessions were selected on the basis of diverse geographical location for genetic diversity and population structure analysis. Three individual plants of each accession, totalling 402 individuals, were sampled and used for polymorphism investigations of selected SSR markers.
Table 1. List of the ramie accessions used in this study.
DNA extraction
DNA was extracted from fresh leaves of 402 individuals, representative of 134 accessions. A plant genomic DNA kit (Tiangen, Bejing, China) was used. Before polymerase chain reaction (PCR), the DNA samples were diluted to a DNA concentration of 50 ng/μL with sterile double distilled H2O.
SSR genotyping
Primers from a previous study were downloaded for BLAST (Basic Local Alignment Search Tool) comparison [Citation2]. Thirty-six SSR primers distributed in different linkage groups were selected for SSR genotyping (). PCR was performed using the following programme: 94 ℃ for 3 min, 32 cycles of 94 ℃ for 25 s, 55 ℃ for 25 s, 72 ℃ for 35 s, and a final elongation step of 72 ℃ for 5 min, on a MyCycler Thermal Cycler (BioRad, Shanghai, China). The PCR products were separated in 8% polyacrylamide gels and silver dyeing was conducted according to Zhang et al. [Citation29].
Table 2. SSR markers assayed in the characterization of ramie accessions.
Data analysis
Molecular diversity analysis
The amplified bands were scored as present (1) or absent (0) and only reproducible bands were considered. The polymorphic information content (PIC), the number of alleles per locus (Na), observed heterozygosity (Ho), expected heterozygosity (He) and Shannon index (I) were calculated as previously described [Citation30].
Genetic similarity coefficient and cluster analysis
The genetic similarity coefficient comparing all pairs of the 134 ramie accessions was calculated according to Nei and Li [Citation31] using the similarity coefficient Sij = 2a/(2a + b + c), in which Sij is the similarity between two individuals, i and j; a is the number of shared bands; b is the number of bands exclusive to i; c is the number of bands exclusive to j. The similarity matrix was first subjected to cluster analysis using the un-weighted pair group method with arithmetic mean (UPGMA) [Citation32], and a tree was constructed by NTsys [Citation33].
Population structure analysis
A model-based approach implemented in the software program STRUCTURE v2.2 was used to subdivide the individuals into different subgroups [Citation34]. We used the ad hoc measure △K [Citation35] to estimate the number of groups. The membership of each genotype was tested for the range of genetic clusters from K = 1 to K = 8 (each with 10 independent runs) with the admixture model.
Results and discussion
Genetic diversity and population structure analyses of germplasm resources can not only reveal the genetic characteristics of the resources and provide information for breeder selection, but can also be one of the important approaches for discovery of new genes. Morphological markers [Citation36], cytological markers [Citation37] and isozyme markers [Citation38] have been used by both domestic and foreign scholars to analyse the genetic diversity of ramie; however, in recent years, molecular marker techniques have become the most important approach for analysis of the genetic diversity of germplasm resources. Diversity analysis at the molecular level using PCR-based markers is the cheapest and fastest method of identifying the relationships among the genotypes. Since SSRs can be easily detected by PCR, they have been used for genetic diversity assessment, germplasm identification, genetic mapping, DNA fingerprinting and marker-assisted selection [Citation21,Citation25,Citation27,Citation28]. However, reports on the utilization of SSR in ramie studies such as genetic diversity assessment are limited. In a previous study, Zhou et al. [Citation24] used SSRs, ISSRs and RAMP(random amplified microsatellite polymorphism) to determine the genetic relationships among 20 cultivars of ramie and observed that all of the approaches were able to uniquely fingerprint each of the cultivars. SSRs were employed to assess the genetic diversity and relationship among 108 ramie cultivars [Citation28]. SSR markers can be the tool of choice for genetic diversity analysis and cultivar fingerprinting in ramie accessions. Thus, in this study, we used the SSR molecular marker technique to gain better understanding of the diversity and variability of ramie resources.
SSR analysis of 134 accessions
The 36 microsatellite primer pairs revealed 149 alleles in 134 ramie populations as shown in . It also gives details about the polymorphism levels. The number of alleles per microsatellite ranged from 2 to 11 with an average of 4.14 alleles per locus. The He and Ho values ranged from 0.0997 to 0.7884 (with a mean of 0.4992) and from 0.3284 to 1.0000 (with a mean of 0.8056), respectively. To measure the informativeness of these markers, the polymorphic information content (PIC) for each SSR locus was calculated. The PIC values were calculated for each SSR in the 134 ramie accessions (). This value ranged from 0.0960 to 0.7661, with the average being 0.4504. Based on the PIC value, the most informative locus was RAM340, which had the highest PIC value (0.7661). The genetic diversity revealed by SSR loci was supported by the observed high values of Na, He and PIC. The average of 4.14 alleles per primer pair observed () was higher than that seen in previous studies in ramie [Citation28]. Similarly, the He and PIC values of 0.4992 and 0.4504, respectively, were higher compared with those of other accessions of ramie previously studied using SSR markers [Citation24,Citation28]. High values of all diversity indicators are considered to show allelic richness in the analysed germplasm, which can be used in breeding programmes targeted at specific plant types for commercial cultivation [Citation39]. Because of the large number and diversity of investigated individuals, the number of alleles identified in the present study is relatively larger than that in other studies [Citation24,Citation28], which is in line the observations made by Belaj et al. [Citation40]. Overall, the 36 SSR markers were fairly successful for construction of a specific fingerprint of the 134 ramie accessions. The most informative alleles and highest PIC value indicated that these SSRs could be applied to assess the genetic diversity in ramie germplasm in this study. The SSR markers from this study with high polymorphism will be a useful resource for the identification of ramie and for further genetic study.
Population structure analysis in the panel of 134 ramie accessions
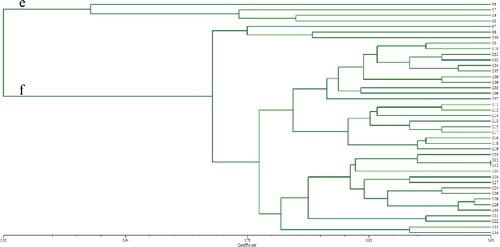
All accessions were clustered into three large groups based on UPGMA analysis using a similarity matrix (), which were designated as I, II and III. Among the three distinct groups, Group I contained 52 ramie accessions mostly from southwestern and central China, Group II contained 40 ramie accessions from southwestern China and Group III contained 42 ramie accessions from central China. Furthermore, Group I was subdivided into Subgroups a and b (); Subgroup a contained 10 ramie accessions from Sichuan (4), Guangxi (4), Chongqing (1) and Shanxi (1), and Subgroup b contained 42 ramie accessions from Sichuan (9), Chongqing (4), Guizhou (13), Hunan (8), Guangxi (4), Yunan (1), Jiangxi (2) and Taiwan (1). Group II was subdivided into Subgroups c and d (); Subgroup c contained one accession and Subgroup d contained 39 accessions, 22 ones from Guizhou and the remaining 17 ones from Chongqing (6), Sichuan (5) and Yunnan (6). Group III was subdivided into Subgroups e and f (). Subgroup e contained 4 accessions were from Hubei, whereas Subgroup f contained 38 accessions, 17 ones from Hunan and the remaining 21 accessions from Hubei (10), Jiangxi (8), Guizhou (1), Jiangsu (1) and Hainan (1). Regarding the geographical regions for cultivation, of the 134 ramie accessions, 28% originated from Guizhou, 18% from Hunan, 14% Sichuan, 8% from Chongqing, etc. It was also observed that a few accessions in each subgroup were not grouped in agreement with their geographical origins, e.g. Subgroup b. The Yunan (1) and Taiwan (1) populations were located in the same subgroup, and it is difficult to explain the particularity of the two populations, but it might be related to the geographical environment. As previously suggested, this phenomenon could be due to germplasm exchange across boundaries [Citation41]. The results indicated that the relationship between ramie germplasms and the geographic distribution was poor, which was in agreement with previous research [Citation42]. Zou et al. [Citation43] also confirmed that the relationship between ramie germplasms was not consistent with their geographical origin.
Figure 1. Dendrogram for a reference set of 134 ramie accessions based on the allelic data of 36 SSRs.
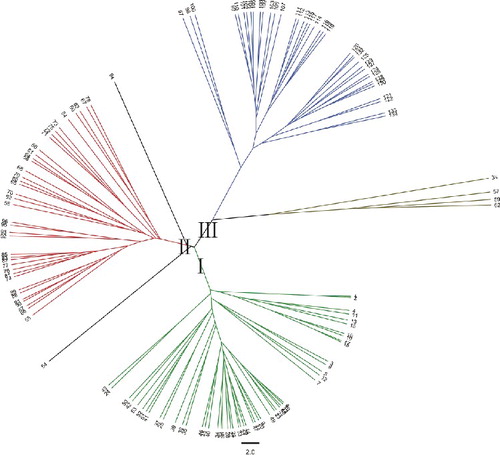
Figure 2. Dendrogram of 52 ramie accessions from Group I based on the allelic data of 36 SSRs.
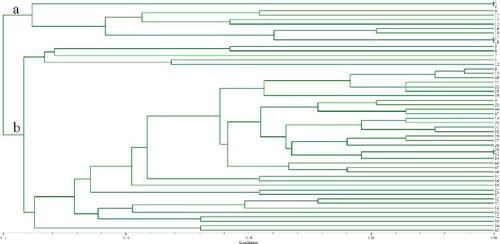
Figure 3. Dendrogram of 40 ramie accessions from Group II based on the allelic data of 36 SSRs.
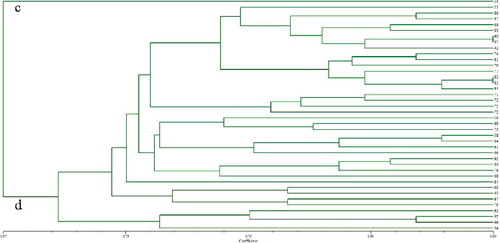
Figure 4. Dendrogram of 42 ramie accessions from Group III based on the allelic data of 36 SSRs.
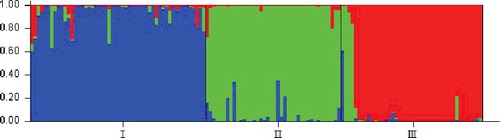
Similar results were shown by the STRUCTURE program (for K = 2–8) based on the distribution of the 36 SSR markers among the 402 individuals (). Based on the maximum likelihood and delta K (△K) values, there were three optimal groups (). The 402 individual samples representative of the 134 ramie accessions were assigned to Groups I, II and III. Among them, Group I included 150 individuals for 50 accessions; Group II contained 126 individuals for 42 accessions and the remaining 126 individuals for other 42 accessions were assigned to Group III. Similar to reports on the genetic structure other species [Citation39], the results also showed some admixture of accessions within each group, which was more pronounced in Group I and II than in Group III. The results of the structure analysis with the division into groups and subgroups indicated significant genetic variation. However, not all the local ramie accessions were clustered into one group. That is, similar to observations made in other fibre crops, e.g. Jute (Corchorus spp.) [Citation41], the genetic background of the 134 ramie accessions studied by us was not always correlative with their geographical regions. This may be due to mutual introduction for a long time, which may have generated variation in different ecological conditions.
Figure 5. Three subpopulations among reference set accessions of ramie identified by structure analysis.
Similarity coefficient among the 134 ramie accessions
To reveal the genetic differences of diverse genotypes, a genetic similarity coefficient analysis among all pairs of the 134 ramie accessions was conducted on the basis of Nei's analysis (). The pair-wise genetic similarity coefficients between the 134 accessions ranged from 0.390 to 0.939 (), which suggested that there was an abundant genetic diversity in the ramie accessions growing in the National Ramie Germplasm Nursery. Interestingly, the lowest similarity coefficient of 0.390 was between Qichunhuangjian and Enshiqingma, both from Hubei, whereas the highest one (0.939) was between Guangxihongdouma and Bazhongqingganma, indicating a close inter-relationship between them, despite that these two accessions were from Guangxi and Chongqing, respectively. This could possibly be attributable to the fact that there is frequent interchange of alleles between different species in these two different areas. The Nei's genetic clustering results showed that there was no significant correlation between the genetic relationship and regional distribution of ramie germplasm resources. This may be related to frequent transmission and exchange of accessions among different regions.
Table 3. Genetic similarity coefficient in the ramie groups and subgroups.
To further describe the relationship between different groups, we re-analysed the clustering and genetic difference for each group. In Group I, the genetic similarity coefficient ranged from 0.598 to 0.939, with an average of 0.770 (), and the lowest average genetic similarity coefficient was observed in Qingyangjiama and Shanyangzhuma (0.598). In Group II, the pair with the lowest genetic similarity coefficient (0.573) was Wuxilongdianxianma and Bailuxianma No.1. This indicated that these accessions, like Qichunhuangjian and Enshiqingma (0.390), could be used as potential parents for future breeding programmes for ramie improvement. In cross-breeding programmes, elite varieties are known to be generated between parental accessions with obvious genetic background differences. Thus, it is of key importance to understanding the genetic relationships for the purposes of crop improvement. Therefore, the present study demonstrated that there were a large number of genetic differences among the ramie resources from the same or different regions, which would provide a good theoretical basis for molecular marker-assisted breeding of ramie.
Conclusions
Based on the population structure analysis using 36 SSRs, the 134 studied ramie accessions were divided into three groups (I, II and III) and further into a six subgroups (a, b, c, d, e and f). These markers have provided important information about the genetic structure of ramie, which can contribute to future breeding and improvement programmes for these resources. In short, these results demonstrated the value of the ramie accessions as an important resource for conducting genetic diversity studies and assisting in future conservation and research programmes. As a next step, we hope to cultivate new ramie breeding materials by using the genetic diversity characteristics of these ramie resources.
Disclosure statement
No potential conflict of interest was reported by the authors.
Additional information
Funding
References
- Sen T, Reddy HNJ. Various industrial applications of hemp, kinaf, flax and ramie natural fibres. Int J Innov Manage Technol. 2011;2:192–198.
- Liu TM, Zhu SY, Fu L, et al. Development and characterization of 1827 expressed sequence tag-derived simple sequence repeat markers for ramie (Boehmeria nivea L. Gaud). PLos ONE. 2013 [ cited 2013 Apr 2];8(4):e60346. Available from: http://dx.doi.org/10.1371/journal.pone.0060346
- Xiong H. The production status and policy suggestion of bast and leaf fiber crops in China. Plant Fiber Sci China. 2010;32:301–304.
- Poczai P, Varga I, Hyvonen J, et al. Genomics meets biodiversity: advances in molecular marker development and their applications in plant genetic diversity assessment. In: Caliskan M, editor. The molecular basis of plant genetic diversity. Rijeka (Croatia): InTech; 2012. p. 3–32.
- Satya P, Karan M, Jana S, et al. Start codon targeted (SCoT) polymorphism reveals genetic diversity in wild and domesticated populations of ramie (Boehmeria nivea L. Gaudich.), a premium textile fiber producing species. Meta Gene. 2015;3:62–70.
- Vavilov NI. Origin and geography of cultivated plants. New York (NY): Cambridge University Press; 1992.
- Zhao CY, Li JS, Shu Z, et al. Evaluation and utilization of resources of ramie in Qinba mountain area. Acta Agric Bor Occid Sin. 1999;8:116–118.
- Liao L, Li T, Zhang J, et al. The domestication and dispersal of the cultivated ramie (Boehmeria nivea (L.) Gaud.inFreyc.) determined by nuclear SSR marker analysis. Genet Resour Crop Evol. 2014;61:55–67.
- De Cesare M, Hodkinson TR, Barth S. Chloroplast DNA markers (cpSSRs,SNPs) for Miscanthus, Saccharum and related grasses (Panicoideae, Poaceae). Mol Breed. 2010;26:539–544.
- Sun CQ, Wang XK, Li ZC, et al. Comparison of the genetic diversity of common wild rice (Oryza rufipogon Griff.) and cultivated rice (O. sativa L.) using RFLP markers. Theor Appl Genet. 2001;102:157–162.
- Uzun B, Lee D, Donini P, et al. Identification of a molecular marker linked to the closed capsule mutant trait in sesame using AFLP. Plant Breed. 2003;122:95–97.
- Basheer-Salimia R, Shtaya M, Awad M, et al. Genetic diversity of Palestine landraces of faba bean (Vicia faba) based on RAPD markers. Genet Mol Res. 2013;12(3):3314–3323.
- Wang YW, Samuels TD, Wu YQ. Development of 1,030 genomic SSR markers in switchgrass. Theor Appl Genet. 2011;122:677–686.
- Tam SM, Mhiri C, Vogelaar A, et al. Comparative analyses of genetic diversities within tomato and pepper collections detected by retrotransposon-based SSAP, AFLP and SSR. Theor Appl Genet. 2005;110:819–831.
- Yu J, Ulloa M, Hoffman S, et al. Mapping genomic loci for cotton plant architecture, yield components, and fiber properties in an interspecific (Gossypium hirsutum L. x G. barbadense L.) RIL population. Mol Genet Genomics. 2014;289:1347–1367.
- Hashemi F, Rafii M, Ismail M, et al. Opportunities of marker-assisted selection for rice fragrance through marker-trait association analysis of microsatellites and gene-based markers. Plant Biol. 2015;17:953–961.
- Chen C, Bock C, Beckman T. Sequence analysis reveals genomic f actors affecting EST-SSR primer performance and polymorphism. Mol Genet Genomics. 2014;289:1147–1156.
- Jiang Q, Wang F, Tan H, et al. De novo transcriptome assembly, gene annotation, marker development, and miRNA potential target genes validation under abiotic stresses in Oenanthe javanica. Mol Genet Genomics. 2015;290:671–683.
- Tan C, Wu Y, Taliaferro C, et al. Development and characterization of genomic SSR markers in Cynodon transvaalensis Burtt-Davy. Mol Genet Genomics. 2014;289:523–531.
- Zhang M, Jiang L, Zhang D, et al. De novo transcriptome characterization of Lilium ‘Sorbonne’ and key enzymes related to the flavonoid biosynthesis. Mol Genet Genomics. 2015;290:399–412.
- Chen J, Luan M, Song S, et al. Isolation and characterization of EST-SSRs in the Ramie. Afr J Microbiol Res. 2011;5:3504–3508.
- Kundu A, Topdar N, Sarkar D, et al. Origins of white (Corchorus capsularis L.) and dark (C. olitorius L.) jute: a reevaluation based on nuclear and chloroplast microsatellites. J Plant Biochem Biotechnol. 2013;22:372–381.
- Banerjee S, Das M, Mir R, et al. Assessment of genetic diversity and population structure in a selected germplasm collection of 292 jute genotypes by microsatellite (SSR) markers. Mol Plant Breed. 2012;3:11–25.
- Zhou J, Jie Y, Jiang Y, et al. Genetic relation analysis on ramie cultivars with microsatellite markers. Acta Agron Sin. 2003;30:289–292.
- Meng ZQ, Liu LJ Peng DX. Analysis on genetic diversity of ramie (Boehmeria nivea L. Gaud.) wild germplasm by RAPD and ISSR markers. Mol Plant Breed. 2009;7:365–370.
- Liu LJ, Peng DX, Wang B. Genetic relation analysis on Ramie [Boehmeria nivea (L.) Gaud.] inbred lines by SRAP markers. Agric Sci China. 2008;7:944–949.
- Liu LJ, Wang XX, Wang B, et al. Analysis of genetic relationship of ramie (Boehmeria nivea) inbred line clones as revealed by ISSR. Sci Agric Sin. 2011;44:1543–1552.
- Luan MB, Zou ZZ, Zhu J, et al. Genetic diversity assessment using simple sequence repeats (SSR) and sequence-related amplified polymorphism (SRAP) markers in ramie. Biotechnol Biotechnol Equip. 2015;29:624–630.
- Zhang J, Wu YT, Guo WZ, et al. Fast screening of microsatellite markers in cotton with PAGE/silver staining. Acta Gossypii Sin. 2000;12(5):267–269.
- Chung JW, Kim TS, Suresh S, et al. Development of 65 novel polymorphic cDNA-SSR markers in common vetch (Vicia sativa subsp. sativa) using next generation sequencing. Molecules. 2013;18:8376–8392.
- Nei M, Li W. Mathematical model for studying genetic variation in terms of restriction endonucleases. Proc Natl Acad Sci USA. 1979;76:5269–5273.
- Sneath PHA, Sokal RR. Numerical taxonomy. The principles and practice of numerical classification. San Francisco: W.H. Freeman and Co.; 1973.
- Rohlf F. NTSYS-pc. Numerical taxonomy and multivariate analysis system. Version 2.10. New York (NY): Exeter Software; 2002.
- Pritchard J, Stephens M, Donnelly P. Inference of population structure using multilocus genotype data. Genetics. 2000;155:945–959.
- Evanno G, Regnaut S, Goudet J. Detecting the number of clusters of individuals using the software STRUCTURE: a simulation study. Mol Ecol. 2005;14:2611–2620.
- Zhang B, Zheng CQ, Zang GG, et al. The comparative morphology of Boehmeria in China. Agric Sci China. 1998;31(2):56–60.
- Zang GG. A karyological study on five species in three section of genus Boehmeria. China Fiber Crops. 1993;1:65–70.
- Hu N, Guo Q. A first study on the evolution of ramie peroxidase isozymes. J Nat Sci Hunan Norm Univ. 1991;14(1):73–75.
- Wu F, Zhang DY, Ma JX, et al. Analysis of genetic diversity and population structure in accessions of the genus Melilotus. Ind Crops Prod. 2016;85:84–92.
- Belaj A, Muñoz-Diez C, Baldoni L, et al. Genetic diversity and population structure of wild olives from the north-western Mediterranean assessed by SSR markers. Ann Bot. 2007;100(3):449–458.
- Zhang LW, Yuan MH, Tao AF, et al. Genetic structure and relationship analysis of an association population in jute (Corchorus spp.) evaluated by SSR markers. PLos ONE. 2015 [ cited 2015 Jun 2];10(6):e0128195. Available from: http://dx.doi.org/10.1371/journal.pone.0128195
- Luan MB, Zou ZZ, Zhu J, et al. Development of a core collection for ramie by heuristic search based on SSR markers. Biotechnol Biotechnol Equip. 2014;28:798–804.
- Zou ZZ, Chen JH, Luan MB. Evaluation of genetic relationship in ramie based on RSAP, SRAP, and SSR. Acta Agron Sin. 2012;38:840–847.