
ABSTRACT
The aim of this study was to investigate the relationship between the composition and state of erythrocytic lipids and oxygen-binding properties of erythrocyte haemoglobin-derived haematoporphyrin under hypoxia. The results from this study showed that hypoxia causes a profound change in the composition of the lipids that form the bilayer of erythrocyte membranes, as well as in the functional characteristics of erythrocytes. The detected changes correlate with morphological reconstruction of erythrocytes and, consequently, affect the oxygen-transport properties of erythrocytes. The obtained results showed that the lipid phase plays an important role in the functioning of erythrocytes in health as well as in event of development of ischemic heart disease and other pathological processes that accompany hypoxia.
Introduction
The functional activity of erythrocytes is determined by their capacity to perform gas-transport function, which highly depends on the biological membranes of erythrocytes. The functional activity of erythrocytes is attributed to their deformability and aggregation potential, which characterizes the ability of blood cells to penetrate the microcirculatory bloodstream to perform gas exchange Citation[1–3].
In this regard, the research into the mechanisms that change the functional properties of erythrocytes under hypoxia followed by oxygen-transport deficiency in the tissues is quite topical. It is especially important to study these mechanisms because any disorder in the oxygen-transport capacity of haemoglobin (Hb) consequently results in impairment of the oxygen-carrying capacity of blood. The efficiency of oxygen transfer by erythrocytes depends on the overall condition of the human body and is accompanied by changes in the morphology and cell volume, viscosity and permeability of the erythrocyte plasma membrane.
Different pathologies cause changes in the amount, distribution and conformation of Hb Citation[4–7]. Many pathological states are accompanied by development of hypoxia. Works devoted to description of the changes that erythrocytes undergo during hypoxia are numerous, but the role of the most important components of erythrocyte membranes, the lipids, especially phospholipids, and the free fatty acids (FFAs) is insufficiently studied Citation[8–10].
The varied composition and physico-chemical properties of lipids depend on the degree of saturation, acyl groups oxidation and presence of charged phospholipids. The study of lipid composition and state will help to understand their involvement in the functioning of erythrocytes and, in particular, in the regulation of the oxygen-transport capacity of Hb under hypoxia. The state of the erythrocyte membranes has bearing on their morphological characteristics (surface area, diameter, volume) and on the intracellular distribution of Hb Citation[11]. The changed morphometric parameters of erythrocytes entails, in turn, changes in Hb conformation in general and in particular its haematoporphyrin (HP) and, as a consequence, a change in the oxygen-binding and oxygen-transport abilities of erythrocyte Hb.
Based on the above, the aim of this work was to study the relationship between the composition and state of erythrocyte lipids, and the oxygen-binding properties of Hb-derived HP in erythrocytes under.
Materials and methods
Blood samples
Donors were 27 healthy men aged between 27 and 37 who, at the time of survey, had no history of cardiovascular disease. Blood samples from the healthy donors were obtained from Mordovian Republican Station of Blood Transfusion in Saransk city. The average haematological parameters of the donors were: red blood cells (RBC) of (4.86 ± 0.08)×1012 /L; Hb of 149.2 ± 5.69 g/L.
The research was approved by the Local Ethics Board at Mordovia State University in accordance with the principles of Good Clinical Practice. Informed consent statements were signed by all donors to participate in the experiment.
Blood sampling procedure
Blood (5 mL) was aseptically taken from the cubital vein of fasted donors and was centrifuged for 15 min at 1500 g. The supernatant was removed. The sediment served for preparation of erythrocyte suspension. Natural saline solution was added to this suspension at a rate of 3:1. The final mixture was centrifuged for 5 min at 1500 g. The final suspension of erythrocytes was used for further work.
Hypoxia model
To create a model of hypoxia, we used a special camera and 2.0 mL of erythrocyte suspension, which was saturated with nitrogen. The exposure time was 10, 20 and 30 min.
Extraction of lipids
Extraction of lipids from erythrocytes was performed by the Bligh–Dyer method Citation[12]. One millilitre of erythrocyte mass was homogenized in 3 mL mixture of chloroform/methanol/water (1/2/0.8 as per volume). The final homogenate was poured into a glass-stoppered flask, bringing the total volume to 10 mL. In 1 h, the content was filtered through a folded filter. The flask was rinsed with 5 mL of the above mixture and filtered again. To separate any water-soluble impurities, we added 4 mL of chloroform and 4 mL of water in the final mixture, shook it and centrifuged for 15 min at 1500 g.
In these conditions, the solution is divided into two phases: the upper one is aqueous-methanol containing water-soluble components, the white film at the border of phases is proteolipids and the lower phase is the chloroform one containing the lipids. The lower fraction was carefully separated and poured into a pre-weighed evaporating flask.
The extraction of lipids by the above method was carried out at low temperature (4°C). The final extract in the evaporating flask was evaporated on a rotary evaporator to a constant weight in a current of nitrogen. The resulting lipids were dissolved in a mixture of chloroform/methanol (2/1 by volume) to a concentration of 20 mg/mL. Lipids were stored at low temperature (-20°C) in nitrogen atmosphere.
High-performance thin layer chromatography (HPTLC)
Chromatographic separation was carried out in a thin layer of silica gel deposited on a glass plate Citation[13–15]. We used standard HPTLC Silicagel plates 60 F254 (Merck, Darmstadt, Germany) as well as ones prepared in the laboratory. To separate lipids, we used chromatographic chambers. The walls inside were lined with filter paper to accelerate the saturation of the solvent vapours. Solvents in chambers were prepared for 1–1.5 h prior to analysis. Samples intended for separation were applied by an automatic applicator AutomaticTCL-Sanipler 4 (Gamag, Muttenz, Switzerland) at a distance of 0.7–1 cm from the edges of the plate in 20 μL in the form of a strip (one-dimensional separation). For the separation of phospholipids, one-dimensional chromatography was used in the solvent system: chloroform/methanol/glacial acetic acid/water (50:25:8:4, v/v). One camera had no more than two plates at a time, and in such a way that the substrate surface was facing the camera lining paper, and the layers of adsorbent were at a maximum distance apart from each other. The plates were warmed up for 30 min at 110–120°C before applying.
After applying the samples, the plate was placed into a chromatography chamber. The separation was over when the front of solvents was near to the upper edge of the plate at 0.5–1 cm. The plate was removed from the chamber and dried until the solvents evaporated and their odour disappeared.
Detection of lipids
For detection of lipids, we used a method based on staining with iodine vapour, which is convenient due to its universality and lack of destructive effect on lipids. After the chromatographic chamber, plates were dried and placed in a desiccator containing crystals of iodine. The lipids were found in the form of brown-yellow spots or stripes. Spots were carefully outlined with a soft pencil and it was waited for the iodine to disappear Citation[16].
Detection of phospholipids was carried out by the method of Vaskovsky et al. Citation[17]. First, source reagent A was prepared as follows: 0.4 g of hydrochloric acid hydrazine in 14 mL of 4n НCl were added to 10 g of sodium molybdate in 60 mL of 4n HCl. The mixture was heated for 20 min in a water bath to 36°C, cooled and was added 14 mL of concentrated sulphuric acid; then the volume was brought up to 100 mL with distilled water. To sprinkle plates, we prepared reagent C: to the volume of reagent A, we added three volumes of distilled water or seven volumes of 7n sulphuric acid. Spots of phospholipids in the latter case were painted in blue colour.
Separate fractions of phospholipids were identified using the Rf values of specific colouring agents and reference standards. Choline-containing phospholipids were detected using Dragendorf's reagent, which was prepared as follows: 20 mL of solution 1 (1.7 g of bismuth nitrate dissolved in 100 mL of 20% acetic acid) was mixed with 5 mL of solution 2 (10 g of potassium iodide dissolved in 25 mL of water) adding 70 mL of water. This mixture was used to sprinkle the plates. Choline-containing lipids appeared as orange spots Citation[16].
To detect amine-containing phospholipids (phosphatidylethanolamine (PEA) and phosphatidylserine (PS)) we used ninhydrine reagent. Chromatographic plates were sprinkled with 0.15% solution of ninhydrin in acetone and were then heated to 100°C. Amine-containing phospholipids turn red-violet Citation[18]. Detection of FFAs was carried out using bromocresol green. To 100 mL of 0.3% solution of bromocresol green in 80% methanol (by volume), we added eight drops of a 30% sodium hydroxide. This mixture was sprinkled onto the plates. Fatty acids were seen in the form of yellow spots on a green background Citation[16].
Quantitative analysis of lipids
Quantitation of phospholipids was performed using densitometric automated complex CAMAG TLC Scanner 4 (Muttenz, Switzerland) Citation[14–15]. The reagent for staining of plates was prepared in advance: 20 g of copper sulphate pentahydrate was dissolved in 200 mL of distilled water. Then, we added 8 mL of sulphuric acid (98%) and 8 mL of phosphoric acid (85%). After separation in the solvent system, the plate was dipped into the dye for 15 s and was then air-dried and heated on a stove at 140°C for 30 min. Detection was carried out using the TCL Scanner 4 and winCATS software in the mode of absorption at 360 nm with deuterium lamp. The content of phospholipids was measured as a ratio of inorganic phosphorus in individual phospholipid fractions to the total inorganic phosphorus in all phospholipid fractions.
Fatty acids of methyl esters of individual lipids and FFAs were analysed by gas chromatography (GC) Citation[19].
Methylation of fatty acids was carried out according to Morrison and Smith's method Citation[20]. The silica gel containing individual phospholipids was scraped into a test-tube with ground glass neck, soaked in 4 mL of chloroform/methanol mixture (2/1). Elution was carried out by constant stirring on a magnetic stirrer (12 hours). The supernatant was drained into a test-tube with a ground glass neck. The solvent was evaporated and 3 mL of methanol, 50 μL of boron trifluoride in methanol and 10 μg of margarine acid were added to the dry residue of lipids. The tubes were tightly closed and placed in a thermostat at 64°C for 1 h. Then the samples were cooled and each tube was added 1.5 mL of water, 2 mL of hexane and 1.5 mL of hydrochloric acid. The tubes were closed, shaken vigorously for 3 min and centrifuged at 1500 g for 5 min. The upper phase containing the methyl esters was selected and evaporated in cannula under nitrogen. Methyl esters were diluted in 10 μL of hexane.
The separation of methyl esters of fatty acids was carried out using a SHIMADZU GC-2010Plus AF gas chromatograph (Kyoto, Japan).
The rate of gas throughput was set as follows: hydrogen 40 mL/min, air 400 mL/min. Nitrogen pressure was constant, 49.5 kPa. The evaporator temperature was 225°C; that of the detector was 250°C and that of the columns, not higher than 240°C. When separating mixtures of substances, we used the method of nonlinear temperature programming, i.e. the programme consisted of several linear sections with different heating rates: T1 = 100°C, the retention time – 4 min; T2 = 240°C; the heating rate 3°C/min for 10 min. The analysis time was 49 min. Margarine acid served as internal standard.
Conformation and properties of Hb
The conformation and properties of Hb were studied by Raman scattering (RS) using inVia confocal Raman microscope (Renishaw, Wotton-under-Edge, UK) Citation[21–24] with short focus high luminosity monochromator (focal length not more than 250 mm). For excitation of Raman spectra, a laser was used (wavelength of 532 nm, maximum power of 100 mW and 100× objective). The data recorder was a charge-coupled detector (CCD) (1024×256 pixel Peltier cooled to –70 °C) with grating of 1800 lines/mm. The digitized spectra were processed using WIRE 3.3. software. Baseline correction was made, as well as smoothing of the spectra.
The swab of the erythrocyte suspension was studied on the slide. The spectrum of Hb was recorded at excitation by a 532-nm laser and correlation of bands with fluctuations of porphyrin bonds. For each sample, the measurements were performed three times and the resulting values were averaged. The position and intensity of the bands of the RS of Hb spectrum depends on the nature of fluctuations of the porphyrin ring bonds, which allows to evaluate the conformation of HP, which is directly related to the oxygen-binding properties of Hb (i.e. the Hb oxygen saturation) Citation[23–25].
To analyse the conformation of Hb, we used certain specific characteristic bands of the RS spectrum that allow to explore the conformation of HP in deoxyhaemoglobin (d-Hb) and the ability of d-Hb to bind the ligands and the conformation of HP in oxyhaemoglobin (o-Hb) and the ability of Hb to dump the oxygen. For analysis of the conformation and O2-binding properties of Hb, the following bands of the RS spectrum of blood were used (the positions of maximums are indicated): 1172, 1355, 1375, 1548, 1550 and 1580 cm−1.
The correlation of spectral intensities I1375/(I1355+I1375) characterizes the relative amount of o-Hb in the blood; I1355/I1550 is the relative capacity of the total Hb in the sample to bind ligands (including oxygen); and I1375/I1580 is the relative ability of Hb to select ligands. The ratio I1580/I1548 reflects the affinity of Hb to ligands, primarily to oxygen. The ratio I1375/I1172 shows the intensity of the symmetric and asymmetric vibrations of the pyrrole rings but its change may be due to conformational changes of the pyrroles Citation[2,22–26].
Data analysis
Statistical analysis was carried out using the program Statistics 6.0. The results were analysed statistically by assessment of the normality of distribution of values for each of the samples using the Geary criterion Citation[27]. Then, the homogeneity of dispersion was evaluated, after which analysis of variance (ANOVA) was conducted and ANOVA for repeated measurements. In the case of statistically significant differences between the average values, we applied ex-post facto Tukey method of contrast of means Citation[28]. The results are presented as simple mean values and standard deviation (mean ± SD).
Results and discussion
Changes in the composition of phospholipids of RBCs in hypoxic conditions
At present, the relationship between disorders of the membrane lipid content and conformational changes of Hb in healthy and pathological conditions associated with the development of hypoxia in the body is not sufficiently studied. Hypoxia is one of the key factors in the pathophysiology of most cardiovascular diseases. It leads to a disturbance of the gas transport function of blood and, in many cases, reduces the efficiency of oxygen transfer by erythrocytes. This is primarily due to conformational changes of haemoporphyrin and Hb in general. In its turn, the distribution and conformation of Hb in the erythrocyte is attributed to the cytoarchitecture (cell morphology) of the latter, directly dependent on the state and functioning of the cell membrane.
Lipids bear strongly on the functioning of erythrocyte membranes. They have individual composition, high rate of exchange, different fatty acids that determine the physical state of the lipid bilayer, and ability to be oxidized. However, the issue pertaining to particular metabolites of lipid nature that play an important role in the functioning of erythrocyte membranes, including the provision of oxygen transport through the lipid bilayer, remains poorly understood.
Here, we studied the phospholipid (PL) and fatty-acid composition of phospholipids and their degree of oxidation in normal conditions and hypoxia. The obtained results showed that, in normoxia, erythrocytes contain the following fractions of glycerophospholipids: phosphatidylethanolamine (PEA, 0.83 mgP/mgPL), phosphatidylcholine (PC, mgP/mgPL), phosphatidylserine (PS, 0.4 mgP/mgPL) and phosphoinositide (PI, 0.3 mgP/mgPL). Analysis of the fraction of phosphoinositides was made without separation of components (phosphatidylinositol phosphate (PIP) and phosphatidylinositol bisphosphate (PIP2) and phosphatidylinositol trisphosphate (PIP3)). There were also FFAs (0.2 mgP/mgPL) (). The incubation of erythrocytes in case of hypoxia resulted in a significant increase in the content of PC by 20% (p < 0.05) in comparison with the control group. In other fractions, significant changes were not found ().
Figure 1. Content of phospholipids (PL) in erythrocytes in normoxia (■) and in 30-min hypoxia (□). Note: * Statistical significance of differences relative to the control group (р < 0.05).
Effect of hypoxia on the fatty-acid composition of erythrocyte phospholipids
In order to better understand the nature and extent of participation of particular phospholipids in functions that are common to all cells, and specific for erythrocytes, a deeper research into the molecular structure of individual phospholipids and, above all, their fatty acids, as the most variable component of phospholipids, is required Citation[29]. Our focus on fatty acids is explained by the role that they perform in the functioning of cells. Firstly, they participate in the formation of the hydrophobic zone of the membrane. Secondly, they bear, to a considerable degree, on the phase state of the membrane. Thirdly, the presence of unsaturated fatty acids (UFAs) in membranes makes them easily susceptible to various influences, in particular, peroxide oxidation, whose intensification can cause many disturbances at the level of individual enzyme systems and the whole cell Citation[30]. Fourthly, fatty acids in phospholipids are characterized by rather high turnover rate, which may be of great importance in cell metabolism.
The fatty-acid composition of membranic lipids can vary widely, which greatly affects the membrane structure and functions. In this study, the results from the analysis of the fatty-acid composition of phospholipids identified 19 fatty acids: C10:0 capric acid, C11:0 undercylic acid, C12:0 lauric acid, C13:0 tridecyl acid, C14:0 myristic acid, C14:1 myristoleic acid, C16:0 palmitic, C16:1 palmitoleic, C18:0 stearic, C18:1 oleic, C18:2 linoleic, C18:3 linolenic, C20:0 arachidic, C20:2 eicosadienoic acid, C21:0 henicosanoic acid, C22:0 behenic acid, C22:1 erucic acid, C24:0 lignoceric acid and C24:1 nervonic acid. In PC fractions and PEA, myristoleic acid was missing. In the PC fraction, C24:0 lignoceric acid was not found. The rather high content of short chain fatty acids (8:0; 10:0; 11:0; 12:0; 13:0; 14:0) could be explained by the fact that we analysed the whole erythrocytes without separation into membrane and cytoplasm. It is possible that these acids were isolated from the cytoplasm, and not from the membrane.
The saturation ratio was calculated for each fraction of lipids and for each exposure separately. The analysis of the fatty-acid composition of lipids of erythrocytes showed that, in the control sample, the PC fraction contained all of the above fatty acids. The biggest amount was that of C10:0 and C11:0 acids. Of the acids typical of membranes, the ones most represented were shown to be С16:0, C18:0, C20:0, C22:0 saturated acids. Of the UFAs, a significant content was detected for C18:2, C20:2 and C24:1. The ratio of PC saturation was 0.82.
In the PC fraction, the overall fatty-acid composition was similar to that described above, but there was no linolenic acid. Among the saturated acids with largest amounts, there was behenic acid available, unlike the PC fraction. Of the UFAs, we found large amounts of palmitoleic and erucic acid. The ratio of PC saturation was 0.61.
In the PEA fraction, the overall fatty-acid composition was monopolized by C22:0 acid, its amount comprising 37.6%. Of the UFAs, we identified a prevalence of C20:2 and C18:2 acids. There was no trace of linolenic and erucic acid. The coefficient of saturation was the highest among the phospholipid fractions, 0.91.
The qualitative composition of phosphoinositide fatty acids did not differ from that in previous fractions. In terms of quantity, the most abundant saturated acids were C11:0, C18:0 and C22:0 acids. Among the UFAs, the greatest contribution was brought by C16:1 and C20:2. The factor of PI saturation was shown to be equal to 0.73.
The saturated FFAs were represented mainly by short-chain C10:0, C11:0 and C18:0 acids. Of the UFAs, we detected mainly C18:2 and C20:2. The factor of FFA saturation was 0.85.
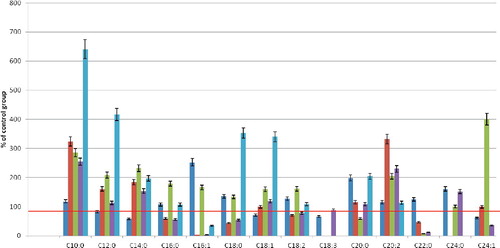
As a next step in our experiments, we explored the fatty-acid composition of erythrocyte phospholipids during their incubation under hypoxic conditions. During 10-min hypoxia, the smallest change in the fatty-acid composition was observed in the PC fraction (). There was a significant increase in the content of C16:1 and C20:0 fatty acids (2.5- and 2-fold compared to the control group, respectively). The amount of some saturated fatty acids decreased: C12:0 and C14:0 (maximum C14:0, by 42% compared to the control), as well as that of UFAs (C18:1, C18:3 and C24:1).
Figure 2. Fatty acid composition change of core phospholipid fractions of erythrocytes after 10-min hypoxia. Note: Level of control – 100%.
In the PC fraction, there was a more substantial change in the fatty-acid composition after 10 min of hypoxia. There were significantly increased levels of fatty acids with a carbon chain length of up to 16 atoms (C8:0–C16:0), maximum for C10:0 acid (3.2-fold compared to the control). The number of long-chain fatty acids decreased (C16:0, C18:0, C22:0). Of the UFAs, the amount of palmitoleic acid decreased by 90%.
The most significant quantitative changes occurred in the fatty-acid composition of the PEA, PI and FFA fractions. In all of these fractions, the levels of fatty acids with a chain length of at least 16 carbon atoms increased several-fold in comparison with the control group. Among the UFAs, there was a maximum increase in C20:2 acid (2.0- and 2.3-fold compared to the PEA and PI fractions in the control, respectively).
After a 20-min hypoxia, there were observed quantitative changes in the fatty-acid composition in all phospholipid fractions (). The quantity of fatty acids with up to 16 carbon atoms was increased, and the maximum increase occurred in the FFA fraction (from 1.8-fold for C14:0 to 5.8-fold for C10:0 compared to the control samples). In all fractions, the number of other saturated fatty acids with longer chains also increased: C20:0 (the maximum increase was 2.3-fold in the PC fraction, and the minimum of 15%, in the PC and PI fractions). In the PEA fraction, the amount of arachidic acid decreased by 71%. The content of C16:0 increased by 46%, whereas that of C18:0 remained unchanged.
Figure 3. Fatty acid composition change of core phospholipid fractions of erythrocytes after 20-min hypoxia. Note: Level of control – 100%.
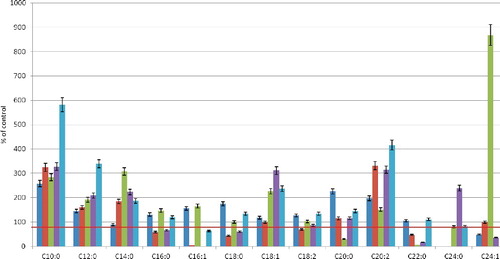
In the UFAs, 20-min hypoxia resulted in a high content of C16:1 (by 55% in the PC fraction and 65% in the PEA fraction compared with the control). The content of C18:1 in PEA increased 2.7-fold, 2.4-fold in FFA and by 18% in PC. Such changes in the composition of monoenoic acids make the membrane more susceptible to oxidation, as palmitoleic and oleic acid, being strong endogenous absorbers of reactive oxygen species (ROS), may be sources of cytotoxic products of lipid peroxidation and may initiate membrane degradation Citation[31]. In the PC and FFA fractions, the content of C16:1 decreased compared to the control by 96% and 37%, respectively, whereas this fatty acid was not detected in the PI fraction. Apart from palmitoleic acid, the amount of 22:0 acid decreased significantly (by 95% in the PEA fraction and 83% in the PI fraction) at 20 min of hypoxia.
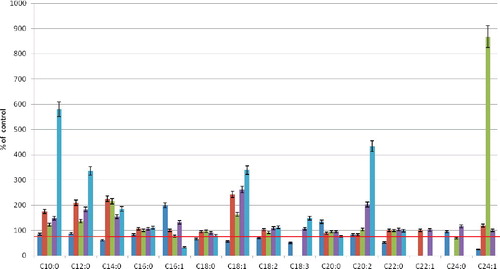
Thirty minute of hypoxia brought about the greatest quantitative changes in the FFA composition (). The content of fatty acids with 10–16 carbon atoms increased up to several-fold. On the other hand, the content of C16:1 acids in this fraction decreased by 67%. The PC fraction showed the smallest quantitative changes in the composition of fatty acids. At the same time, there was a decrease in the number of most fatty acids (C10:0, C12:0, C14:, C18:0, C20:0). The maximum decrease was that in the content of C24:1 acid (by 74.8% in comparison with the control). The content of UFAs: C18:1, C18:2 and C18:3, decreased by 43%, 30% and 49%, respectively. An almost unchanged amount of C16:0 acid was observed in PC, PEA and PI; no change was detected in the content of C22:0 acid in all fractions, but PC, either.
Figure 4. Fatty-acid composition change of core phospholipid fractions of erythrocytes after 30-min hypoxia. Note: Level of control – 100%.
Changes in the phospholipid and fatty-acid composition of the erythrocyte lipids indicate structural rearrangements in the membrane of erythrocytes and thus, point to the functional changes affecting the erythrocytes in general, as well as the primary oxygen-transport protein of erythrocytes, Hb (membrane-bound and cytoplasmic form) Citation[6,11]. In addition, changes in the functional and morphological properties of Hb and erythrocytes in general can throw light on the degree and the nature of the pathological process accompanied by hypoxia.
Changes in the oxygen-binding capacity of erythrocyte Hb under hypoxia
Using the method of Raman spectroscopy (RS), we studied the changes in the oxygen-binding capacity of erythrocyte Hb by incubation of erythrocytes under hypoxia. The characteristics of the RS spectra of Hb haemoporphyrin Citation[24,32] are instrumental in determining the degree of oxidation of the iron atom, its spin state and the availability of ligands; and reflect changes in the structure of globin that lead to deformation of the hemoprotein and effect the oxygen-binding properties of Hb Citation[5]. The use of RS-peaks and not their absolute values is explained by the fact that the absolute value of the spectrum intensity depends on the amount of Hb and, therefore, on the number of erythrocytes in the sample in the area of the laser focus. Internal normalization peaks (on intensity of other bands) ensures that the analysed parameters in different samples do not depend on the amount of Hb, and are determined only by the conformation of Hb and the relative content of its various forms.
In the control group of patients, the relative amount of o-Hb (the intensity ratio I1375/(I1355+I1375)), was 0.57±0.02 rel. units; the ability of Hb to bind ligands (the ratio of I1355/I1550) was 0.75±0.08 rel. units and the ability of Hb to select ligands (I1375/I1580), including oxygen, was 0.73±0.08 rel. units. The affinity of Hb to oxygen (I1580/I1548) was 1.06 ± 0.09 rel. units and the intensity of symmetry and asymmetry of pyrrole rings vibrations (I1375/I1172) was 1.98±0.08 rel. units. The RS spectrum of Hb haemoporphyrin of erythrocytes of healthy people is presented in (a).
Figure 5. RS spectrum of haemoglobin-derived hemoporphyrin of erythrocytes: control (a); after incubation under hypoxia (b).
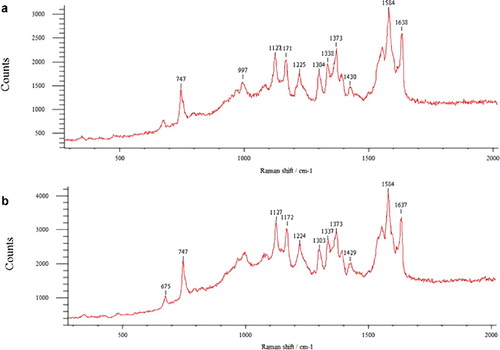
When the erythrocytes were incubated for 10 min under hypoxia, we found that hypoxia causes a change in the RS spectrum of erythrocyte Hb, as well as in its ability to bind and select oxygen (, (b)). In an oxygen-free environment, the content of o-Hb decreased by 15.83%. Since the cell itself does not consume oxygen for its own needs, and adenosine triphosphate (ATP) synthesis occurs in it at the expense of glycolysis and the pentose phosphate pathway, it could be assumed that hypoxia stimulates the processes aimed at facilitating oxygen release from Hb.
Table 1. Characteristic RS spectrum bands of erythrocyte haemoglobin in health and under hypoxia.
The intensity ratio of I1355/I1550, showing the relative ability of the total Hb in samples to bind ligands, including oxygen, decreased under hypoxia by 16.62%. This is supported by the fact that, in an oxygen-free environment, the ratio of I1375/I1580 (16.4%) was significantly high, thus indicating an increased ability of Hb to release ligands. In addition to oxygen release, it could also be due to the presence of Hb and other ligands (NO, OH, CO), which are indicators of the occurrence of pathological processes.
The cause behind these changes may also be attributed to oscillations of methine bridges between the pyrroles in Hb, in which HP obtains a less compact, deformed conformation so that the oxygen is weakly attached to the HP. The intensity of symmetric and asymmetric pyrrole ring vibrations (bands ratio of I1375/I1172) increased by 29.2% in a hypoxic environment, which is exactly related with conformational changes of the pyrroles. The bands ratio (I1355/I1550)/(I1375/I1580) characterizing the affinity to ligands, primarily to oxygen, during incubation under hypoxia decreased by 25.5% in comparison with the control value.
Overall, the erythrocyte properties depend on the state of the plasma membrane. Changes in the lipid and fatty-acid composition as well as in the viscosity of the membrane leads to changes in the erythrocyte size and shape Citation[11]. This, in turn, can indirectly affect the conformation and the oxygen-binding properties of membrane-bound and total Hb contained in the erythrocyte. The conformational changes in Hb may directly affect the oxygen-transport function of erythrocytes.
Conclusions
Our experimental data showed that the composition of lipids in erythrocytes, including the composition of lipids that form bilayer of the erythrocyte membrane, undergo profound changes. Based on the literature data and our findings, it could be speculated that the lipid composition will be the determining factor in the regulation of the state of the lipid bilayer. This, in turn, will affect the morphological characteristics of erythrocytes. As a result, these changes will affect the oxygen-transport properties of Hb. This is particularly evident when hypoxia develops. The results obtained in this study support our hypothesis that the crucial factor in hypoxia pathogenesis is changes in the lipid composition and state.
Disclosure statement
No potential conflict of interest was reported by the authors.
Additional information
Funding
References
- Bryzgalova NY, Brazhe NA, Yusipovich AI, et al. Role of the state of erythrocyte cytoplasm in the change of haemoglobin affinity for oxygen. Biophysics. 2009;54(3):308–311.
- Vladimirov Y. OsipovAN, KlebanovGI. [The structure of haemoglobin]. Moscow: Mir; 2005. p. 103. [Russian]
- Artyukhov VG, Putintseva OV, Kalaev EA, et al. [Human haemoglobin affected by different physico-chemical agents]. Voronezh: Voronezh State University Publ.; 2013. p. 364. [Russian]
- Rodnenkov OV, Luneva OG, Ulyanova NA, et al. Erythrocyte membrane fluidity and haemoglobinhaemoporphyrin conformation: features revealed in patients with heart failure. Pathophysiology. 2005;11(4):209–213.
- Yusipovich AI, Brazhe NA, Luneva OG, et al. Сhanges in the state of haemoglobin in patients with coronary heart disease and patients with circulatory failure. Bull Exp Biol Med. 2013;155(2):233–235.
- Revin VV, Gromova NV, Revina ES, et al. Study of the structure, oxygen-transporting functions, and ionic composition of erythrocytes at vascular diseases. BioMed Res Int. [Internet]. 2015 [ cited 2016 Nov 3];2015: 973973. Available from: https://www.hindawi.com/journals/bmri/2015/973973/
- Maksimov GV, Brazhe NA, Yusipovich AI, et al. Use of nanoparticles for studying the conformations of submembrane haemoglobin. Biophysics. 2011;56(6):1069–1073.
- Titov VN. [Fatty acids, lipids (transport forms of fatty acids) and apolipoproteins (libids-carrying macromolecules) are a single functional system]. Clin Laboratory Diagnostics. 2007;1:3–9. [Russian]
- Troshkina NA, Tsirkin VI, Noble SA. [Red blood cell: structure and function of its membrane]. Vyatka Med Bull. 2007;2:32–40. [Russian]
- Revin VV, Gromova NV, Revina ES, et al. Role of membrane lipids in the regulation of erythrocytic oxygen-transport function in cardiovascular diseases. BioMed Res Int. [Internet]. 2016 [ cited 2016 Nov 3];2016:3429604. Available from: https://www.hindawi.com/journals/bmri/2016/3429604/
- Revin VV, Filatova SM, Syusin IV, et al. Study of correlation between state and composition of lipid phase and change in erythrocytes structure under induction of oxidative processes. Int J Hematol. 2015;101(5):487–496.
- Bligh EA, Dyer W. Rapid method of total lipid extraction and purification. Can J Biochem Physiol. 1959;37(8):911–917.
- Evans WG, Morre DD, O'Brightman E, et al. [Biological membranes. Methods]: a translation of original. In Findlay GB, Evans WG, editors. Moscow: Mir; 1990. p. 424. [Russian]
- Handloser D., Widmer V, Reich E. Separation of phospholipids by HPTLC – an investigation of important parameters. J Liquid Chromatog Related Technol. 2008;31:1857–1870.
- Reich Е, Schibli A. A standardized approach to modern high performance thin-layer chromatography (HPTLC). J Planar Chromatogr. 2004;6(17):438–443.
- Kirchner Y. [Thin-layer chromatography]. Vol. 2. Moscow: Mir; 1981. p. 523. [Russian]
- Vaskovsky VE, Kostevsky EY, Vasendin J. A universal reagent for phospholipids analysis. J Chromatogr. 1975;114(1):129–141.
- Marinetti GV. New biochemical separations. Princeton: Van Norstrand; 1964. p. 339.
- Zelenin KN. [Gas chromatography in medicine]. Soros Edu J. 1996;11:20–25. [Russian]
- Morrison WR, Smith ML. Preparation of fatty acid methylesters and dimethylacetals from lipid with boron fluoridemethanol. J Lipid Res. 1964;5:600–608.
- Maksimov GV, Rodnenkov OV, Churin AA, et al. Influence of interval hypoxemic training on haemoglobin ability to bind oxygen in the blood of ischemia heart disease patient. Cardiology. 2001;6:8–1.
- Jewell SA, Petrov PG, Winlove CP. The effect of oxidative stress on the membrane dipole potential of human red blood cells. Biochim Biophys Acta. 2013;1828(4):1250–1258.
- Brazhe NA, Abdali S, Brazhe AR, et al. New insight into erythrocyte through in vivo surface-enhanced Raman spectroscopy. Biophys J. 2009;97(12):3206–3214.
- Brazhe NA, Baizhumanov AA, Parshina EY, et al. Studies of the blood antioxidant system and oxygen-transporting properties of human erythrocytes during 105-day isolation. Hum Physiol. 2014;40:804–809.
- Torres Filho IP, Terner J, Pittman RN, et al. Measurement of hemoglobin oxygen saturation using Raman microspectroscopy and 532-nm excitation. J Appl Physiol. 2008;104(6):1809–1817.
- Vlasov AP, Trofimov VA, Tarasova TV, et al. Structural-functional state of haemoglobin in gestosis. Modern Problem Sci Edu. [Internet]. 2012 [ cited 2016 Nov 3];6:8. Russian. Available from: http://www.science-education.ru/en/article/view?id=7340.
- Geary RC. Testing for normality. Biometrika. 1947;34(3/4):209–242.
- Tukey JW. Comparing individual meansin the analysis of variance. Biometrics. 1949;5(2):99–114.
- Korzhenevskiy DA, Selishcheva AA. [Identification of the phospholipid composition of human erythrocytes in norm by HPLC with light scattering detector]. Bull Exp Biol Med. 2009;147(4):473–476. [Russian]
- Morel I, Cillard P, Cillard J, et al. Flavonoid – metal interaction in biological systems. In: Rice-Evansand C, Parcer L, editors. NewYork: MarcelDekker; 1997. p. 67–90.
- Denisa M, Ilieand M. Trends in the evaluation of lipid peroxidation processes. In: Catala A, editor. Lipid peroxidation. Rijeka: InTech; 2012. Available from: http://www.intechopen.com/books/lipid-peroxidation/trends-in-the-evaluation-of-lipid-peroxidation-processes.
- Mityanina VA, Parshina EY, Yusipovich AI, et al. Oxygen-binding characteristics of erythrocyte in children with type I diabetes mellitus of different duration. Bull Exp Biol Med. 2012;153(4):508–512.