ABSTRACT
The PEDV-S1 protein, one of the members of a large family of PEDV, is significantly upregulated and has been targeted as a biomarker of cellular stress in several studies. Herein, conditions were optimized to increase the yield of recombinant PEDV-S1 protein in its native state, primarily focusing on the optimization of upstream processing parameters that lead to an increase in the specific as well as volumetric yield of the protein. The results showed that the production of PEDV-S1 was increased proportionally with increased incubation temperature up to 37 °C. Induction with 10 lM IPTG was sufficient to induce the expression of PEDV-S1 which was 100 times less than the normally used IPTG concentration. Furthermore, the results indicate that induction during early to late exponential phase produced relatively high levels of PEDV-S1 in soluble form. In addition, 5 h of post-induction incubation was found to be optimal to produce folded PEDV-S1 with higher specific and volumetric yield. Subsequently, highly pure and homogenous PEDV-S1 preparation was obtained using metal affinity and size exclusion chromatography. Taken together, the results showed successful production of electrophoretically pure recombinant PEDV-S1 protein in Escherichia coli (E. coli) in milligram quantities from shake flask liquid culture.
Introduction
Porcine epidemic diarrhea (PED) is a devastating swine disease that is characterized by acute enteritis and lethal watery diarrhea followed by severe dehydration leading to death, with a high mortality rate in piglets [Citation1,Citation2]. The disease was initially recognized in England in 1971, but the causative agent of this disease, PED virus (PEDV), was identified in 1978 [Citation3]. PED epidemics were first reported in Asia in 1982, and since then, PED has continued to threaten swine health, causing substantial economic losses in the Asian swine industry [Citation4–6]. In 2013, PED outbreaks suddenly occurred in the United States and have swept through the pork industry across the country, raising concerns about control measures for PED prevention [Citation7,Citation8]. In Taiwan, Porcine epidemic diarrhea virus (PEDV) appeared in 2013 [Citation9]; however, a retrospective study indicated that the virus had been present as early as 2013 [Citation10]. Although periodic vaccination strategies have been implemented nationwide to control PED in Taiwanese swine herds, PEDV has continually emerged, causing tremendous harm to the productivity of Taiwanese pig farms. PEDV, a member of the genus Alphacoronavirus within the family Coronaviridae of the order Nidovirales, is a large, enveloped virus possessing a single-stranded, positive-sense RNA genome of approximately 28 kb with a 50 cap and a 30 polyadenylated tail [Citation3]. The PEDV genome is composed of the 50 untranslated region (UTR), at least seven open reading frames (ORF1a, ORF1b, and ORF2 through 6), and the 30 UTR [Citation11]. The two large ORFs 1a and 1b make up the 50 two-thirds of the genome and encode the non-structural replicase genes. The remaining ORFs in the 30 terminal region code for four major structural proteins: the 150-220-kDa glycosylated spike (S) protein, the 20-30-kDa membrane (M) protein, the 7-kDa envelope (E) protein, and the 58-kDa nucleocapsid (N) protein [Citation12,Citation13].
The S protein of PEDV is a type I membrane glycoprotein composed of 1383–1386 amino acids (aa), depending on the strain. It contains a putative signal peptide (aa 1–24), a large extracellular region, a single transmembrane domain (aa 1334–1356), and a short cytoplasmic tail. Although PEDV has an uncleaved S protein because it lacks a furin cleavage site, the S protein can be divided into S1 (aa 1–735) and S2 (736-the last aa) domains based on homology with S proteins of other coronaviruses [Citation14–17]. Like other coronavirus S proteins, the PEDV S protein is known to play a pivotal role, interacting with the cellular receptor to mediate viral entry and inducing neutralizing antibodies in the natural host [Citation18,Citation19]. More precisely, previous studies have shown that the S1 domain includes the main neutralizing epitopes and the receptor-binding region [Citation20,Citation21]. Furthermore, along with the full-length S gene, the S1 portion is known to be a suitable region for determining genetic relatedness among the different PEDV isolates and for developing differential diagnostic assays [Citation22,Citation23]. Considering these molecular and biological features of the S1 domain, it would be an appropriate target for developing effective vaccines against PEDV. To perform such studies, highly pure homogenous preparations of a protein in milligram quantity are needed. Keeping this in mind, this study was aimed at expressing, optimizing, and producing a large quantity of pure recombinant PEDV-S1 in Escherichia coli (E. coli). We have selected E. coli to express the recombinant PEDV-S1 because it has been proven to be a very good host for the heterologous expression of recombinant proteins, and for many purposes E. coli is the best host [Citation24–26]. The recent advances in physiology and genetics of the E. coli at molecular level offer a great opportunity for the rapid and economical production of recombinant proteins [Citation27]. It has previously been shown that genetically fused purification tag enhances the level of purity and protein recovery [Citation27,Citation28].
Here in this study, we have optimized various growth parameters (cultivation temperature, inducer concentration, culture media, pre- and post-induction incubation), this study was successful in obtaining highly pure PEDV-S1 in milligram quantities from shake flask experiments.
Materials and methods
Chemicals and instruments
The S1 of PEDV cloned on pRSETA vector and expression host E. coli BL21 (DE3) pLysS were kindly provided by Elrobh, Alanazi, USA [Citation29]. IPTG and ampicillin were obtained from Bio Basic, USA. Benzonase was purchased from Sigma, Chicken egg lysozyme from USB Corporation, USA. Superdex 75, Ni–NTA resin, low molecular weight markers, and prepacked columns were from Amersham Biosciences, USA. All other chemicals used in this study were of reagent grade. Ultrospec 2100 pro Spectrophotometer, AKTA purification system, SDS-PAGE assembly were from Amersham Biosciences, USA. Thermomixer, electroporator, and bench top cooling centrifuge were from Eppendorf, UK. Lamp sterilizer from Cole-Parmer, Canada, shaking incubator from Jeio Tech, South Korea, gel scanner from Epson and pH meter was from Sentron, Dutch.
Expression of PEDV-S1 in E. coli
In this study, E. coli BL21 (DE3) pLysS was used for expression of PEDV-S1. 1µL of pRSETA_PEDV-S1 plasmid was transformed into high efficiency chemical competent cell of E. coli BL21 (DE3) pLysS [Citation30,Citation31]. We have used 200 µg/mL ampicillin in the solid and liquid medium to maintain plasmid throughout this study. Glycerol stocks of the transformed cells were made by mixing 1:1 ratio of the freshly grown overnight culture with 30% (w/v) sterilized glycerol solutions and stored at −80 °C. Single colony of E. coli BL21 (DE3) pLysS strain harboring pRSETA_PEDV-S1 plasmid was inoculated into 20 mL LBamp grown overnight in shaking incubator at 37 °C. Pre-inoculum (0.2 mL) was inoculated into 20 mL LBamp and culture was grown at 37 °C until OD600 reached 0.65. The expression of PEDV-S1 was induced with isopropyl b-D-thiogalactopyranoside (IPTG) as described [Citation32]. In the preliminary expression experiment, culture at the mid exponential phase was induced with 1 mmol/L IPTG. The culture was grown for 3 h post-induction at 37 °C, 200 rpm. Before harvesting culture, final growth of the culture was calculated by measuring OD at 600 nm. To harvest, 1 mL induced culture was centrifuged at 13,000 rpm for 5 min. Supernatant was discarded and pellet was resuspended in appropriate volume of 1× loading dye to achieve OD1/mL. The sample was boiled for 10 min at 100 °C and loaded on 10% SDS-PAGE. In the parallel experiment, uninduced culture was grown, harvested and sample analyzed on SDS-PAGE. In the control experiment, untransformed E. coli BL21 (DE3) pLysS strain was cultivated in the identical conditions. Equal amounts (equal number of cells) of transformed and untrans-formed culture with and without IPTG induction were loaded on 10% SDS-PAGE [Citation33].
Optimization of PEDV-S1 expression in E. coli
To increase the specific as well as volumetric yield of recombinant PEDV-S1, a variety of independent cultivation parameters such as post-induction incubation temperature, types of culture media, inducer concentration, pre-induction growth, and post-induction incubation time were optimized.
Temperature optimization
To optimize cultivation temperature, fresh culture of E. coli BL21 (DE3) pLysS cells containing pRSETA_PEDV-S1 plasmid was streaked on LBamp plate. Single isolated colony was inoculated in 20 mL LBamp and grown overnight at 37 °C, 150 rpm. Fresh inoculation (1%) was made in 20 mL LBamp and incubated at 37 °C until the mid-exponential growth phase was achieved (OD600 = 0.9). After inducing with 100 lM IPTG at mid exponential phase, cultures were further incubated at three different temperatures (24, 30 and 37 °C) for 3 h at 150 rpm. Final growth of the cultures was measured in the induced and uninduced cultures. Two millilitres of cultures was harvested for soluble protein extraction. An equal amount of soluble crude extract was analyzed on SDS-PAGE [Citation33].
Culture media optimization
To optimize culture media, overnight cultures of E. coli BL21 (DE3) pLysS harbouring pRSETA_PEDV-S1 were made in 20 mL LBamp at 37 °C. From pre-inoculum culture, 1% was transferred into four different media (NBamp,LBamp, 2×LBamp and TBamp) in duplicate. When OD600 was reached in the mid exponential phase, one set of culture was induced with 100 lM IPTG and incubated at 37 °C at 150 rpm. After 3 h of incubation, final OD600 were measured. Two millilitres from each culture were harvested and pellet was resuspended in appropriate volume of lysis buffer to make OD2/mL. An equal amount of extracted soluble proteins was analyzed on 10% SDS-PAGE.
Inducer concentration optimization
Freshly prepared pre-inoculum culture was transferred into eight flasks containing 20 mL LBamp and grown at 37 °C until midexponential phase. All cultures were induced with varying concentrations of IPTG (0, 10, 25, 50, 100, 250, 500, and 1000 lM) and further expressions were made for 3 h at 37 °C. After measuring final growth of all the cultures, 2 mL from each was harvested. Pellet was resuspended in appropriate volume of lysis buffer to make OD3/mL. An equal amount of soluble protein extract was analyzed on 10% SDS-PAGE.
Pre-induction growth optimization
Escherichia coli cells harbouring pRSETA_PEDV-S1 plasmid were grown overnight in LBamp at 37 °C. Fresh culture (0.2 mL) was inoculated in four flasks containing 20 mL LBamp and incubated for different time at 37 °C. When the OD600 of the cultures reached 0.3, 0.6, 1.2, and 1.8, induction was made with 25 lM IPTG. After induction, each culture was incubated for 3 h at 37 °C, 150 rpm. Two-millilitre culture was harvested in duplicate. Pellet was resuspended in appropriate volume of lysis buffer to make OD2/mL. An equal amount of soluble extract was analyzed by SDS-PAGE.
Post-induction incubation optimization
To evaluate maximum yield of PEDV-S1, incubation time after induction was studied. Again, freshly grown 1% overnight culture was inoculated in 200 mL LBamp and incubated at 37 °C to reach midexponential phase. When OD600 reached 0.43, 25 lM IPTG was added to induce expression. Five-millilitre culture was withdrawn post-induction at different time (0, 1, 2, 3, 4, 6 and 24 h) intervals. Two-millilitre culture was centrifuged at 13,000 rpm and pellets were resuspended in lysis buffer to make OD2/mL. Equal volume from each sample (20 µL) was analyzed on 10% SDS-PAGE.
Biomass preparation and extraction of soluble PEDV-S1
To produce biomass of E. coli expressing PEDV-S1 in gram quantity, liter scale shake flask experiment was set up. Freshly grown pre-inoculum was transferred (1%) into 1 liter LBamp in six liter conical flasks. Culture was induced with 25 lM IPTG when growth reached the mid exponential phase (OD600 = 0.6). After 5 h of post-induction incubation, cells were harvested at 5000 rpm for 30 min. Wet biomass was stored at −80 °C. About 2.5 g biomass was resuspended in 15 mL of lysis buffer (50 mmol/L Tris, 200 lM PMSF, 3 mmol/L DTT, 2 mmol/L magnesium chloride, and 300 g/mL lysozyme, pH 7.5) [Citation34]. The biomass was homogenized in a mechanical homogenizer to uniform slurry and then 1 µL benzonase (250 U/µL) was added to the slurry and incubated at room temperature for 1 h. The slurry was then subjected to mild sonication (Soniprep 150, MSE (UK) Ltd.) twice for 10 s at 5 µm amplitude at 4 °C. The slurry was then centrifuged for 30 min at 13,000 rpm at 4 °C. Supernatant was collected and was filtered through 0.45 µm filter. To this sodium chloride was added to a final concentration of 500 mmol/L and Imidazole to a final concentration of 10 mmol/L.
Purification of PEDV-S1 protein
Homogenous preparation of PEDV-S1 in two chromatographic steps
Ni-NTA chromatography
HisTrap column (1 mL) was equilibrated with 20 mL equilibration buffer (50 mmol/L Tris, 10 mmol/L imidazole, and 500 mmol/L sodium chloride, pH 7.5) at 1 mL/min. The filtered supernatant was then loaded onto the column at 1 mL/min, connected with AKTA FLPC. Flow-through was collected. The column was washed with equilibration buffer at 1 mL/min till the absorbance at 280 nm reached basal level and the wash was collected. To elute bound protein, gradient was set 0–50%B (50 mmol/L Tris, 500 mmol/L imidazole, and 500 mmol/L sodium chloride, pH 7.5) at 0.5 mL/min and the protein was fractionated. Presence of PEDV-S1 in crude extract, flow through, wash, and different fractions were analyzed on 10% SDS-PAGE.
Size exclusion chromatography
The fractions containing the protein of interest were pooled and loaded onto superdex 75 column 26/60, connected with AKTA FPLC. The column was pre-equilibrated with (25 mmol/L Tris, 250 mmol/L sodium chloride, and pH was set at 7.5). Flow rate was set at 1.5 mL/min. Highly enriched PEDV-S1 was loaded using superloop. The eluted protein fractions were analyzed for protein content on 10% SDS-PAGE.
Protein quantification
Fractions containing pure PEDV-S1 were pooled. Total protein was quantified by Bradford method [Citation35].
Silver staining
To analyze the purity of pooled protein fractions eluted from gel exclusion chromatography, 25 ng protein was run on SDS-PAGE. The gel was stained with silver staining by following the procedure of Tunón and Johansson [Citation36]. This protocol allows very sensitive detection (1–10 ng of protein per band) with negligible background staining.
Results and discussion
Expression of recombinant PEDV-S1
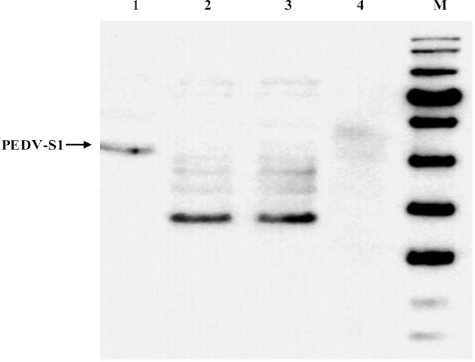
The schematic diagram of PEDV-S1 is shown in . Briefly, a highly specific TEV protease cut site was placed between N-terminal His-tag and PEDV-S1 to remove tag from fusion protein after purification. In the preliminary expression experiment, E. coli BL21 (DE3) pLysS cells containing expression plasmid pRSETA_PEDV-S1 were induced with 1 mmol/L IPTG when growth was reached in the mid-log phase (OD600 –0.75) in LBamp medium at 37 °C. Post-induction culture was incubated for 3 h at 150 rpm. Negative control experiments (uninduced cells with plasmid and induced cells without plasmid) were performed in parallel. The growth of induced culture expressing PEDV-S1 was significantly reduced (). SDS-PAGE analysis of the total cell lysate revealed that culture induced with 1 mmol/L IPTG showed over expression of PEDV-S1 fusion protein band at the expected size (35 kDa) while in the negative control experiments no overexpression band was observed ().
Figure 1. Schematic diagram of the hexa-histidine tagged PEDV-S1 fusion protein. PEDV-S1 fusion protein was cloned under strong T7 promoter. Amino acid numbering starts with the N-terminus of His-tag (1–10), followed by highly specific TEV protease site (11–18) labelled as X-site and PEDV-S1 (19-735).

Table 1. Typical growth of cultures under standard expression condition.
Figure 2. Expression of PEDV-S1 fusion protein. PEDV-S1 was expressed using standard expression parameters such as 1 mM IPTG, 37 °C pre- and post-induction temperatures and 3 h post-induction incubations. Overexpressed PEDV-S1 band was seen at expected size in the lane 1 while in the negative controls (lanes 2 and 3; uninduced culture and induced cells without plasmid, respectively) corresponding band was not present.
Optimization of PEDV-S1 overexpression in E. coli
The aim of optimization parameters for folded PEDV-S1 expression was to achieve the highest amount of specific yield (units of proteins per unit cell) in shortest possible time (per unit time) in the shake flask experiment. To achieve this goal, important growth and protein folding parameters were optimized.
Effect of temperature on the overexpression of PEDV-S1
To evaluate the effect of growth temperature on the expression of PEDV-S1 in soluble state, cultures were incubated at three different temperatures (24, 30, and 37 °C) for 3 h after induction with IPTG. Final growth at different temperatures is listed in . The effect of temperature on the level of soluble PEDV-S1 is clearly seen (). The expression level of PEDV-S1 increases with an increase in temperatures. Total cell lysate was fractionated and nearly all the PEDV-S1 was found in the soluble fraction.
Table 2. Effect of temperature on the growth of induced and uninduced culture.
Figure 3. Effect of temperature on the overexpression of PEDV-S1. Lane M, low molecular weight marker; 1 induced culture at 24 °C; 2, induced culture at 30 °C; 3, induced culture at 37 °C.
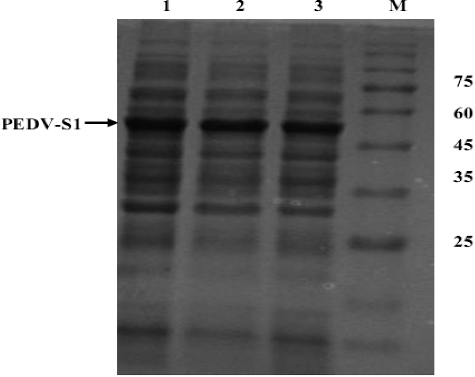
PEDV-S1 gene was cloned on pRSETA vector, which had pUC origin of replication. pUC origin of replication is similar to pBR322 origin of replication except for a single point mutation in the replication primer (RNA II) which made pUC origin of replication temperature sensitive, leading to dramatically several fold increase in copy number of plasmids as a function of temperature [Citation37]. Another important feature was cloning of PEDV-S1 under T7 promoter, one of the strongest known promoters [Citation38,Citation39]. The E. coli cells grow over wide range of temperatures (15–42 °C), but the growth rate of the E. coli cells increases proportionally in response to an increase in growth temperature between 20and 37 °C [Citation40]. It has been observed that in the temperature range of 23–42 °C, the number of ribosomes per cell and level of rRNA remain constant [Citation41]. In fact, at normal temperature range, peptide chain elongation rate increases with respect to an increase in temperatures [Citation40] which results in higher synthesis of proteins. Therefore, at higher temperatures, the rate of PEDV-S1 synthesis was faster due to an increase in plasmid copy number, transcription rate (mRNA synthesis), and peptide chain elongation rate ().
Every protein folds differently depending upon its characteristics such as size, hydrophobicity, post-translational modifications, isoelectric points, etc. [Citation26,Citation42–44]. If the rate of protein synthesis supersedes protein folding machinery, the recombinant protein will then aggregate and result in inclusion body formation [Citation44–46]. In this experiment, the recombinant protein expressions at different temperatures were evaluated to determine the optimum temperature where faster growth rate (higher biomass production) did not compromise folding of PEDV-S1 protein. It was observed that PEDV-S1 was folded well and remained in the soluble fractions at all the tested temperature. It was also found that the specific as well as volumetric yield of PEDV-S1 increased at higher temperature. Therefore, 37 °C was found to be the optimum temperature and further optimization was performed at this temperature.
Culture media optimization
To achieve the optimum expression and production of folded soluble PEDV-S1 in E. coli, we evaluated four different media formulations. To examine the effect of different media compositions, overnight culture was made in LBamp at 37 °C. Overnight cultures (1%) were transferred into four different media (NBamp, LBamp, 2× LBamp, and TBamp) in duplicate. When OD600 was reached in the exponential growth phase, one set of culture was induced with 100 lM IPTG. After the induction, the cultures were grown at 37 °C for 3 h at 150 rpm to get the recombinant protein expression. lists the typical final growth. The final growth varied due to different growth rates under each media. TB medium showed the highest growth rate under uninduced conditions while lowest under induced culture condition. Therefore, induced culture in the TB medium expressing PEDV-S1 showed the lowest volumetric yield. On the other hand, the LB media showed relatively higher growth rate under induced culture conditions resulting in higher volumetric yield. Relative level of recombinant PEDV-S1 protein accumulation in the soluble fractions of the cell lysate under induced and uninduced cultural conditions was observed by SDS-PAGE (). Overall, the four different uninduced cultures showed no significant leakiness whereas all induced cultures showed similar PEDV-S1 expression levels. Because the strength (richness) of medium had no apparent effect on the yield of PEDV-S1 in liquid cultures, further experiments were carried out in LB medium at 37 °C.
Table 3. Effect of media on the cell density of induced and uninduced culture.
Figure 4. Effect of media on the overexpression of PEDV-S1. Four different rich mediums (nutrient broth, NB; Luria-Bertani, LB; double strength Luria-Bertani, 2 xLB; terrific broth, TB) were tested for optimum expression of PEDV-S1. Lane M, low molecular weight marker; 1, uninduced in NB;2, induced in NB; 3, uninduced in 2 xLB; 4, induced in LB; 5, uninduced in 2 xLB; 6, induced in 2 xLB; 7, uninduced in TB; 8, induced in TB.
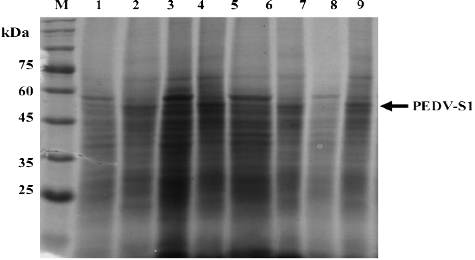
The aim of optimizing media was to produce the highest amount of folded soluble recombinant PEDV-S1 protein per unit volume and time. The production of secondary metabolites in the bacterial cells are largely known to depend upon the constituents of the medium in which they are grown [Citation47–49]; however, little is known about the effect of media formulations on protein folding and accumulation of soluble fractions [Citation50].
Inducer concentration optimization
The evaluation of the different concentrations of inducer for the expression of recombinant PEDV-S1 protein was done in liquid cultures. Upon achieving the exponential growth phase (OD600–0.6), cultures were induced with 0, 10, 25, 50,100, 250, 500, and 1000 lM IPTG and were allowed to express for 3 h at 37 °C. Results presented in (a) indicate the cell growth rates at different IPTG concentrations. The results further showed that the growth of induced cultures was reduced proportionally at lower (up to 400 lM) IPTG concentrations. The effect of IPTG concentrations on the soluble fractions of PEDV-S1 was compared on 10% SDS-PAGE gels by loading an equal amount of soluble crude extract ((b)). Results showed that all IPTG concentrations produced the soluble PEDV-S1 crude extracts. It was also observed that the above 250 lM IPTG concentration, the band corresponding to PEDV-S1 was found in the pellet fraction when analysed on SDS-PAGE, indicating inclusion body formation at higher inducer concentration (data not shown), however at lower IPTG concentrations, the presence of PEDV-S1 in the pellet fraction was insignificant. Interestingly it was found that even a low 10 lM IPTG concentration was enough to induce the PEDV-S1 protein expression. The level of recombinant PEDV-S1 expression in soluble fraction of E. coli was very similar at IPTG concentrations between 10 and 1000 lM ((b), lane 3–9) [Citation51,Citation52]. This result indicates that a higher IPTG concentration has no significant effect on the yield of PEDV-S1 protein. Therefore, for further optimization experiments a 40-fold lower IPTG concentration than the normal was used.
Figure 5. Growth vs. inducer concentration. (a) Effect of IPTG concentration on the final growth of E. coli cells expressing PEDV-S1. As the concentration of IPTG increases up to 400 lM, the final growth decreases proportionally. (b) SDS-PAGE analysis of effect of inducer concentration on the overexpression of PEDV-S1. Here, effect of 0–1000 μM IPTG was examined. Lane M, Protein marker; lane 1, 0 μmol/L; lane 2, 10 μmol/L; lane 3, 25 μmol/L; lane 4, 50 μmol/L; lane 5, 100 μmol/L; lane 6, 250 μmol/L; lane 7, 500 μmol/L; lane 8, 1000 μmol/L.
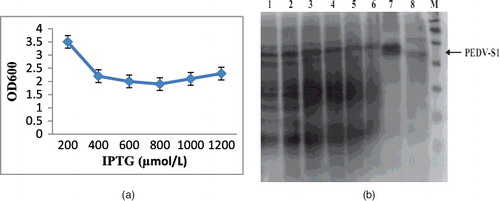
In this study, E. coli Bl21 (DE3) pLysS strain was used which is lacY1+ strain and does not allow titration of IPTG into the cells. E. coli Tuner (DE3) strain (Novagen, Madison, USA), which is a lacZY deletion strain, allows a concentration-dependent induction with IPTG in the E. coli cells and will be helpful in tuning accurately the level of inducer for optimal production of recombinant proteins in E. coli. The lac permease (lacY) mutation permits steady transport of IPTG uniformly into all cells, which allows uniform induction with IPTG in a true concentration-dependent manner. Therefore, by tuning the IPTG concentration, production of recombinant proteins can be regulated from very low to fully induced expression levels. Hence, inducing at low expression rate may boost the production of difficult proteins in the native folded state [Citation52,Citation53].
Pre-induction growth optimization
After optimization of IPTG concentration, relationship between cellular growth at the time of induction and PEDV-S1 production was studied. In order to determine the optimum growth at the time of induction, four liquid culture experiments were performed in parallel. Each culture was induced at different growth phases. Cells were initially allowed to reach different growth stages. Cultures were then induced with 25 lM IPTG when OD600 of the cultures reached 0.3, 0.6, 1.2, and 1.8, representing early exponential, exponential, late exponential, and stationary growth phases, respectively. After induction, protein production was further allowed to express for 3 h. The results showed that the yield of PEDV-S1 remained same when induced at early exponential to late exponential stage (, lanes 2–4) but induction level was reduced when cells reached in the stationary growth phases (, lane 4). The final growth of the cultures is shown in . These results showed that the optimal induction at the mid exponential phase produced high levels of soluble proteins with high cell density.
Figure 6. Effect of pre-induced growth on the expression o PEDV-S1. Culture was induced at different growth phases. Crude soluble extract was loaded on Western blot. Lane M, low molecular weight marker; lane 1, induction at OD 0.3; lane 2, induction at OD 0.6; lane 3, induction at OD 1.2 and lane 4, induction at OD 1.8.
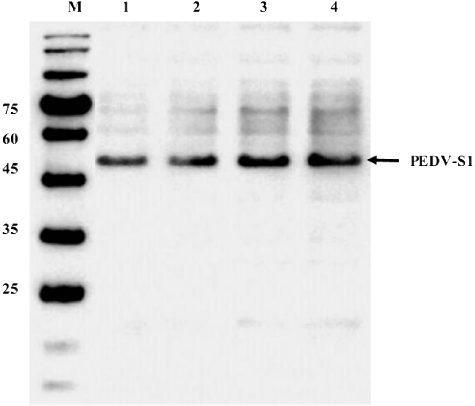
Table 4. Effect of pre-induction growth on the final cell density.
This result is in agreement with earlier studies, where it has been reported that the induction level of recombinant protein increases up to the late exponential phase but expression level reduces in the stationary growth phase [Citation54]. This result also indicates that PEDV-S1 production could be induced at any stage between early exponential and late exponential growth stage.
Post-induction incubation optimization
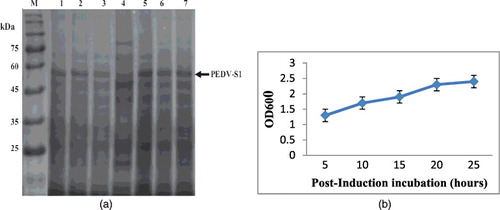
Effect of post-induction incubation period affects the overall folding, accumulation, and productivity of recombinant proteins in E. coli [Citation55]. The duration of post-induction incubation period in the shake flask culture of E. coli is affected by several factors such as strength of promoter, inducer concentration, post-induction incubation time, solubility of recombinant protein, and intrinsic properties of recombinant protein. In order to determine the optimum time of post-induction incubation for higher yield of PEDV-S1, shake flask culture was induced with 25 lM IPTG at the exponential growth phase. After the addition of IPTG, culture was incubated at 37 °C and samples were removed at different time intervals. The level of soluble PEDV-S1 was determined by SDS-PAGE in the crude extract. As shown in (a), the level of PEDV-S1 expression reached at its maximal level within 1 h of induction and incubation at 37 °C. The level of PEDV-S1 remained unchanged up to 24 h of post-induction incubation at 37 °C, indicating that the PEDV-S1 is well folded, soluble, and resistant to E. coli cytosolic proteases. The growth of cells at different intervals of post-induction incubation is shown in (b) [ Citation56,Citation57].
Figure 7. (a) Effect of post-induced incubation on the expression of PEDV-S1. After induction, E. coli culture expressing PEDV-S1 was incubated at 37 °C. Aliquot of culture was removed at different time intervals. Soluble protein was extracted and analyzed on SDS-PAGE. The yield of soluble camel protein remained same up to 24 h of incubation. (b) Post-induction incubation vs. growth in the shake flask culture. The growth of induced culture increases with time but the growth was ceased after 5 h of incubation, resulting in no further increase in biomass after 5 h of post-induction incubation.
Biomass preparation
Under optimized condition for expression of folded PEDV-S1, E. coli biomass was produced. As shown in (b), the growth of induced culture was ceased approx. at OD600 = 2.5. Therefore, ̴ 3 g wet biomass per litre culture was obtained.
Extraction and purification of PEDV-S1
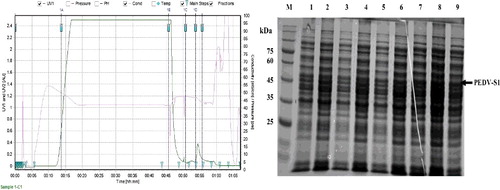
Crude extract was isolated by treating biomass with sixfold excess of lysis buffer followed by gentle sonication. Viscosity of the solution was removed by treatment with a strong nuclease (Benzonase) and slurry was cleared by high-speed centrifugation and filtration through 0.45 lm syringe filter PEDV-S1 fusion protein contains N-terminal (His)6-tag. To suppress non-specific binding, 10 mmol/L imidazole and 500 mmol/L NaCl were added in the crude extract which was then passed though equilibrated HisTrap FF Ni-NTA column ((a)). The bind, wash, and elute fractions were analysed by SDS-PAGE, indicating that PEDV-S1 efficiently bound on column and was eluted by imidazole. As shown in (b), lanes 8–10, PEDV-S1 was highly enriched. Therefore, eluted fractions (19–26) containing relatively pure camel were pooled. After Ni-NTA chromatography, ̴ 17 mg highly enriched PEDV-S1 was obtained which corresponds to 6.4 mg per gram wet biomass.
Figure 8. (a) Ni–NTA purification of (His) 6-tagged PEDV-S1 fusion protein. Crude extract was subjected to Ni–NTA chromatography. The crude extract was passed through the column, equilibrated with 50 mmol/L Tris, 10 mmol/L imidazole, and 500 mmol/L sodium chloride pH 7.5. The column was washed with 50 mmol/L Tris, 10 mmol/L imidazole, and 500 mmol/L sodium chloride pH 7.5. His-tagged PEDV-S1 was eluted by a linear 0%–50% gradient of 50 mmol/L Tris, 500 mmol/L imidazole, and 500 mmol/L sodium chloride, pH 7.5. The protein chromatogram is shown with the solid line. Fractions indicated by arrows were analyzed on SDS–PAGE. (b) The protein separation was done on 10% SDS-PAGE. Lane M, low molecular weight marker; lane 1, crude extract; lane 2, flow through; lane 3, wash; lane 4, fraction 11; lane 5, fraction 13; lane 6, fraction 17; lane 7, fraction 19; lane 8, fraction 21; lane 9, fraction 23.
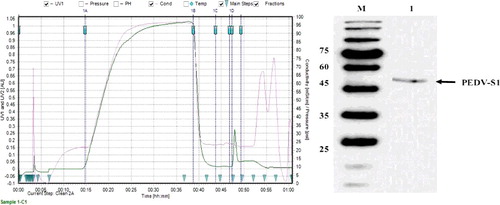
Ni-NTA chromatography system is a rapid and convenient purification technique. Proteins fused with His-tag at either ends (N- or C-terminus) in native or denatured state bind tightly with high affinity on immobilized nickel ions. The strong binding between tagged protein and matrix allows easy washing of contaminants but gentle and efficient elution of bound His-tagged protein by competition with Imidazole or by slightly reducing pH in the acidic range [Citation58]. Therefore, to obtain homogenous preparation of PEDV-S1 in monomeric state, the Ni-NTA elute was subjected to size-exclusion chromatography. In the gel filtration chromatogram ((a)), shoulder peak and small peaks were present. The fractions were analyzed for the purity of PEDV-S1 and highly pure fractions were pooled. The silver staining of the pooled PEDV-S1 showed a single band ((b)). After polishing step, 9 mg highly pure PEDV-S1 was obtained, corresponding to 3.6 mg per gram wet biomass.
Figure 9. (a) Final purification of PEDV-S1 via size exclusion chromatography. Gel filtration column (Superdex 75) was pre-equilibrated with 25 mmol/L Tris, 250 mmol/L sodium chloride, pH 7.5. The purity of the fractions indicated with arrow was analyzed on SDS–PAGE. (b) Analysis of purity of eluted protein from Superdex 75 column by silver staining. Lane M, low molecular weight marker; lane 1, Pool of fractions obtained from size exclusion chromatography.
Conclusions
Following the thorough utilization of optimization parameters, our results show that a 100-fold less than the usual inducer concentration (10 lM) which is routinely used in expression experiments was sufficient to express and produce the optimum amount of PEDV-S1 in E. coli. In addition, the lower concentration of IPTG had no adverse effect on the growth rate and showed higher biomass. Induction between early and late exponential growth phase results in similar yield of recombinant proteins. Moreover, 5 post-induction incubation at 37 °C was sufficient to produce higher level of PEDV-S1 in native state.
Acknowledgments
The author would like to thank Vaccine and Adjuvant Lab, and Macromolecular Analysis Lab in Institute of Animal Vaccine Technology, NPUST for research facilities and skilful technical assistance.
Disclosure statement
No potential conflict of interest was reported by the authors.
References
- Debouck P, Pensaert M. Experimental infection of pigs with a new porcine enteric coronavirus, CV 777. Am J Vet Res. 1980;41(2):219–223.
- Pijpers A, van Nieuwstadt AP, Terpstra C, et al. Porcine epidemic diarrhoea virus as a cause of persistent diarrhoea in a herd of breeding and finishing pigs. Vet Rec. 1993;132(6):129–131.
- Pensaert M, De Bouck P, A new coronavirus-like particle associated with diarrhea in swine. Arch Virol. 1978;58(3):243–247.
- Chen J-F, Sun D-B, Wang C-B, et al. Molecular characterization and phylogenetic analysis of membrane protein genes of porcine epidemic diarrhea virus isolates in China. Virus Genes. 2008;36(2):355–364.
- Li W, Li H, Liu Y, et al. New variants of porcine epidemic diarrhea virus, China, 2011. Emerg Infect Dis. 2012;18(8):1350.
- Puranaveja S, Poolperm P, Lertwatcharasarakul P, et al. Chinese-like strain of porcine epidemic diarrhea virus, Thailand. Emerg Infect Dis. 2009;15(7):1112.
- Mole B. Deadly pig virus slips through US borders. Nature. 2013;499(7459): 388–389.
- Stevenson GW, Hoang H, Schwartz KJ, et al. Emergence of porcine epidemic diarrhea virus in the United States: clinical signs, lesions, and viral genomic sequences. J Vet Diagn Invest. 2013; 25 (5): 649–654.
- Lin CN, Chung W-B, Chang S-W, et al. US-like strain of porcine epidemic diarrhea virus outbreaks in Taiwan, 2013-2014. J Vet Med Sci. 2014;76(9):1297–1299.
- Lin C-N, et al. US-like strain of porcine epidemic diarrhea virus outbreaks in Taiwan, 2013.
- Kocherhans R, Bridgen A, Ackermann M, et al. Completion of the porcine epidemic diarrhoea coronavirus (PEDV) genome sequence. Virus Genes. 2001;23(2):137–144.
- Duarte M, Tobler K, Bridgen A, et al. Sequence analysis of the porcine epidemic diarrhea virus genome between the nucleocapsid and spike protein genes reveals a polymorphic ORF. Virology. 1994;198(2):466–476.
- Lee S, Lee C, Outbreak-related porcine epidemic diarrhea virus strains similar to US strains, South Korea, 2013. Emerg Infect Dis. 2014;20(7): 1223–1226.
- Duarte M, Laude H, Sequence of the spike protein of the porcine epidemic diarrhoea virus. J Gen Virol. 1994;75(Pt 5):1195–1200.
- Jackwood MW, Hilt DA, Callison SA, et al. Spike glycoprotein cleavage recognition site analysis of infectious bronchitis virus. Avian Dis. 2001;45(2):366–372.
- Lee DK, Park C-K, Kim S-H, et al. Heterogeneity in spike protein genes of porcine epidemic diarrhea viruses isolated in Korea. Virus Res. 2010;149(2):175–182.
- Sturman LS, Holmes KV, Proteolytic cleavage of peplomeric glycoprotein E2 of MHV yields two 90 K subunits and activates cell fusion. In: Molecular biology and pathogenesis of coronaviruses.Springer; 1984. p. 25–35.
- Bosch BJ, van der Zee R, de Haan CAM, et al. The coronavirus spike protein is a class I virus fusion protein: structural and functional characterization of the fusion core complex. J Virol. 2003;77(16):8801–8811.
- Chang SH, Bae JL, Kang TJ, et al. Identification of the epitope region capable of inducing neutralizing antibodies against the porcine epidemic diarrhea virus. Mol Cells. 2002;14(2):295–299.
- Lee D-K, Cha S-Y, Lee C. The N-terminal region of the porcine epidemic diarrhea virus spike protein is important for the receptor binding. Korean J Microbiol Biotechnol. 2011;39(1):40–50.
- Sun DB, Feng L, Shi HY, et al. Spike protein region (aa 636789) of porcine epidemic diarrhea virus is essential for induction of neutralizing antibodies. Acta Virol. 2007;51(3):149–156.
- Chen Y, Shi Y, Deng H, et al. Characterization of the porcine epidemic diarrhea virus codon usage bias. Infect Genet Evol. 2014;28:95–100.
- Lee DK, Park CK, Kim SH, et al. Heterogeneity in spike protein genes of porcine epidemic diarrhea viruses isolated in Korea. Virus Res. 2010;149(2):175–182.
- Rosano GL, Ceccarelli EA. Recombinant protein expression in Escherichia coli: advances and challenges. In: Recombinant protein expression in microbial systems. 2014. p.7.
- Pines O, Inouye M, Expression and secretion of proteins in E. coli. Mol Biotechnol. 1999;12(1):25–34.
- Lebendiker M, Danieli T, Production of prone‐to‐aggregate proteins. FEBS Lett. 2014;588(2):236–246.
- Malik A, Rudolph R, Söhling B, A novel fusion protein system for the production of native human pepsinogen in the bacterial periplasm. Protein Expr Purif. 2006;47(2):662–671.
- Malik A, Jenzsch M, Lübbert A, et al. Periplasmic production of native human proinsulin as a fusion to E. coli ecotin. Protein Expr Purif. 2007;55(1):100–111.
- Elrobh MS, Alanazi MS, Khan W, et al. Molecular cloning and characterization of cDNA encoding a putative stress-induced heat-shock protein from Camelus dromedarius. Int J Mol Sci. 2011;12(7):4214–4236.
- Swords WE. Chemical transformation of E. coli. E. coli plasmid vectors. In: Methods and applications. 2003. p. 49–53.
- Sambrook J, Russell DW. The inoue method for preparation and transformation of competent E. coli:" ultra competent" cells. CSH Protoc. 2006;2006(1).
- Studier FW, Rosenberg AH, Dunn JJ, et al. Use of T7 RNA polymerase to direct expression of cloned genes. Methods Enzymol. 1990;185:60–89.
- Laemmli UK. Cleavage of structural proteins during the assembly of the head of bacteriophage T4. Nature. 1970;227:680–685.
- De Mey M, Lequeux GJ, Maertens J, et al. Comparison of protein quantification and extraction methods suitable for E. coli cultures. Biologicals. 2008;36(3):198–202.
- Bradford MM. A rapid and sensitive method for the quantitation of microgram quantities of protein utilizing the principle of protein-dye binding. Anal Biochem. 1976;72(1–2):248–254.
- Tunón P, Johansson K-E. Yet another improved silver staining method for the detection of proteins in polyacrylamide gels. J Biochem Biophys Methods. 1984;9(2):171–179.
- Lin‐Chao S, Chen WT, Wong TT. High copy number of the pUC plasmid results from a Rom/Rop‐suppressible point mutation in RNA II. Mol Microbiol. 1992;6(22):3385–3393.
- Makrides SC. Strategies for achieving high-level expression of genes in Escherichia coli. Microbiol Rev. 1996;60(3):512–538.
- Sørensen HP, Mortensen KK. Advanced genetic strategies for recombinant protein expression in Escherichia coli. J Biotechnol. 2005;115(2):113–128.
- Farewell A, Neidhardt FC. Effect of temperature on in vivo protein synthetic capacity in Escherichia coli. J Bacteriol. 1998;180(17):4704–4710.
- Herendeen SL, Vanbogelen RA, Neidhardt FC. Levels of major proteins of Escherichia coli during growth at different temperatures. J Bacteriol. 1979;139(1):185–194.
- Donovan RS, Robinson CW, Glick B. Review: optimizing inducer and culture conditions for expression of foreign proteins under the control of thelac promoter. J Ind Microbiol. 1996;16(3):145–154.
- Kong B, Guo GL. Soluble expression of disulfide bond containing proteins FGF15 and FGF19 in the cytoplasm of Escherichia coli. PLoS One. 2014;9(1):e85890.
- Rudolph R, Lilie H, In vitro folding of inclusion body proteins. FASEB J. 1996;10(1):49–56.
- Gopal GJ, Kumar A. Strategies for the production of recombinant protein in Escherichia coli. Protein J. 2013;32(6):419–425.
- Klint JK, Senff S, Saez NJ, et al. Production of recombinant disulfide-rich venom peptides for structural and functional analysis via expression in the periplasm of E. coli. PLoS One. 2013;8(5):e63865.
- Broedel S, Papciak SM, Jones WR. The selection of optimum media formulations for improved expression of recombinant proteins in E. coli. Athena Enzyme Systems Technical Bulletin, 2001; 2.
- Sahdev S, Khattar SK, Saini KS. Production of active eukaryotic proteins through bacterial expression systems: a review of the existing biotechnology strategies. Mol Cell Biochem. 2007;307(1–2): 249–264.
- Lee SY, High cell-density culture of Escherichia coli. Trends Biotechnol. 1996;14(3):98–105.
- Rispoli FJ, Shah V. Mixture design as a first step for optimization of fermentation medium for cutinase production from Colletotrichum lindemuthianum. J Ind Microbiol Biotechnol. 2007;34(5):349–355.
- Neubauer P, Hofmann K, Holst O, et al. Maximizing the expression of a recombinant gene in Escherichia coli by manipulation of induction time using lactose as inducer. Appl Microbiol Biotechnol. 1992;36(6):739–744.
- Tamerler CY, Önsan Zİ, Kirdar B. Optimization of starting time and period of induction and inducer concentration in the production of the restriction enzyme EcoRI from recombinant Escherichia coli 294. Turk J Chem. 1998;22(3):221–226.
- Hartinger D, Heinl S, Schwartz HE, et al. Enhancement of solubility in Escherichia coli and purification of an aminotransferase from Sphingopyxis sp. MTA144 for deamination of hydrolyzed fumonisin B 1. Microbial Cell Fact. 2010;9(1):1.
- Maldonado LMP, Hernández VE, Rivero EM, et al. Optimization of culture conditions for a synthetic gene expression in Escherichia coli using response surface methodology: the case of human interferon beta. Biomol Eng. 2007;24(2):217–222.
- Wong HH, Kim YC, Lee SY, et al. Effect of post‐induction nutrient feeding strategies on the production of bioadhesive protein in Escherichia coli. Biotechnol Bioeng. 1998;60(3):271–276.
- Palomares LA, Estrada-Moncada S, Ramírez OT. Production of recombinant proteins. In: Recombinant gene expression: reviews and protocols; 2004. p. 15–51.
- Choi JH, Keum KC, Lee SY. Production of recombinant proteins by high cell density culture of Escherichia coli. Chem Eng Sci. 2006;61(3):876–885.
- Crowe J, Döbeli H, Gentz R, et al. 6xffis-Ni-NTA chromatography as a superior technique in recombinant protein expression/purification. In: Protocols for gene analysis. 1994. p. 371–387.
