
 ?Mathematical formulae have been encoded as MathML and are displayed in this HTML version using MathJax in order to improve their display. Uncheck the box to turn MathJax off. This feature requires Javascript. Click on a formula to zoom.
ABSTRACT
The culture conditions of Rhodotorula glutinis were optimised to obtain high activity of superoxide dismutase (SOD) enzyme, which is an important member of the antioxidant defence system. By the use of glycerol as a carbon source, which is a by-product of biodiesel production, 2.40 U of SOD activity was achieved under the optimised conditions found by Central Composite Design (pH = 5.47, T = 33.9 °C and 16.50 g L−1 glycerol). In order to provide a further increase in SOD activity, different types of radical promoters were tested and the highest enzyme activity was achieved with methyl viologen, 21.57 U mg−1 protein with a 1.6-fold increase. The effect of dissolved oxygen (DO) on SOD activity was also investigated employing different operational strategies in bioreactors. SOD activity was found to be induced only when high DO concentration was supplied starting from the beginning of the cultivation where the activity of 75 U mg−1 protein was obtained.
Introduction
Superoxide dismutase (SOD; EC 1.15.1.1) is one of the most crucial members of the antioxidant defence (AOD) system in living organisms. It protects the cell against oxidative stress by catalysing the dismutation of superoxide into oxygen and water under both physiological and pathological conditions. SOD exhibits numerous pharmacological activities employed in the treatment of myocardial ischemia, multiple sclerosis, Behçet's disease, colitis, breast cancer [Citation1] and Peyronie's disease [Citation2]. This enzyme also receives considerable attention in cosmetic and dietary fields [Citation3]. SOD is usually extracted from animal tissues. Its commercial source is bovine erythrocytes [Citation4]. However, microbial enzymes have several advantages over plant and animal enzymes. They are more active and stable; moreover, microorganisms are cultured in large quantities in a short time by fermentation [Citation5]. Microbial sources for SOD enzyme reported in the literature are Debaryomyces hansenii [Citation3,Citation4,Citation6,Citation7], Cryptococcus sp. [Citation8], Humicola lutea [Citation9], Kluyveromyces marxianus, Saccharomyces cerevisiae [Citation10] and Aspergillus glaucus [Citation11]. Although the red yeast Rhodotorula glutinis is capable of synthesizing SOD in addition to numerous valuable molecules – mainly carotenoids – that have a potential to be used industrially [Citation12–18], the reports on the production of SOD by this yeast are limited [Citation10,Citation19–21].
Traditionally, the production strategy for an enzyme is based on the investigation of optimum culture conditions not only for the cell growth but also for the enzyme production. For AOD enzymes, this step is then followed by the stimulation of the target enzyme. AOD system molecules are induced when cells encounter excess stress conditions. Thus, different additives, such as H2O2 [Citation22–25], methyl viologen (MV) [Citation26], methylene blue (MB) [Citation14], 2,2′-azobis(2-methylpropionamidine) dihydrochloride (AAPH) [Citation14,Citation27–29] are generally used as a stress inducer and/or radical promoter to increase the production of desired molecules or investigate the mechanisms involved.
Optimization strategies using experimental design are widely employed to evaluate the effects of many distinct factors with fewer experiments and, moreover, to observe the interactions of the parameters with each other. Among these optimization strategies, response surface methodology (RSM) has drawn attention as a useful tool in many fields, including design of experiments and investigation of the effects of significant factors [Citation30]. Another advantage is to search for the simultaneous variation of the factors [Citation31]. RSM has been used for the optimization of different culture media to produce desired enzymes in numerous studies [Citation17,Citation32–36].
In our previous study, we carried out a comprehensive work for the production of antioxidant enzymes, SOD and catalase (CAT) by R. glutinis using the one-pot-at-a-time method, which investigated the composition of the culture medium and the growth conditions [Citation21]. To proceed forward in the production of SOD by R. glutinis, a new study is presented here. This study was designed to (i) optimise the selected significant parameters – temperature, initial medium pH and the concentration of glycerol for SOD activity and cell concentration using RSM; (ii) investigate the effects of radical promoters on SOD activity and (iii) investigate the effects of dissolved oxygen (DO) concentration (%) on SOD activity in a bioreactor.
Materials and methods
Materials
Malt extract, yeast extract and agar were obtained from Scharlau (Barcelona, Spain); glucose was purchased from Applichem (Darmstadt, Germany); and peptone, MV were obtained from Fluka (Missouri, USA). Pyrogallol, MB and H2O2 were supplied from Merck (Darmstadt, Germany); glycerol and AAPH were acquired from Sigma–Aldrich (St. Louis, USA).
Microorganism and culture conditions
The stock culture of R. glutinis (DSM 70398, Braunschweig, Germany) was maintained as described previously [Citation21]. The optimisation of culture medium and condition experiments were conducted in 250 mL Erlenmeyer flasks, using 100 mL of culture media, at 150 r min−1 (Edmund Buhler SM-30, Germany). All cultivations were initialized with A600 = 0.26 ± 0.02 (Shimadzu 1601, Tokyo, Japan).
The concentrations of the radical promoters used to enhance SOD activity – after the determination of the optimum conditions by RSM – were as follows: 20, 50, 100 mmol L−1 for H2O2; 0.5, 1.25, 2.5 mmol L−1 for AAPH; 4 × 10⁻⁵, 8 × 10⁻⁵, 16 × 10−5 mmol L−1 for MV, 8.25, 16.5 and 33 mmol L−1 for MB. SOD activity was measured 8 min after the addition of the chemical promoters, the effect of ultraviolet (UV) radiation (254 nm; Biolab Faster BHG 20047-S, Italy) was tested for 8, 16 and 32 min.
In order to search for the effect of DO concentration (%, air saturation) on the activity of SOD by R. glutinis, scale-up experiments in a bioreactor system were performed (Sartorius Biostat B Plus, Germany). In bioreactor experiments, R. glutinis was inoculated into 150 mL volume of culture medium (3 g L−1 yeast extract, 5 g L−1 peptone, 16.5 g L−1 glycerol, A600 = 0.750 ± 0.03). The cultures were incubated at T = 30 °C, N = 150 r min−1 for 24 h and then transferred to a 1.5-L working volume bioreactor. The bioreactor was held at T = 33.9 °C and N = 500 r min−1; and dry air and/or O2 was supplied to the system at Q/V = 0.67 vvm. Samples were withdrawn at certain periods of time and the variations in SOD activity as well as in biomass were monitored. Biomass determination and cell disruption procedures were performed by the procedures given by Ünlü and Takaç [Citation21].
Protein assay and enzyme activity
The protein analysis was performed with the Bradford [Citation37] assay. SOD activity was measured by the method described by Marklund and Marklund [Citation38]. One unit of SOD activity (U) is the amount that inhibits 50% of pyrogallol autoxidation per minute.
Experimental design and process optimization
RSM was used for the optimization of initial medium pH, temperature and glycerol concentration for increased SOD activity and biomass; using the circumscribed central composite design, which also included axial points beyond the factorial points. Twenty runs were conducted, which included the replication of six runs at the central point, to estimate the experimental uncertainty variance. The runs were conducted in a randomized manner to prevent systematic bias. The results were confirmed by the repetition of the experiments at an optimum level of independent variables. EquationEquation (1(1)
(1) ) presents the relation between the coded and actual values:
(1)
(1)
is the dimensionless value of an independent variable;
is the real value of an independent variable;
is the real value of an independent variable that is at the centre point;
is the step change in variable i, as a real value.
The relationship of the independent variables and the response was calculated by the second-order polynomial:(2)
(2)
is the predicted response;
are parameters;
is the offset term;
is the linear effect;
is the first-order interaction effect;
is the squared effect.
To calculate the second-order polynomial coefficients, to plot the response surfaces and to find the optimum conditions that maximize the responses, Design Expert Version 7.0.0 was used. Additionally, the desirability function D(x) was used to obtain the conditions that maximize both responses. The simultaneous objective function was defined as the geometric mean of the transformed responses:(3)
(3) n is the number of responses; di is the desirable range for response, i.
Data analysis
The experimental data obtained using experimental design were statistically analysed using analysis of variance (ANOVA). The other experimental data presented in this study were repeated at least three times and the values shown are means with standard deviation (±SD).
Results and discussion
Central composite design
Three parameters, initial medium pH (A), temperature (B) and glycerol concentration (C), were found to be factors effecting SOD activity in our previous report [Citation21]. To investigate the joint effect of the selected factors on the SOD activity by R. glutinis and biomass, 20 experiments were performed using circumscribed central composite design. For the correlation of the independent variables with SOD activity and biomass, equations of the second order polynomials were used. The experimental design and the corresponding responses, the coded values of the independent variables and additionally ANOVA results are presented in –. To evaluate the significance of the models and factors at the 95% confidence level, test statistic, F, was utilized. For the SOD activity and biomass, model F-values were calculated as 18.61 and 29.25, respectively, indicating that the models are significant in the goodness-of-fit test. There is only 0.01% chance that a model F-value this large could occur due to noise. The model p-values (Prob > F) were very low (0.0001). This indicated the significance of the models. Non-significant lack-of-fit values (0.79 and 0.62) also further validated the models. The neglecting of the non-significant (p > 0.01) model terms was achieved by a backward elimination method, keeping hierarchy. The resulting reduced designed models (in coded values) for SOD activity and biomass are:(4)
(4)
(5)
(5)
Table 1. Central composite design matrix (experimental variables and responses).
Table 2. Coded values of independent variables (A: initial medium pH; B: temperature (°C); C: glycerol concentration (mg mL−1)).
Table 3. Analysis of variance and coefficient estimates for the second-order model for SOD activity.
Table 4. Analysis of variance and coefficient estimates for second-order model for biomass.
The R2 values for EquationEquations (4)(4)
(4) and (Equation5
(5)
(5) ) were found to be 0.915 and 0.931, respectively. Therefore, about 92% of the variations in biomass and SOD activity could be expressed by the quadratic polynomials. Additionally, the high values of the adjusted determination coefficients (adjusted R2 = 86.6% for SOD activity; adjusted R2 = 89.9% for biomass), support the high significance of the models. In EquationEquation (4)
(4)
(4) , the linear term of temperature (B), the quadratic terms of pH (A2) and glycerol concentration (C2) were obtained as significant model terms for SOD activity. For the other response, R. glutinis biomass (EquationEquation (5)
(5)
(5) ), the significant model terms were found to be the linear term of temperature (B) and the quadratic terms of pH (A2), temperature (B2) and glycerol concentration (C2). The linear term B, temperature, was found to be the most significant (p < 0.0001) for both of the responses, while the linear term A, initial pH of the medium, was found to be the least significant factor.
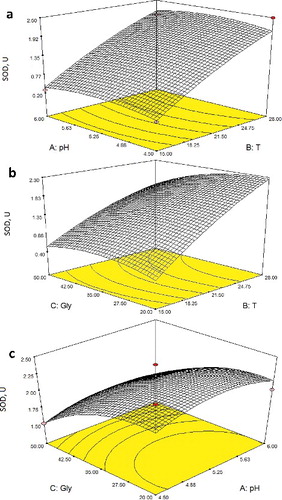
shows the effects of the interaction of glycerol concentration, temperature and initial medium pH on the SOD activity in R. glutinis. SOD activity was found to increase with increasing temperature at constant pH. These results are in agreement with a similar finding reported in another study [Citation39] that investigated SOD activity from Vibrio cholerae non-O1 strains. They reported that SOD activity was 2.5–9.5-fold higher in cells grown at 30 °C than in those grown at 10 °C. On the other hand, in this study SOD activity showed a slight curvature with increasing pH at constant temperature ((a)). (b) was obtained at an initial pH value of 5.70. SOD activity showed an increase with increasing glycerol concentration up to 35 g L−1 and then slightly decreased. Additionally, increasing the temperature had a positive effect on SOD activity. Evaluation of the results presented in (c) showed that the edge values of the initial medium pH (4.5 and 6.0) were observed to have a negative effect on SOD activity. Similarly, increasing glycerol concentration caused a decrease in the activity of SOD. A similar decrease on the synthesis of the antioxidant molecules has been reported at glycerol concentrations above 7.5%, using a mutant of R. glutinis [Citation17].
Figure 1. Response surface and contour plots obtained from EquationEquation (4)(4)
(4) showing the effect of different combinations of factors on SOD activity (U): T–pH (a); T–glycerol (b); pH–glycerol (c).
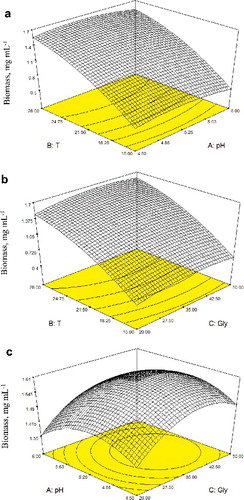
The impact of the selected factors on the second response, biomass, is presented in . The biomass increased with increasing temperature (15–28 °C) at constant pH, in agreement with other reports [Citation15,Citation16,Citation40]. On the other hand, when the initial pH increased from 4.25 to 5.25, the biomass showed a slight increase but decreased towards pH 6 at constant temperature. The results presented in (a) were obtained when the initial pH value was held constant at pH = 5.21. At a constant glycerol concentration, the biomass increased with increasing temperature; however, at constant temperature, the biomass did not change significantly with increasing glycerol concentration. (b) shows the effects of pH and glycerol concentration on biomass at a constant temperature of 27.5 °C. The biomass was observed to be high within 35–45 g L−1 of glycerol concentration and pH = 4.50–5.50.
Figure 2. Response surface and contour plots obtained from EquationEquation (5)(5)
(5) showing the effect of different combination of factors on biomass: T–pH (a); T–glycerol (b); pH–glycerol (c). Note: Solid circles are measured values of biomass.
Optimization and validation of the responses
The optimum conditions that maximized the responses are presented in . Using the optimum conditions for biomass, 1.32 mg mL−1 of R. glutinis cells were obtained, which is close to the predicted response. On the other hand, 2.7 U of total SOD activity was achieved, which is higher than the predicted response. Additionally, a desirability function was used to optimize the two responses together. Interestingly, in that case, the obtained biomass was higher than the predicted value (2.2 mg mL−1), whereas the obtained SOD activity was lower than the predicted value (2.0 U). Therefore, further experiments to stimulate SOD production were performed using the optimum conditions for the SOD response only due to the increased activity value obtained when compared to the response obtained by the desirability function.
Table 5. The optimal values of factors that maximize the responses (A: initial medium pH; B: temperature (°C); C: glycerol concentration (mg mL−1)).
The effect of radical promoters on SOD activity
Different radical promoters were used to generate radicals in the optimum medium conditions for SOD activity. For this purpose, H2O2, UV radiation, AAPH, MV and MB were used for different periods and/or concentrations at the end of 24 h of cultivation (). AAPH was reported to generate radicals very slowly at mild conditions and that this could be enhanced via UV radiation [Citation41]. Thus, AAPH crystals were exposed to 20 min of UV radiation before addition to culture medium. MV is known to promote the formation of superoxide radicals in the cell. On the other hand, MB was used as a singlet oxygen radical generator. The highest specific SOD activity was 21.57 U mg−1, which was 1.6-fold higher than that obtained from cultures grown in the control medium (NA) using MV-II (8 × 10⁻⁵ mmol L−1) followed by 18.74 U mg−1 provided by H2O2-II (50 mmol L−1). However, 100 mmol L−1 H2O2 (H2O2-III), 2.5 mmol L−1 AAPH (AAPH-III) and 33 mmol L−1 MB (MB-III) were found to deactivate enzymes.
Figure 3. Changes in specific SOD activity values with different radical promoters. NA: no additive; UV-I: 8 min, UV-II: 16 min, UV-III: 32 min; MV-I: 4 × 10⁸ mmol L−1, MV-II: 8 × 10⁸ mmol L−1, MV-III: 16 × 108 mmol L−1; MB-I: 8.25 mmol L−1, MB-II: 16.25 mmol L−1, MB-III: 33 mmol L−1; H2O2-I: 20 mmol L−1, H2O2-II: 50 mmol L−1, H2O2-III: 100 mmol L−1; AAPH-I: 0.5 mmol L−1, AAPH-II: 1.25 mmol L−1, AAPH-III: 2.5 mmol L−1; 3 g L−1 yeast extract, 5 g L−1 peptone, 16.5 g L−1 glycerol; initial pH = 5.47, 33.9 °C, 150 r min−1.
The effect of dissolved oxygen concentration in the bioreactor system
To investigate the effect of DO concentration (%, air saturation), which is one of the principle radical-promoting sources, experiments were conducted in a bioreactor system. Three different operation strategies, namely ‘control’, Mode A and Mode B, were used and the following conditions were common for all three strategies: i) the cultures were initialized with DO concentration of 100% of air saturation in the bioreactor, and ii) Q/V = 0.67 vvm of dry air was fed to the systems continuously. The operation strategy that these conditions were maintained was called ‘control’. In Mode A, DO concentration of 100% was maintained throughout the operation. Mode B was operated like the control mode for 24 h. Then, at 24 h, the DO concentration was suddenly increased to 100% and maintained at this level by feeding pure oxygen after 24 h.
The DO concentration (%) of the control medium was observed to decrease until about 15 h and then started to increase ((a)). This increase corresponded to the middle of the logarithmic growth phase ((b)). After a while, as the cell growth rate slowed down, the DO concentration started to increase again. On the other hand, for all three modes, A, B, and control mode, the medium pH increased similarly. In terms of R. glutinis growth, all operation modes were found to have similar effects. However, the biomass was slightly higher (2.47 mg L−1) at Mode B ((b)). Additionally, the cell concentration showed an increasing trend at Mode B. In the literature, high DO concentration has been reported to increase the growth rate of R. glutinis [Citation42,Citation43]. On the other hand, in our experiments, the specific SOD activity reached 75 U mg−1 with a 3.6-fold increase at Mode A when compared to the control mode ((c)). However, operation Mode B did not have any effect on SOD activity, showing variation similar to that in the control medium. Therefore, it may be concluded that high DO (%) should be maintained at the lag phase of growth to increase the SOD activity. Oxygen is reported to have variable effects on SOD activity from other microbial sources. Kreiner et al. [Citation44] reported that the SOD activity in Aspergillus niger increased by feeding oxygen-enriched air at the middle of the logarithmic phase, but that the SOD activity remained constant when the oxygen enrichment was applied from the beginning of the fermentation. However, Pinheiro et al. [Citation45] observed that high oxygen pressure starting from the beginning of the cultivation led to a 6.2-fold increase in the SOD activity in the fermentation of K. marxianus.
Figure 4. Changes in DO concentration (% air saturation) and medium pH (a), biomass (b) and SOD activity (c) with time (Q/V = 0.67 vvm, 33.9 °C, 500 r min−1).
Superoxide dismutase is an intracellular enzyme; thus, the biomass concentration has a critical importance. However, most of the antioxidant molecules are induced at stress conditions, which have a negative effect on biomass, resulting in a conflicting situation. In this report, optimization studies showed that SOD activity and biomass were significantly affected by glycerol concentration. R. glutinis favoured high concentration of glycerol, whereas the stress-induced antioxidant enzyme SOD favoured a lesser amount of glycerol. Radical promoters used to enhance SOD activity provided satisfactory results. Therefore, the combined use of these promoters may be tested together or sequentially, by observing the full inhibition limit in further studies. Additionally, radical promoters may be utilized together with a high DO concentration (%) in a bioreactor to achieve even higher SOD activities in R. glutinis.
Conclusions
To our knowledge, this is the first report presented for the (i) optimisation of SOD activity in R. glutinis fermentation, using an experimental design method, (ii) investigation of the radical promoters on SOD activity by R. glutinis and (iii) investigation of the effect of DO concentration (%) on SOD activity in R. glutinis. The successful use of glycerol in SOD production in this research will not only provide a contribution to development of a sustainable process from biomass, but will also lower the production cost of the enzyme.
Acknowledgments
This research did not receive any specific grant from funding agencies in the public, commercial or not-for-profit sectors.
Disclosure statement
The authors declare that they have no conflict of interest.
References
- El Shafey HM, Bahashwan SA, Alghaithy AA, et al. Microbial superoxide dismutase enzyme as therapeutic agent and future gene therapy. In: Mendez-Vilas A, editor. Current research, technology and education topics in applied microbiology and microbial biotechnology. Vol. 1. Badajoz: Formatex Research Center; 2010. p. 435–443.
- Riedl CR, Sternig P, Galle G, et al. Liposomal recombinant human superoxide dismutase for the treatment of Peyronie's disease: a randomized placebo-controlled double-blind prospective clinical study. Eur Urol. 2005;48:656–661.
- Dellomonaco C, Amaretti A, Zanoni S, et al. Fermentative production of superoxide dismutase with Kluyveromyces marxianus. J Ind Microbiol Biotechnol. 2006;34:27–34.
- Orozco MR, Hernández-Saavedra NY, Valle FA, et al. Cell yield and superoxide dismutase activity of the marine yeast Debaryomyces hansenii under different culture conditions. J Mar Biotechnol. 1998;6:255–259.
- Anbu P, Gopinath SCB, Cihan AC, et al. Microbial enzymes and their applications in industries and medicine. BioMed Res Int. 2013;2013:204014.
- Brioukhanov A, Netrusov A. Catalase and superoxide dismutase: distribution, properties, and physiological role in cells of strict anaerobes. Biochemistry (Moscow). 2004;69:949–962.
- Garcı́a-González A, Ochoa JL. Anti-inflammatory activity of Debaryomyces hansenii Cu, Zn-SOD. Arch Med Res. 1999;30:69–73.
- Abe F, Miura T, Nagahama T, et al. Isolation of a highly copper-tolerant yeast, Cryptococcus sp., from the Japan Trench and the induction of superoxide dismutase activity by Cu2+. Biotechnol Lett. 2001;23:2027–2034.
- Krumova E, Dolashka-Angelova P, Pashova S, et al. Improved production by fed-batch cultivation and some properties of Cu/Zn-superoxide dismutase from the fungal strain Humicola lutea 103. Enzyme Microb Technol. 2007;40:524–532.
- Koleva DI, Petrova VY, Kujumdzieva AV. Comparison of enzymatic antioxidant defence systems in different metabolic types of yeasts. Can J Microbiol. 2008;54:957–963.
- Abrashev R, Feller G, Kostadinova N, et al. Production, purification, and characterization of a novel cold-active superoxide dismutase from the Antarctic strain Aspergillus glaucus 363. Fungal Biol. 2016;120:679–689.
- Bhosale PB, Gadre RV. Production of β-carotene by a mutant of Rhodotorula glutinis. Appl Microbiol Biotechnol. 2001;55:423–427.
- Sakaki H, Nakanishi T, Tada A, et al. Activation of torularhodin production by Rhodotorula glutinis using weak white light irradiation. J Biosci Bioeng. 2001;92:294–297.
- Sakaki H, Nochide H, Komemushi S, et al. Effect of active oxygen species on the productivity of torularhodin by Rhodotorula glutinis No. 21. J Biosci Bioeng. 2002;93:338–340.
- Aksu Z, Eren AT. Production of carotenoids by the isolated yeast of Rhodotorula glutinis. Biochem Eng J. 2007;35:107–113.
- Malisorn C, Suntornsuk W. Optimization of β-carotene production by Rhodotorula glutinis DM28 in fermented radish brine. Bioresour Technol. 2008;99:2281–2287.
- Cutzu R, Coi A, Rosso F, et al. From crude glycerol to carotenoids by using a Rhodotorula glutinis mutant. World J Microbiol Biotechnol. 2013;29:1009–1017.
- Kot AM, Blazejak S, Kurcz A, et al. Rhodotorula glutinis-potential source of lipids, carotenoids, and enzymes for use in industries. Appl Microbiol Biotechnol. 2016;100:6103–6117.
- Yun S, Lee SO, Lee TH. Purification and characterization of superoxide dismutase from Rhodotorula glutinis K-24. Korean J Microbiol. 1993;31:573–578.
- Wang S-L, Chen G-T, Qi G-H, et al. Formulation of culture medium for superoxide dismutase production by Rhodotorula glutinis RY-06 strain with high yield of beta-carotene. In: Zhou H, editor. Proceedings of the 2nd International Conference on Bioinformatics and Biomedical Engineering; 2008 May 16–18; Shanghai, China. Piscataway: (NJ): IEEE; 2008. p. 959–961.
- Ünlü AE, Takaç S. Investigation of the simultaneous production of superoxide dismutase and catalase enzymes from Rhodotorula glutinis under different culture conditions. Artif Cells Blood Subst Biotechnol. 2012;40:338–344.
- Biryukova E, Medentsev A, Arinbasarova AY, et al. Tolerance of the yeast Yarrowia lipolytica to oxidative stress. Microbiology. 2006;75:243–247.
- Kreiner M, Harvey LM, McNeil B. Oxidative stress response of a recombinant Aspergillus niger to exogenous menadione and H2O2 addition. Enzyme Microb Technol. 2002;30:346–353.
- Ma T, Chen T, Li P, et al. Heme oxygenase-1 (HO-1) protects human lens epithelial cells (SRA01/04) against hydrogen peroxide (H2O2)-induced oxidative stress and apoptosis. Exp Eye Res. 2016;146:318–329.
- Fiocchetti M, Cipolletti M, Leone S, et al. Neuroglobin in breast cancer cells: effect of hypoxia and oxidative stress on protein level, localization, and anti-apoptotic function. PLoS One. 2016;11:e0154959.
- Shimada E, Ogawa T, Tsutsui K, et al. Methyl viologen induces neural differentiation on murine P19 cells. In Vitro Cell Dev Biol Anim. 2016;52:466–472.
- Rodriguez-Ruiz V, Barzegari A, Zuluaga M, et al. Potential of aqueous extract of saffron (Crocus sativus L.) in blocking the oxidative stress by modulation of signal transduction in human vascular endothelial cells. J Funct Foods. 2016;26:123–134.
- Cervini-Silva J, Nieto-Camacho A, Gomez-Vidales V, et al. Oxidative stress induced by arsenopyrite and the role of desferrioxamine-B as radical scavenger. Chemosphere. 2013;90:1779–1784.
- Kim G-N, Lee Y-J, Song J-H, et al. Curcumin ameliorates AAPH-induced oxidative stress in HepG2 cells by activating Nrf2. Food Sci Biotechnol. 2013;22:241–247.
- Kalil S, Maugeri F, Rodrigues M. Response surface analysis and simulation as a tool for bioprocess design and optimization. Process Biochem. 2000;35:539–550.
- Choudhari S, Singhal R. Media optimization for the production of β-carotene by Blakeslea trispora: a statistical approach. Bioresour Technol. 2008;99:722–730.
- Singh RS, Singh RP, Kennedy JF. Endoinulinase production by a new endoinulinase producer Aspergillus tritici BGPUP6 using a low cost substrate. Int J Biol Macromol. 2016;92:1113–1122.
- Zahedi F, Shahbazmohammadi H. Medium optimization of a dihydrolipohyl dehydrogenase with diaphorase activity from Bacillus spharicus. In: Mendez-Vilas A, editor. Microbes in the spotlight: recent progress in the understanding of beneficial and harmful microorganisms. Boca Raton (FL): Brown Walker Press; 2016. p. 406.
- Moein S, Mahdizadeh R, Shahbazmohammadi H. Application of response surface methodology to optimize purification of recombinant oxidoreductases. In: Mendez-Vilas A, editor. Microbes in the spotlight: recent progress in the understanding of beneficial and harmful microorganisms. Boca Raton (FL): Brown Walker Press; 2016. p. 385.
- Dias FFG, Ruiz ALTG, Della Torre A, et al. Purification, characterization and anti-proliferative activity of L-asparaginase from Aspergillus oryzae CCT 3940 whit no glutaminase activity. Asian Pac J Trop Biomed. 2016;6:785–794.
- Mahendranath G, Shaik Akbar B, Jamuna JB, et al. Soy whey based medium for optimized phytase activity in Saccharomyces cerevisiae MTCC 5421 and α-D-galactosidase and antibacterial activities in Lactobacillus plantarum MTCC 5422 by response surface methodology. J Sci Food Agri. 2015;95:991–999.
- Bradford MM. A rapid and sensitive method for the quantitation of microgram quantities of protein utilizing the principle of protein-dye binding. Anal Biochem. 1976;72:248–254.
- Marklund S, Marklund G. Involvement of the superoxide anion radical in the autoxidation of pyrogallol and a convenient assay for superoxide dismutase. Eur J Biochem. 1974;47:469–474.
- Abrashev R, Engibarov S, Eneva R, et al. Superoxide dismutase and catalase activities in Vibrio cholerae non-O1 strains. Biotechnol Biotechnol Equip. 2009;23:473–476.
- Zhang Z, Zhang X, Tan T. Lipid and carotenoid production by Rhodotorula glutinis under irradiation/high-temperature and dark/low-temperature cultivation. Bioresour Technol. 2014;157:149–153.
- Pasanphan W, Buettner GR, Chirachanchai S. Chitosan gallate as a novel potential polysaccharide antioxidant: an EPR study. Carbohydr Res. 2010;345:132–140.
- Pan JG, Kwak MY, Rhee JS. High density cell culture of Rhodotorula glutinis using oxygen-enriched air. Biotechnol Lett. 1986;8:715–718.
- Yen HW, Zhang Z. Effects of dissolved oxygen level on cell growth and total lipid accumulation in the cultivation of Rhodotorula glutinis. J Biosci Bioeng. 2011;112:71–74.
- Kreiner M, McNeil B, Harvey LM. “Oxidative stress” response in submerged cultures of a recombinant Aspergillus niger (B1‐D). Biotechnol Bioeng. 2000;70:662–669.
- Pinheiro R, Belo I, Mota M. Oxidative stress response of Kluyveromyces marxianus to hydrogen peroxide, paraquat and pressure. Appl Microbiol Biotechnol. 2002;58:842–847.