
ABSTRACT
With the development of molecular marker technology in the 1980s, the fate of plant breeding has changed. Different types of molecular markers have been developed and advancement in sequencing technologies has geared crop improvement. To explore the knowledge about molecular markers, several reviews have been published in the last three decades; however, all these reviews were meant for researchers with advanced knowledge of molecular genetics. This review is intended to be a synopsis of recent developments in molecular markers and their applications in plant breeding and is devoted to early researchers with a little or no knowledge of molecular markers. The progress made in molecular plant breeding, genetics, genomic selection and genome editing has contributed to a more comprehensive understanding of molecular markers and provided deeper insights into the diversity available for crops and greatly complemented breeding stratagems. Genotyping-by-sequencing and association mapping based on next-generation sequencing technologies have facilitated the identification of novel genetic markers for complex and unstructured populations. Altogether, the history, the types of markers, their application in plant sciences and breeding, and some recent advancements in genomic selection and genome editing are discussed.
Introduction
Information about the genetic variations present within and between various plant populations and their structure and level can play a beneficial role in the efficient utilization of plants [Citation1]. The evolutionary background, process of gene flow, mating system and population density are important factors used in the detection of structure and level of these variations [Citation2]. To investigate the diversity and other important characteristics, different types of agronomic and morphological parameters have been used successfully. During the last three decades, the world has witnessed a rapid increase in the knowledge about the plant genome sequences and the physiological and molecular role of various plant genes, which has revolutionized the molecular genetics and its efficiency in plant breeding programmes.
Genetic markers
Genetic markers are important developments in the field of plant breeding [Citation3]. The genetic marker is a gene or DNA sequence with a known chromosome location controlling a particular gene or trait. Genetic markers are closely related with the target gene and they act as sign or flags [Citation4]. Genetic markers are broadly grouped into two categories: classical markers and DNA/molecular markers. Morphological, cytological and biochemical markers are types of classical markers and some examples of DNA markers are restriction fragment length polymorphism (RFLP), amplified fragment length polymorphism (AFLP), simple sequence repeats (SSRs), single-nucleotide polymorphism (SNP) and diversity arrays technology (DArT) markers [Citation5].
Classical markers
Morphological markers
Morphological markers can visually distinguish qualities like seed structure, flower colour, growth habit and other important agronomic traits. Morphological markers are easy to use, with no requirement for specific instruments. They do not require any specialized biochemical and molecular technique. Breeders have used such type of markers successfully in the breeding programmes for various crops. Main disadvantages of morphological markers are: they are limited in number, influenced by the plant growth stages and various environmental factors [Citation6]. Since ancient times, humans have successfully used various morphological markers to investigate the variation for utilization in plant breeding [Citation7].
Cytological markers
Markers that are related with variations present in the numbers, banding patterns, size, shape, order and position of chromosomes are known as cytological markers. These variations reveal differences in the distributions of euchromatin and heterochromatin. For example, G bands are produced by Giemsa stain, Q bands are produced by quinacrine hydrochloride and R bands are the reversed G bands. These chromosome landmarks can be used in the differentiation of normal and mutated chromosomes. Such markers can also be used in the identification of linkage groups and in physical mapping [Citation5].
Biochemical markers
Biochemical markers, or isozymes, are multi-molecular forms of enzymes which are coded by various genes, but have the same functions [Citation8]. They are allelic variations of enzymes and thus gene and genotypic frequencies can be estimated with biochemical markers. Biochemical markers have been successfully applied in the detection of genetic diversity, population structure, gene flow and population subdivision [Citation9]. They are co-dominant, easy to use and cost effective. However, they are less in number; they detect less polymorphism and they are affected by various extraction methodologies, plant tissues and different plant growth stages [Citation10].
Molecular markers/DNA markers
Molecular markers are nucleotide sequences and can be investigated through the polymorphism present between the nucleotide sequences of different individuals. Insertion, deletion, point mutations duplication and translocation are basis of these polymorphisms; however, they do not necessarily affect the activity of genes. An ideal DNA marker should be co-dominant, evenly distributed throughout genome, highly reproducible and having ability to detect higher level of polymorphism [Citation10].
Classification of molecular markers
Molecular markers are classified into various groups on the basis of:
| (1) | mode of gene action (co-dominant or dominant markers); | ||||
| (2) | method of detection (hybridization-based molecular markers or polymerase chain reaction (PCR)-based markers); | ||||
| (3) | mode of transmission (paternal organelle inheritance, maternal organelle inheritance, bi-parental nuclear inheritance or maternal nuclear inheritance) [Citation11]. | ||||
Different types of DNA molecular markers have been developed and successfully applied in genetics and breeding activities in various agricultural crops. The following section provides some brief information related with molecular markers based on their method of detection. Comparisons of the important characteristics of most commonly used molecular markers are given in .
Table 1. Comparison of important characteristics of the most commonly used molecular markers.
Hybridization-based markers (RFLP)
RFLP was the first molecular marker technique and the only marker system based on hybridization. Individuals of same species exhibit polymorphism as a result of insertion/deletions (known as InDels), point mutations, translocations, duplications and inversions. Isolation of pure DNA is the first step in the RFLP methodology. This DNA is mixed with restriction enzymes which are isolated from bacteria and these enzymes are used to cut DNA at particular loci (known as recognition sites). This results in a huge number of fragments with different length. Agarose or polyacrylamide gel electrophoresis (PAGE) is applied for the separation of these fragments by producing a series of bands. Each band represents a fragment having different lengths. Base-pair deletions, mutations, inversions, translocations and transpositions are the main causes for the variation resulting in the RFLP pattern. These variations lead to the gain or loss of recognition sites, resulting in fragments of various length and polymorphism. The restriction enzymes will not cut the fragment if a single base-pair variation occurs in the recognition site. However, if this point mutation occurs in one chromosome but not the other, it is called heterozygous for the marker, as both bands are present [Citation12].
PCR-based markers
The PCR technique was developed by Cary Mullis in 1983, as a technique which could amplify a small quantity of DNA without the application of any living organisms [Citation13]. Denaturation, annealing and extension are the most important steps involved in PCR reactions. For more information about PCR and its protocol, see the article of Joshi and Deshpande [Citation14].
PCR primers
The primer is a small part of DNA or RNA from which synthesis of DNA starts. The efficiency of a primer plays a vital role in the sensitivity and efficiency of PCR [Citation15]. The primer efficiency depends on the following main factors: (1) primer–template duplex association and dissociation during the annealing step and the extension temperature; (2) stability of the duplex to mismatched nucleotides; (3) efficiency of polymerase in the identification and extension of mismatched duplex. Primer length, GC%, melting and annealing temperature, 3' end specificity and 5' end stability are important features playing an important role in the efficiency of a primer. For a successful PCR, designing of a primer is a most crucial parameter. If all things are balanced except a primer, it will lead to no/false working of the PCR protocol. Primer length is also critical for a successful PCR and normally primers of 18–30 nucleotides in length are considered the best primers. Melting temperatures (Tm) in the range of 52–58 °C provide good results. The GC content is the most important factor affecting the efficiency of a primer; 45%–60% is optimum GC% for a good primer [Citation16].
Randomly amplified polymorphic DNA (RAPD)
This technique was developed by Williams et al. [Citation17] and Welsh and Mcclelland [Citation18] independently. Amplification of genomic DNA is achieved by PCR using single, short (10 nucleotide) and random primer. During PCR, amplification takes place when two hybridization sites are similar to each other and in opposite direction. These amplified fragments are totally dependent on the length and size of both the target genome and the primer [Citation5]. The selected primer should have minimum 40% GC content, as a primer having less than 40% GC content will probably not withstand the annealing temperature (72 °C) where DNA elongation occurs by DNA polymerase [Citation17]. For the visualization, the PCR product is then separated in agarose gel stained with ethidium bromide [Citation19]. Polymorphism present either at or between primer binding sites can be detected in the electrophoresis by confirming the presence or absence of specific bands [Citation5]. The quantity and quality of DNA, PCR buffer, magnesium chloride concentration, annealing temperature and Taq DNA (type of DNA polymerase) are some important factors affecting the reproducibility of randomly amplified polymorphic DNA (RAPD) markers [Citation20].
AFLP
The limitations present in the RAPD and RFLP technique were overcome through the development of AFLP markers [Citation21]. AFLP markers combine the RFLP and PCR technology, in which digestion of DNA is done and then PCR is performed [Citation22]. AFLP markers are cost effective and there is no need of prior sequence information. In AFLP, both good-quality and partly degraded DNA can be used; however, this DNA should not contain any restriction enzymes or PCR inhibitors. For more information, see previous studies [Citation23,Citation24]. In AFLP, two restriction enzymes (a frequent cutter and a rare cutter) are used for the cutting of DNA. Each end of the resulting fragments is ligated with the oligonucleotides. Oligonucleotides are short nucleic acid fragments used for the ligation in PCR [Citation12]. One end is specific for the rare cutter (6-bp recognition site) and the other one, for the frequent cutter (3-bp recognition site). This will lead to the amplification of only those fragments which have been cut by these cutters. For the development of primers, known sequences of adapters are used. Adapters are actually short, enzyme specific DNA sequences generally used for fishing an unknown DNA sequence [Citation21]. After performing PCR, visualization is done in either agarose gel or polyacrylamide gel stained with AgNO3 or by autoradiography [Citation12].
SSRs or microsatellites
Microsatellites [Citation25] are also called as SSRs; [Citation26], short tandem repeats and simple sequence length polymorphisms [Citation27]. SSRs are tandem repeat motifs of 1–6 nucleotides that are present abundantly in the genome of various taxa [Citation28]. Microsatellites can be mononucleotide (A), dinucleotide (GT), trinucleotide (ATT), tetranucleotide (ATCG), pentanucleotide (TAATC) and hexanucleotide (TGTGCA) [Citation29]. Microsatellites are distributed in the genome; however, they are also present in the chloroplast [Citation30] and mitochondria [Citation31]. Studies have also confirmed the presence of SSRs in protein-coding genes and expressed sequence tags (ESTs) [Citation32]. SSRs represent the lesser repetition per locus with higher polymorphism level [Citation33]. This high polymorphism level is due to the occurrence of various numbers of repeats in microsatellite regions and can be detected with ease by PCR [Citation34]. Occurrence of SSRs may be due to slippage of single-strand DNA, recombination of double-strand DNA, transfer of mobile elements (retrotransposons) and mismatches. Common motifs present in SSRs are Mono: A, T; Di: AT, GA; Tri: AGG; Tetra: AAAC. Mainly the sequences which are flanking the SSRs are conserved and are used in the development of primers. Development of a genomic library and sequencing a segment of the studied genome will result in the development of these primers. For more information related to the development of SSRs, see the review by Kalia et al. [Citation34]. The development of SSR markers involves the development of an SSR library and then detection of specific microsatellites. After this, the detection of favourable regions for primer designing is done and then PCR is performed. Interpretation and evaluation of banding patterns are performed and assessment of PCR products is performed for investigation of polymorphism [Citation35]. SSR markers are considered a marker of choice, as they are co-dominant, with high reproducibility and greater genome abundance, and they can be used efficiently in plant mapping studies [Citation26,Citation34].
Chloroplast microsatellites (cpSSRs)
It is difficult to detect enough sequence variations due to lesser mutation rates that characterize the chloroplast genome. Contrary to this, cpSSRs provide higher polymorphism levels with easily genotyping, which has made them a very handful and popular marker for population genetic studies [Citation30]. cpSSRs typically contain mononucleotide motifs which are repeated 8–15 times. The polymorphism level in cpSSRs is quite changing across species and loci. Two important features distinguishing the cpSSRs from nuclear microsatellites are (i) chloroplasts are inherited uniparentlly and (ii) the chloroplast chromosome is a non-recombinant molecule due to which all cpSSRs loci are linked [Citation36]. CpSSRs have been successfully applied in agriculture and basic plant sciences [Citation37]
Mitochondrial microsatellites
Plant mitochondrial DNA (mtDNA) is very dynamic, with the largest and the least gene density among eukaryotes. Its size ranges between 200 and 2500 kb and consists of different repeated elements and introns [Citation38]. Plant mtDNA is larger as compared to the animal mtDNA and is characterized by molecular heterogeneity seen as groups of circular chromosomes which differ in size and abundance. The evolution rate of mtDNA markers is slow, which is regrettable for plant population biologists; these markers have very limited application in population genetics. mtDNA markers exhibit many limitations like the fact that they represent only a single locus; uncertainty in genealogical analysis can be increased due to increased probability of missing links in mitochondrial haplotypes and underestimation of genetic diversity [Citation39].
RAMP (Randomly amplified microsatellite polymorphisms)
Microsatellite markers exhibit greater level of polymorphism with the drawback of being labour intensive. While RAPD markers are cost effective as compared to microsatellites, their level of polymorphism detection is low as compared to that of microsatellite markers. To overcome the imperfection of these two methods, randomly amplified microsatellite polymorphisms (RAMP) markers were developed [Citation40]. This marker system involves an SSR primer which is utilized for the amplification of genomic DNA in the absence or presence of RAPD primers. SSR primers are radiolabeled consisting of a ‘5’ anchor and ‘3’ repeats. The resulting products are resolved using submarine agarose electrophoresis [Citation41]. The melting temperature of this marker system is maintained 10–15 °C higher for the anchored primers as compared to the RAPD ones, which helps in the efficient annealing of the anchored primer [Citation40]. RAMP markers are cost effective, reflect higher polymorphism and have wide distribution in the genome. They have been successfully applied in various plants for molecular characterization [Citation40,Citation41].
Sequence-related amplified polymorphism (SRAP)
Li and Quiros [Citation42] developed this method mainly for the amplification of open reading frames (ORFs). This marker system is based on amplification using two primers. The primers used for this marker system are 17–18 nucleotides long. They use the CCGG sequence in the forward primer and AATT in the reverse primer, and the annealing temperature in the first five cycles is set at 35 °C during PCR. The reaming 35 cycles are run at 50 °C annealing temperature. The PCR amplified product is then loaded on gel electrophoresis and DNA bands are visualized through autoradiography. Sequence-related amplified polymorphisms (SRAPs) are dominant in nature and DNA fragments are scored by the presence or absence of a band. This is a simple and efficient marker system which is widely used in a range of fields, including map construction, genomic and cDNA fingerprinting [Citation41]. SRAP is a dominant marker system which has been successfully applied to investigate the genetic variations in different taxa [Citation43].
Inter simple sequence repeat (ISSR)
This technique was developed by Zietkiewicz et al. [Citation44]. It is based on amplification of DNA segments located in between two identical but oppositely oriented microsatellite repeat regions, at a distance which allows amplification. Primers used in this technique are also known as microsatellite and they might be di-, tri- and tetra- or penta-nucleotide repeats. Normally long primers having a size of 15–30 bases are used in this technique. The primers used in Inter simple sequence repeat (ISSR) may be unanchored [Citation45] or more typically they are anchored at the 3′ or 5′ end having 1 to 4 degenerate bases, which are extended into the flanking sequences. ISSR allows the successful usage of high annealing temperature (about 45–60 °C); the amplified products are 200–2000 bp long and can be visualized through agarose or PAGE [Citation46,Citation47]. Segregating by simple Mendelian laws of inheritance, they are characterized as dominant markers [Citation44,Citation48]; however, they can also be used in the development of co-dominant markers [Citation49]. ISSRs are simple, easy to understand as compared to RAPD and there is no need of prior knowledge of DNA sequences [Citation50,Citation51]. However, they are dominant markers and they have less reproducibility with homology of co-migrating amplification products [Citation11].
Retrotransposons
Transposons are mobile genetic elements capable of changing their locations in the genome. Transposons elements were discovered in maize almost 60 years ago [Citation52,Citation53]. There are two classes of transposable elements. Class I known as retro-elements, such as retrotransposons. Retrotransposons may be short interspersed nuclear elements or long interspersed nuclear elements and they are the mRNA-encoded element. In this class, a new copy of transposon is produced after each transposition event; however, the original copy remains intact at the donor site. Class II contains DNA transposons and their locations change by the cut-and-paste method in the genome [Citation53]. Retrotransposons are an important class of repetitive DNA constituting 40%–60% of the entire plant genome [Citation53,Citation54]. Retrotransposons belong to class I of transposon elements and they transpose through an RNA intermediate, which is not present in class II transposable elements [Citation52]. Retrotransposons are grouped into two subclasses on the basis of their structure and transposition cycle. Long terminal repeats (LTRs) retrotransposons (LINE; long interspersed nuclear elements) and non-LTR retrotransposons (SINE; short interspersed nuclear elements). These two subclasses can be differentiated based on the presence or absence of LTRs at their ends [Citation55]. LTR retrotransposons are widely distributed in the plant genome and in many crop plants, nearly 40%–70% of their DNA contains LTR retrotransposons [Citation56,Citation57]. On the basis of integration, target site duplications of 4–6 bp are often produced by LTR retrotransposons. LTR retrotransposons contain ORFs, POL and GAG, as they are widely distributed within plant genomes [Citation58]. LTR retrotransposons are further divided into Ty1/copia and Ty3/gypsy retrotransposons on the basis of encoded gene order [Citation59]. Class II of transposable elements is further divided into terminal inverted repeat (TIR) and non-TIR subclasses [Citation60]. As transposon elements have great abundance and wide dispersion in the genome, they are an ideal source for the development of molecular markers [Citation61]. The following are some important retrotransposon-based molecular markers.
IRAP
Inter-retrotransposon amplified polymorphism (IRAP) is a retrotransposon-type marker developed by Kalendar et al. [Citation62]. Sequences present between two adjacent LTR retrotransposons are amplified by the IRAP system through the application of primers which are complementary to the LTR sequence 3' end. The orientation of these LTR sequences can be (1) tail–tail, (2) head–head and (3) head–tail [Citation63]. Identical sequences are present in different strands that are separated by small inter-genic distances in head-to-head arrangement and are transcribed away from each other. However, in those with tail-to-tail orientation, the arrangement is opposite to the head-to-head one and they are transcribed towards each other. Both 5' and 3' primers are used for head-to-tail LTRs, while a single primer is used for those with head-to-head or tail-to-tail arrangement. Agarose gel is used to resolve the IRAP product [Citation64]. A single IRAP reaction can produce many amplicons having different sizes ranging between 300 and 3000 bp [Citation65].
REMAP
Retrotransposon microsatellite amplification polymorphisms (REMAP) is an important retrotransposon-based marker commonly used to analyse the genetic diversity. The REMAP protocol is similar to IRAP; however, in REMAP, SSRs (microsatellites) are used in conjunction with specific primers of LTR during PCR [Citation62,Citation64]. During REMAP PCR, those primers are selected for microsatellite loci which contain a repeat motif anchored nucleotide at the 3' end aiming to avoid the primer slippage between individual SSR motifs [Citation59].
Retrotransposon-based insertion polymorphism (RBIP)
This technique was developed by Flavell et al. [Citation66]. In it, the presence or absence of retrotransposon sequences is investigated, which can be used as molecular marker. In this technique, DNA amplification is achieved through a primer having 3' and 5' end regions flanking the retrotransposons insertion site. Detection of the presence of insertion is achieved through the development of primer from LTR. Sequence information about the regions flanking the retrotransposon insertion sites is needed in this technique and it results in the typing of a single locus as compared to other retrotransposon-based markers [Citation65]. Agarose gel electrophoresis is used for the detection of polymorphism [Citation67]. Tagged microarray marker, which is based upon fluorescent microarray marker scoring, is used for high-throughput retrotransposon-based insertion polymorphism (RBIP) analysis [Citation68].
Inter-primer binding site (iPBS)
The requirement for prior knowledge about the sequence of LTR is a big problem while using all retrotransposon-based markers. To obtain such information, cloning and sequencing of LTR is performed. To solve this problem, primer binding sites (PBSs) of retrotransposons are used in this technique. A tRNA complement is present in all LTR retrotransposons and retroviruses. PBSs are their binding sites adjacent to the 5' LTR and are highly conserved. Reverse transcription starts when the tRNA binds its 3' terminal sequences with the primer binding site. The role of primers is to bind in this area and amplification of diverse sequences is performed. Mostly retrotransposons are mixed, inverted, nested or truncated in the chromosomal sequences and their amplification can be achieved by using a conservative PBS primer. LTRs present in fragments having retrotransposons as their internal part are present with the other retrotransposons and result in close occurrence of PBS sequences with each other. PBS is a universal method, as they occur in all LTR-based retrotransposon sequences [Citation69]. Recently, inter-primer binding site (iPBS) markers have emerged as the most important and universal method for the identification of genetic diversity and relationships in various plants [Citation61,Citation69, Citation70].
Cleaved amplified polymorphic sequences (CAPS)
Cleaved amplified polymorphic sequence markers (CAPS) originally named as the PCR–RFLP markers due to combination of RFLP and PCR [Citation71]. In this technique, target DNA is amplified using PCR and then its digestion is performed with restriction enzymes [Citation72,Citation73]. Agarose gel or acrylamide gel is used for the visualization of CAPS products. The primers used in this technique are developed from sequence information present in a databank of genomics or cloned RAPD bands or cDNA sequences. CAPS markers are versatile and the possibility to find DNA polymorphism can be increased by combining CAPS with single-strand conformational polymorphism, SCAR, AFLP or RAPD [Citation67]. CAPS markers are co-dominant markers and have been used in genotyping, map-based cloning and molecular identification studies [Citation74,Citation75].
SCAR (Sequence-characterized amplified regions)
Sequence-characterized amplified region (SCAR) markers were first developed in 1993 by Paran and Michelmore in lettuce for downy mildew resistance genes [Citation76]. SCAR markers are more specific and more reproducible as compared to RAPD [Citation77]. SCAR markers are co-dominant and mono-locus markers and are mostly applied for physical mapping [Citation78]. The procedure for the development of SCAR markers includes purification of PCR fragments followed by designing of SCAR primer [Citation76–79]. Polymorphic bands are detected by using agarose gel and then the nucleotide sequence of the selected fragment of DNA is investigated. Analysis of the sequence of this polymorphic DNA is made by comparing it with the known DNA sequences available at the NCBI (National Center for Biotechnology Information) database for sequence uniqueness. Then this nucleotide sequence of polymorphic DNA is utilized for the synthesis of specifics SCAR primers [Citation78].
Sequence-based markers
Sequencing is a technique in which nucleotide bases and their order is identified along the DNA strand [Citation80], and molecular markers which are based on the identification of a particular sequence of DNA in a pool of unknown DNA are known as sequence-based markers. The development of this technology resulted from the fact that hybridization-based markers are less reliable and polymorphic. The advent of the sequencing technologies like next-generation sequencing (NGS) and genotyping by sequencing (GBS) revolutionized the plant breeding through development of SNPs resulting in high polymorphism [Citation81]. Various types of sequencing technologies have been developed so far and have been reviewed briefly by Heather and Chain [Citation82]. However, some important sequencing methods are also described as follows.
Sanger method of sequencing
The plus-and-minus method was the first method of DNA sequencing. It was used by Sanger and Coulson [Citation83]. The basic principle of this method is that single-stranded DNA molecules which show length differentiation of a single nucleotide can be separated from each other with the help of PAGE. This method is also known as Sangers's dideoxy sequencing method, as it uses modified bases known as dideoxy nucleotides [Citation82]. During the early studies, bacteriophage T4 DNA polymerase and DNA polymerase I from Escherichia coli were used in this method [Citation84,Citation85]. The resultant polymerization products were loaded onto acrylamide gels and resolved through ionophoresis. However, this method contains a lot of limitations; hence, after two years, Sanger and his team introduced a new technique for sequencing in which oligonucleotides were sequenced by polymerization by enzymes [Citation86]. This method facilitates the maximum measurement of variations. It has high reproducibility and requires a low quantity of DNA. However, this method is costly, time consuming, with low genome coverage and detects less polymorphism below the species level [Citation80].
Pyrosequencing
Pyrosequencing is a synthesis principle-based sequencing technique [Citation87] in which phosphate is identified during the synthesis of DNA [Citation88]. In this method, the primer used for sequencing is hybridized with a single-stranded DNA template which is biotin-labelled and is combined with specific enzymes [Citation89]. Deoxynucleoside triphosphates are added separately in the reaction mixture using four cycles. The reaction begins with the polymerization of nucleic acid where PPi (pyrophosphate), which is inorganic in nature, released. As the nucleotides are added, the reaction is accompanied by continuous release of inorganic phosphate and this released PPi is in equal amount to the incorporated nucleotide. Initially, the activity of DNA polymerase was monitored by this technique. Solid phase sequencing [Citation90] and liquid phase sequencing [Citation91] are two types of pyrosequencing.
Next-generation sequencing (NGS)
The development in the sequencing techniques increased the demand for extensive throughput sequencing at a low cost. This demand led to the development of NGS and currently this technique produces millions of sequences. This technique has the ability to produce several hundreds of millions to several hundreds of billions of DNA bases per run [Citation92]. Many organizations have developed this technique successfully and they provide their services commercially, such as Illumina MiSeq and HiSeq 2500 [Citation93], Roche 454 FLX Titanium [Citation94] and Ion Torrent PGM [Citation95]. These NGSs resulted in low prices with covering whole genome more precisely [Citation96]. Similar methodology is used in all NGS techniques for the preparation of template DNA, where fragments of DNA are randomly sheared and ligated at both ends with universal adapters. This sequencing is performed in constant channel and one or more nucleotides are incorporated, resulting in the release of a signal that is detected by a sequencer [Citation97]. Some advantages of NGS are (1) NGS is more accurate to older sequencing methods and (2) low in cost with high throughput. (3) Recently, this technique is being used in whole genome sequencing in order to investigate the maximum numbers of SNPs and for consideration of diversity present within the species, construction of linkage/halophyte maps and in genome-wide association studies (GWAS) [Citation98]. (4) Sequencing of older DNA samples is also performed by NGS and this technique has strengthened the field of metagenomics [Citation99].
Genotyping by sequencing (GBS)
GBS is a simple and multitudinous technique successfully used nowadays. This technique was developed in the Buckler lab under the Illumina NGS platform. Modernization in the NGS technique has lowered the sequencing costs, assuring the successful application of GBS for large genome species having great magnitude of diversity [Citation98]. On the basis of ion PGM system usage, there are two types of GBS techniques: (1) Digestion of restriction enzyme: this method is mainly used in marker-assisted selection (MAS) programmes for the identification of new markers and here no particular SNPs are identified. In this method, prior to the ligation of adapters, DNA is digested with one or two specific restriction enzymes. (2) Multiplex enrichment PCR: In this technique, specific PCR primers are selected for the amplification of points of interest. In contrast to the digestion in the restriction enzyme method, a complete set of SNPs are identified for a genome section. GBS was basically developed to investigate the high-resolution association in maize and now it is used for many other species having a complex genome. Main advantages of GBS are (I) less cost as compared to the other techniques, which made GBS a novel technique for the identification of SNPs in different species and crops. (II) This technique provides satisfactory results in the characterization of germplasm, population studies and breeding of diverse crops [Citation100]. (III) GBS produces a great magnitude of SNPs which are used in genotyping and genetic analysis [Citation101]. (IV) It lowers the handling of samples and (V) includes less PCR and purification sets [Citation81].
On the basis of the sequencing techniques outlined above, the following sequence-based markers have been developed.
Single-nucleotide polymorphism (SNP)
Single base-pair changes present in the genome sequence of an individual are known as SNPs. SNPs may be transitions (C/T or G/A) or transversions (C/G, A/T, C/A or T/G) on the basis of the nucleotides substitution. Normally, in mRNA, single base changes are present, including SNPs that are insertion/deletions (InDel) in a single base. A single-nucleotide base is the smallest unit of inheritance and SNP can provide the simplest and maximum number of markers. SNPs are present in abundance in plants and animals and the SNP frequency in plants ranges between 1 SNP in every 100–300 bp [Citation102]. SNPs are widely distributed within the genome and can be found in coding or non-coding regions of genes or between two genes (intergenic region) with different frequencies [Citation102]. A large number of methods for SNP genotyping have been developed based on different techniques of allelic discrimination and detection platforms. Among these, RLFP (SNP–RFLP) is the simplest and easiest method and the CAPS marker technique also can be applied in the SNP detection. If binding sites for restriction enzymes are present on one allele, while other alleles have no binding site, their digestion will result in fragments of various length. Identification of SNPs is achieved through the analysis of sequence data stored in databases. Different kinds of SNPs genotyping assays have been developed based on different molecular mechanisms. Among them, primer extension, invasive cleavage, oligonucleotide ligation and allele-specific hybridization are most important [Citation103]. Various recent high-throughput genotyping methods like NGS, GBS and chip-based NGS, allele-specific PCR makes SNPs as the most attractive markers for genotyping [Citation67].
Diversity array technology (DArT Seq)
It is a technique that provides a great opportunity for the genotyping of polymorphic loci (in several hundreds to several thousands), which are distributed over the genome. It is highly reproducible microarray hybridization technology. There is no need of previous sequence information for the detection of loci for a trait of interest [Citation104,Citation105]. The most important benefit of this technique is that it is highly throughput and very economical. To discover polymorphic markers by this technology, a single-reaction assay can genotype several thousand genomic loci. As little as 50–100 ng genomic DNA is sufficient for the genotyping purpose. For the scoring and discovery of markers, an identical platform is utilized. After the discovery of a marker, there is no need of specific assays for genotyping, except starting polymorphic markers assembly into an array of a single genotype. These polymorphic markers within the genotyping arrays are commonly used for genotyping [Citation106]. The advantages and disadvantages of different genetic markers are described in .
Table 2. Advantages and disadvantages of different genetic markers.
Uses of molecular markers in plant sciences
Evolution and phylogeny
In the past, initial studies related to evolution were totally dependent on the geographical and morphological changes among the organisms. Advancements in the techniques of molecular biology offer extended information related to the genetic structure [Citation107]. For the reconstruction of a genetic map, in order to get full information about the phylogeny and evolution, molecular markers are being used on a large scale nowadays [Citation108–111]. Molecular studies related to phylogeny are largely dependent on chloroplast genome sequence data due to their simple and stable genetic nature, making them ideal markers in the evaluation of plant phylogeny [Citation112,Citation113].
Investigation of heterosis
Heterosis describes the greater performance of progeny (F1) over the mean of the two crossed parents. If the effect in F1 is greater than that in its parents, such heterosis is known as positive heterosis; while where the effect in F1 is lower than in its parents, such type of heterosis is known as negative heterosis [Citation114]. Various studies have been conducted by using molecular markers in various crop plants such as wheat [Citation115], maize [Citation116] and rape seed [Citation117], to investigate the genetic diversity and heterosis. Molecular markers like SSRs have been used in the investigation of diversity and heterosis in rice [Citation118]. Recently, SSR markers were applied in order to investigate the heterotic groups and patterns in rice [Citation119]. Some studies have used transcriptome analysis to analyse the genes involved in heterosis [Citation120,Citation121].
Identification of haploid/diploid plants and cultivars genotyping
Haploids are plants having a single set of gametophytic chromosomes and diploids are plants with two copies of each homologous chromosome [Citation122]. These haploid/double-haploid (DH) plants are very important because they are used as a mapping population for quantitative trait loci (QTL) mapping [Citation123] and in other breeding and genetic studies. DH plants are very important in the integration of physical and genetic maps and thus allow the accurate detection of candidate genes of interest [Citation124,Citation125]. The R1-nj (Navajo) anthocyanin colour marker has been successfully applied for the identification of haploids [Citation126]. Similarly, SSR and SNP markers have been applied to detect DH and genotypes of isogenic lines and hybrids [Citation127–129].
Genetic diversity assessment
Recent advancements in molecular markers and genome sequencing offer great opportunity to investigate the genetic diversity in a very big germplasm [Citation111,Citation130,Citation131]. Genetic diversity assessment is very helpful in the study of the evolution of plants and their comparative genomics, helping to understand the structure of different populations [Citation132–134]. Genetic markers have been successfully applied in the determination of genetic diversity and the classification of genetic material [Citation135–137]. DArT markers and SNPs markers are the most commonly used markers for the determination of genetic diversity in various crops [Citation138].
Utilization of molecular markers in backcrossing for a gene of interest
Introgression is a technique in which some genes of interest are transferred from plant genetic resources (PGR) to crop varieties. In this technique, some desired traits are selected from exotic germplasm and transferred into crop plants by backcrossing [Citation139]. MAS has played an important role in the usage of wild genes and their transfer into crop plants. Many genes of interest from wild plants have been transferred in nearly all economically important cultivated plants. Mainly SSR markers are used for this purpose. Two SSR markers have been successfully used to transfer the Lgc-1 locus related to low gluten level in japonica rice with 93–97% selection efficiency [Citation140]. Barley yellow mosaic virus is an important disease in barley and rym4 and rym5 are genes incurring resistance to this disease and variety of markers have been developed for the selection of these genes [Citation141].
Genetic mapping
Genetic mapping employs methods for identification of the locus of a gene as well as for determination of the distance between two genes. Gene mapping is considered as the major area of research in which molecular markers are used today. The principle of genetic mapping is chromosomal recombination during meiosis which results in the segregation of genes. Markers present close to the gene of interest on the same chromosome are known as linked markers.
QTL mapping
Most agricultural traits of economic interest are polygenic and quantitative in nature and are controlled by many genes on the same/different chromosome. The chromosomal regions having genes for these quantitative traits are referred to as QTL. QTL mapping is a method in which molecular markers are utilized to locate the genes that affect the traits of interest. Such traits are divided into two groups: one is quantitative and the second one is qualitative traits. Discontinuous variations can be shown by qualitative traits, while continuous variation occurs in quantitative traits. For QTL study, molecular markers are very important and considered as an ideal tool for the purpose; they can be used for MAS as well [Citation142]. Some important steps in QTL mapping include the selection of two diverse parents having allelic variations that affect the trait of interest. After the phenotyping of the mapping population, polymorphic markers are used to obtain the genetic data. Then the genetic map is constructed and some statistical programs are applied to identify molecular markers linked with the trait of interest [Citation4]. The QTL mapping methodology is described in .
Figure 1. QTL mapping methodology.
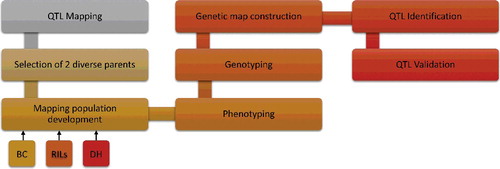
QTL mapping populations
For QTL mapping, two diverse parents should be selected and they should be diverse enough to exhibit an adequate level of polymorphism. Near-isogenic lines (NILs), DHs, backcrosses (BCs), recombinant inbred lines (RILs) and F2 populations can be used as the mapping population [Citation143]. Practically 50–250 individuals are selected in a mapping population but for high-resolution and fine mapping, a larger size of the mapping population is required [Citation144,Citation145].
Selection of markers for QTL mapping
Different types of markers like RFLP, AFLP, ISSR, SSR, ESTs, DArT and SNPs have been commonly used for the construction of linkage maps in several plants [Citation11]. Normally, for genetic mapping studies, 100–200 markers have been used for linkage maps construction [Citation144]. The marker number, however, varies according to the studies and directly depends on the species genome size, as larger genome sized species require a larger number of markers. However, with the advent of NGS, several thousands of DNA markers are now utilized for high-resolution genetic mapping [Citation145,Citation146].
Genetic/linkage map construction
The linkage map is a road map that describes the position and relative genetic distance between markers [Citation143]. QTL mapping is based on marker segregation via chromosome recombination during meiosis, in which those markers which are tightly linked with each other will be transferred together more commonly during recombination as compared to those which are away from each other. This recombination frequency is used to calculate the recombination fractions. Through the segregation analysis, the actual distance and relative order of markers can be calculated [Citation4]. Odds ratios (the ratio of linkage versus no linkage) are used for the calculation of the linkage between markers. This value is called LOD, or logarithm of odds [Citation147]. For the construction of linkage maps, LOD values of >3 are considered ideal [Citation4].
QTL detection
The most important methods developed for QTL detection are single-marker analysis (reviewed in [Citation148]), simple interval analysis (reviewed in [Citation149]) and composite interval analysis [Citation150]. Some most important statistical programs commonly used in QTL mapping are: R [Citation151], QTLNetwork [Citation152], PLABQTL [Citation153], QGENE [Citation154] and MapChart [Citation155].
Factors affecting the QTL detection
The detection of QTLs in a segregating population is affected by several factors. Among these; genetic properties of QTL, environmental factors, experimental errors in phenotyping and size of population are main factors affecting the QTL detection [Citation146]. The environment directly affects the expression of quantitative traits and when some experiments are conducted on the same sites for various seasons, it helps to detect the effects of environments on the QTL having influence on the traits of interest [Citation156]. The population size directly influences the QTL mapping studies. A larger sized population results in the more precise mapping and also facilitates the detection of the QTLs with less pronounced effects [Citation148,Citation157]. The experimental errors include the errors arising from imprecise phenotyping and genotyping. Non-accurate phenotypic data and errors in genotypic data influence the distance between markers [Citation158]. Several QTLs have been described in the literature for different traits of interest but most of the QTLs are false due to errors in phenotyping at multi locations and involvement of different factors in field experiments.
QTL validation
After the QTL detection, it is necessary to validate that particular QTL. For this purpose, diverse populations will be developed by crossing different parents in order to check the presence of a particular QTL in other populations with different genetic background. NILs are commonly used for the confirmation and validation of QTL [Citation4]. NILs have been used to precisely evaluate the effect of different pollen sterility loci in rice [Citation129]. Confirmation of QTL provides the information about the marker to be used or not for MAS [Citation159].
QTL cloning
Large numbers of QTLs have been isolated in plants and are mostly cloned by positional cloning. Positional cloning is also known as map-based cloning. Map-based cloning is mainly applied for detection of the genetic basis responsible for a mutant phenotype [Citation160]. Map-based cloning facilitates the allocation of a QTL having a very small genetic interval and to detect the distance on the DNA sequence. In QTL mapping, mapping populations are developed and molecular markers are then used to assign the shortest genetic distance and to detect the distance on the DNA sequence. Advancement in the sequencing technologies saves time and helps in the detection of accurate and tightly linked QTLs. These new sequencing techniques provide precise results and save more time as compared to map-based cloning. However, these high-throughput techniques are costly, as they require high initial cost. Some important steps in positional cloning are development of NILs or F2 or a backcross population. Phenotyping of these populations is performed and their screening is done with different molecular markers; however, newly developed methods, i.e. NGS and MassARRAY System, can help in the more and fast detection of SNPs [Citation81]. Fine mapping is performed for the construction of a genetic map with the polymorphic marker to locate a very small genetic interval. Larger numbers of individuals are used in fine mapping to increase the recombination rate, which results in a decreased interval up to 0.16 cM. Nearly 3000–4000 plants should be used as the mapping population and 600 plants as first-pass mapping population in order to achieve higher level of recombination [Citation160]. Such markers should be selected which are tightly linked. A physical map is constructed as the genetic resolution reaches the 0.1-cM level. Anchoring of the genetic map to the physical map is achieved by the utilization of markers near to the QTL [Citation160,Citation161]. A candidate gene is selected and sequenced to design specific primers for PCR amplification of the candidate gene [Citation162].
Chromosome walking
The interval between a QTL and a marker can be decreased by chromosome walking/genome walking. Chromosome waking is a method of positional cloning mainly performed for the identification and isolation cloning of a particular allele. This is a very efficient technique used in the identification of unknown regions flanking a known DNA sequence. During the chromosome walking procedure, first, large insert libraries are developed and then positive clones are identified with a series of cloning steps so that walking should be achieved towards the gene of interest. Different types of chromosome walking techniques have been developed, including inverse PCR [Citation163] and vectorette PCR [Citation164]. In these techniques, restriction enzymes are used for the digestion of genomic DNA and then genomic DNA is ligated. Then PCR is performed for the amplification of flanking regions where the ligated product is utilized as template. For the detection and isolation of promoter elements, genome walking kits are now available on the market [Citation165]. The main disadvantage of map-based/positional cloning is that it is a very time-consuming and laborious technique.
Advantages and drawbacks of QTL mapping
QTL mapping is used to detect the genes which control the trait of interest [Citation144]. It is very useful for the genome-wide scan for QTLs detection in plants. Diseases are a big concern in agriculture and genes responsible for generation of resistance to these diseases can be detected by QTL mapping [Citation166]. Some important drawbacks of QTL mapping include less allelic diversity, lower number of recombination events [Citation167], being time consuming in case of mapping population development [Citation168] and specificity of the detected QTLs to a given population [Citation169].
Association mapping (AM)
Association mapping (AM) is significant association of molecular markers with a phenotypic trait. Statistically, AM is the covariance between the polymorphism present in the marker and the trait of interest [Citation170,Citation171]. It is more time saving as compared to linkage mapping and provides greater mapping resolution with a higher number of recombination events. AM facilitates the identification of a greater number of alleles due to availability of more genetic variations with larger background; historically measured phenotypic data can also be used for AM [Citation172,Citation173].
Why association mapping?
Linkage mapping, known as bi-parental mapping, is a classical mapping technique used to study the linkage in several plant species over 20 years [Citation174]. The major limitations of QTL mapping are described above and these limitations could be overcome by the introduction of linkage disequilibrium (LD)-based AM [Citation175,Citation176].
Linkage disequilibrium (LD)
Non-random association of alleles at different loci is known as LD. LD describes the increased or decreased (non-equal) frequency of haplotypes in a population. LD can be described as PAB ≠ PA × PB [Citation177], where A and B are two alleles present at different loci; PAB describes the frequency of haplotypes having both alleles at the two loci; PA and PB show the frequency of haplotypes having a single A or B allele, respectively. LD is also known as gametic phase disequilibrium or gametic disequilibrium [Citation166]. In 1917, LD was first defined by Jennings and quantified in 1964 by Lewtonin (reviewed in [Citation178]). It is necessary to obtain knowledge about the LD patterns for the genomic areas of the targeted organism. Similarly, there should be prior knowledge about the specificity of the extent of LD present between various populations. The square of the correlation coefficient (r2) and the disequilibrium coefficient (D′) are two widely used statistical methods for measuring the LD. GOLD [Citation179], R and TASSEL [Citation180] are the most commonly used software applications to describe the structure and pattern of LD.
Factors affecting LD
Genetic and demographic factors are responsible for generating haplotypic blocks [Citation177]. Recombination and mutation are responsible for the significant LD. New mutations, autogamy, epistasis, genetic isolation, population size, selection, kinship and genomic rearrangements are responsible for the increase in LD. LD decreases with the higher rates of mutation, recombination, gene conversion and recurrent mutations [Citation177].
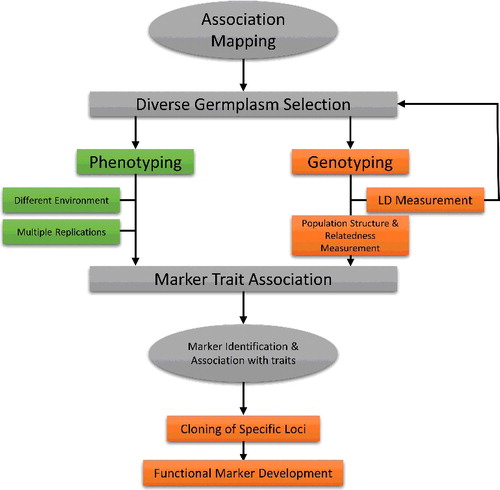
General methodology of association mapping
AM involves the selection of individuals from a natural population having a wide range of genetic diversity. Complete and precise phenotyping is performed for various traits of interest preferably in different locations and environments for many years. After genotyping with favourable markers, the structure of populations and their kinship are determined. Different statistics like D, D' or r2 are performed for the quantification of LD [Citation181]. Finally, the phenotyping and genotyping data are associated by using some statistical software programmes. TASSEL is the most widely used software for AM [Citation180]. The methodology of AM is shown in .
Figure 2. Methodology of association mapping.
Types of association mapping
Generally, AM is divided into two categories: (i) candidate-gene-based AM and (ii) genome-wide association study.
Candidate-gene-based association mapping
It is a very useful technique where scientists study the correlation present between a trait of interest and the DNA polymorphism present in a gene. Candidate genes are generally genes having direct or indirect effect on the trait of interest with known biological functions [Citation181,Citation182]. Biologically relevant candidates are selected with their trait dissection and they are ordered according to their evolutionary data obtained from their physiological, chemical and genetic studies [Citation183]. This technique needs the detection of SNPs present between lines and within specific genes. The simplest method to investigate the candidate gene depends on the re-sequencing of amplicons. The exon, promoter and introns with 5'/3' untranslated regions are accountable factors in the investigation of candidate gene SNPs. The amount of SNPs per unit length requires for the detection of significant association which can be described by the pace of LD decay for a specific candidate gene locus [Citation184]. The candidate-gene technique has been successfully used for the characterization and cloning of QTLs in the last many years. This technique has been successfully used for the development of many tightly linked genes into functional markers (FMs) [Citation185].
Genome-wide association study (GWAS)
Recent advancements in the field of sequencing and genotyping have made possible the GWAS in various species. This is a powerful technique mainly used to study the genetics of natural variations and traits of interest. Now several organizations have developed GWAS platforms commercially. Normally, inbred lines are used for GWAS and, after the genotyping of these lines, multiple times of phenotyping are performed [Citation186]. For the detection of QTLs, a large size of population (up to tens of thousands of individuals) is used to obtain high resolution. Millions of SNPs are produced through GWAS and the SNP number also increases, as more and more advancement in technology is coming [Citation187]. This technique facilitates greater resolution, ability to investigate the haplotype blocks small in size which are significantly correlated with quantitative trait variations [Citation188] and is a very cost-effective method with high throughput [Citation186]. GWAS has been performed in nearly all economically important crops, like maize, sorghum, millet and rice [Citation189].
Nested association mapping (NAM)
This technique was first proposed by Yu et al. [Citation190]. In nested association mapping (NAM), various designed mapping families are connected with each other. NAM is a technique that combines the effectiveness of both association and linkage mapping and has been applied successfully in the determination of FMs in various plants. Some important steps in NAM include the phenotyping for various traits of interest, followed by complete sequencing/genotyping of diverse founders/parents or dense genotyping. Then different markers are applied on both parents and progenies for genotyping in order to investigate the transfer of high-density maker information from parents to progenies. Finally, genome-wide analysis is performed for the association of phenotypic data with genotypic data [Citation190]. This technique can be used effectively in the identification of FMs [Citation191].
Multi-parent advanced generation inter-cross (MAGIC)
This technique provides higher rate of recombination and enhanced mapping resolution as compared to bi-parental mapping by interrogating several alleles. The main idea behind the development of the MAGIC populations is to enhance the intercrossing level and to increase the genome shuffling [Citation192]. Advanced inter-crossed lines are used as populations for MAGIC and are developed through performing random and subsequent inter-crosses in a population, which is developed when two inbred lines are crossed [Citation193]. MAGIC populations are very beneficial in different breeding programmes and can be used as permanent mapping populations in the determination of more accurate QTLs as well as directly or indirectly in the development of a variety [Citation194].
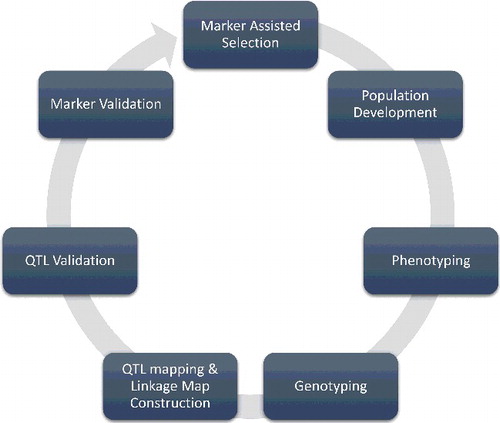
Marker-assisted selection (MAS)
MAS is a technique in which phenotypic selection is made on the basis of the genotype of a marker [Citation4]. MAS is a molecular breeding technique that helps to avoid the difficulties concerned with conventional plant breeding. It has totally changed the standard of selection [Citation144,Citation182]. Plant breeders mostly use MAS for the identification of suitable dominant or recessive alleles across a generation and for the identification of the most favourable individuals across the segregating progeny [Citation195]. Some important steps involved in MAS are described in .
Figure 3. Some important steps involves in MAS.
Important MAS schemes
Important schemes used for MAS are:
| (1) | marker-assisted backcrossing; | ||||
| (2) | gene pyramiding; | ||||
| (3) | marker-assisted recurrent selection; | ||||
| (4) | genomic selection. | ||||
Marker-assisted backcrossing (MABC)
Backcrossing is a very old technique and its efficiency was improved when molecular markers were introduced. MABC is a backcrossing technique in which molecular markers are used [Citation196]. MABC involves three levels. The first level is known as ‘foreground selection’ and markers are utilized in combination with or to substitute screening for the gene or QTL [Citation197]. The second level is known as ‘recombinant selection’. At this level, backcross progeny having target genes or QTL is selected and recombination is performed between linked flanking markers and the target locus. By recombinant selection, the size of the donor chromosome segment is reduced [Citation198]. The third level of MABC is known as ‘background selection’. At this level, backcross progeny having a large amount of recurrent parent genome is selected using markers which are unlinked with the target locus [Citation199].
Marker-assisted recurrent selection (MARS)
This is very handful technique in which molecular markers are applied at each generation in order to target all traits of interest; it was proposed in the 1990s [Citation200]. In this technique, crossing is performed in selected individuals at every crossing and selection cycle. MARS is specially involved with the improvement of F2 population that is achieved through one cycle of MAS (having phenotypic data with marker scores) followed by performing 2–3 cycles of marker-based selections (having marker scores only). It is a simple technique which can be applied easily without requiring any prior knowledge of QTLs, and the selection totally depends on the associations established between the marker and trait during the MARS programme [Citation201].
Marker-assisted gene pyramiding
This is a technique in which multiple QTLs/genes for a single or multiple traits are transferred into a cultivar which is deficient for these traits. This technique is mainly applied to increase the level of resistance to particular diseases and insects through the selection of two or more genes simultaneously [Citation202]. MAS has been successfully applied to pyramid many desired genes in various crops [Citation203,Citation204].
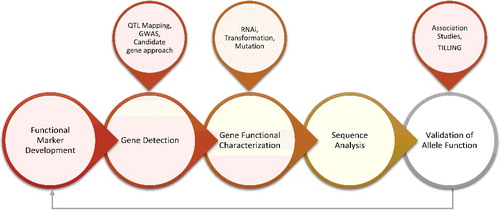
Functional/diagnostic markers (FMs)
FMs are also known as the perfect markers or diagnostic markers. Diagnostic/functional molecular markers provide a unique opportunity to screen large collections of germplasm for allelic diversity in short time with high accuracy and for traits having FMs. FMs are developed from polymorphic regions present within the genome that cause variation in phenotypic traits [Citation133,Citation147,Citation205,Citation206]. Some important advantages of FMs are that any population can be studied by FMs [Citation168] and they are directly linked with the allele of locus of interest. As FMs are directly linked with the genes of interest and recombination between gene and marker is absent, false selection and loss of information in marker-assisted breeding are avoided [Citation205]. FMs have ability to fix the alleles in a population more efficiently and selection is more balanced and controlled. FMs can be used for the construction of linked FM haplotypes and also for the validation of cultivars identity [Citation169]. The most important steps involved in the development of FMs are described in .
Figure 4. Important steps involves in the development of functional markers.
FMs in plant breeding
Mainly FMs have been successfully applied for the breeding of agronomic traits, quality traits and disease resistance in crop plants. Many FMs are available for different agronomic traits that provide an opportunity for plant breeders to select rare recombinants without wasting time and resources in the screening of large numbers of plants [Citation207]. In wheat, 30 genes have been cloned and more than 97 FMs have been developed for various traits of interest, like disease resistance genes and processing quality, and these FMs are successfully being used for wheat breeding [Citation208]. Rht-B1 and Rht-D1 are FMs developed for the discrimination of semi-dwarf alleles and Rht-B1a and Rht-D1 for wild-type alleles [Citation209]. Similarly, Phd-H1 (photoperiod response gene) and Vrn-A1, Vrn-B1, Vrn-D1 and Vrn-B3 (vernalization genes) have been screened as candidate genes in various Turkish bread wheat cultivars and landraces [Citation208–210]. A lot of candidate genes have been developed into FMs in various crops.
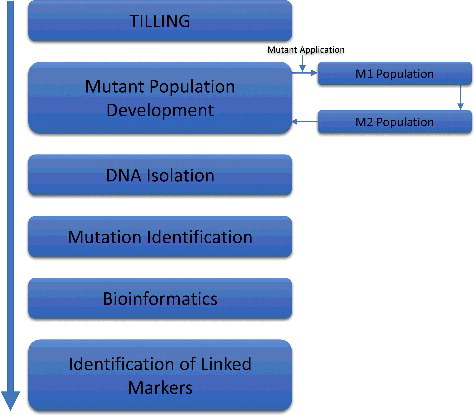
Targeting induced local lesions in genome (TILLING)
Targeting induced local lesions in genome (TILLING) was first developed by McCallum in the late 1990s while working on characterizing the function of two genes in Arabidopsis plants. It is a non-transgenic technique in reverse genetics and is satisfactorily applicable in most plants [Citation211]. The first important step involved in TILLING is the development of a mutated population using a standard mutagen like ethyl methanesulfonate (EMS) [Citation212]. Then identification of mutations in the targeted sequence is achieved by using various methods like high-performance liquid chromatography, mass spectrometry, array-based technologies and enzymatic mismatch cleavage [Citation213]. After this, some bioinformatics tools like PARSESNP (Project Aligned Related Sequences and Evaluate SNPs) are applied for the analysis of these mutants. This technique is applicable for any species and is not affected by genome size and ploidy levels. A greater rate of point mutations can be achieved through this technique. High-throughput TILLING is time saving and provides precise identification of new alleles at a less cost [Citation212]. The key steps involved in TILLING are described in .
Figure 5. Important steps involved in TILLING.
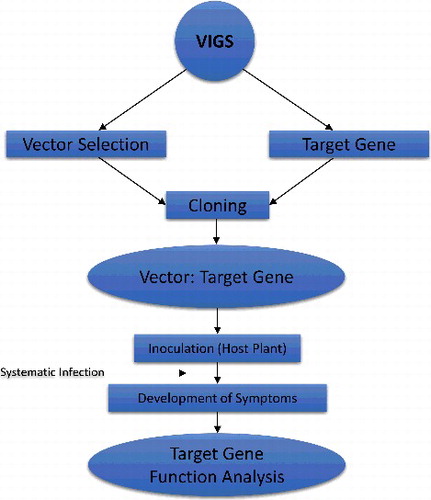
Virus-induced gene silencing (VIGS)
Virus-induced gene silencing (VIGS) is a viral vector methodology that exploits an RNA-mediated defence mechanism. When a virus infects a plant cell, it also activates the RNA-based defence system against this virus. This infection leads to viral RNA replication which results in the production of a dsRNA replication intermediate. This dsRNA replication intermediate results in the production of siRNA in the infected cell. After this, the siRNAs base pairs guide the RNase complex in such a way that it specifically targets the single-stranded (ss) target RNA which is alike to the dsRNAs [Citation214]. VIGS is a virus vector technique which utilizes this defence system. Replication in the dsRNA intermediate would be processed in a way that siRNA present in the damaged cells would correspond to parts of the viral vector genome and also including any non-viral insert. Thus, when insertion is made in the host cell, the RNase complex is targeted by siRNA to the corresponding host mRNA and symptoms reveal the loss of function of the encoded protein in the infected plant [Citation215]. In recent years, VIGS has been applied successfully in plant reverse genomics. It is a very simple, cost-effective and high-throughput method. Mainly, it is used in the identification of function loss of a gene of interest [Citation214,Citation216]. The general methodology of VIGS is shown in .
Figure 6. General methodology of VIGS.
Recent advancements in multiplexed functional/linked markers
With the passage of time, advancements are coming consistently in markers technology. SNP markers have become the marker of choice after the development of NGS and have been applied in the genotyping of various crops. A large number of linked markers have been converted into FMs and successfully used in MAS programmes in different crops. However, most of these markers are present in uniplex form. In order to achieve more effective and precise results from MAS, uniplex assays are shifting to multiplex systems [Citation146]. KASP (Kompetitive Allele Specific PCR) is a recent multiplexed technique used to convert uniplex to multiplex systems by combing several markers in a single assay.
KASP™ was first developed by KBioscience, or LGC Genomics [Citation217], in order to achieve in-house genotyping and was finally developed into a worldwide leading genotyping technology. It is a homogenous technology and its genotyping is based on fluorescence. This technique depends on allele-specific oligo extension and for the generation of signals, fluorescence resonance energy transfer is used. Plates with 96, 384 and 1536 wells can be used for genotyping by KASP. The success in assay designing in KASP is 98%–100% with 93%–94% successful conversions into a working assay. KASP is time saving and with low cost as compared to the GoldenGate® assay [Citation218]. The KASP assay has been applied successfully mainly in wheat, maize, rice and in a few other crops. The KASP assay has been successfully applied with NGS to develop multiplexed trait lined markers in wheat [Citation219]. Recently, 70 KASP assays have been developed and successfully validated in wheat and are significantly associated with various traits of interest in wheat crops [Citation219].
Genomic selection (GS): a step forward from MAS
Genomic selection (GS) is an advanced form of marker-assisted selection and was first developed by Meuwissen et al. [Citation220]. It is a technique that has the ability to predict the genetic values of selected candidates depending on the genome-estimated breeding values (GEBVs) predicted from high density of markers that are distributed throughout the genome. GEBV is a prediction model that combines the phenotypic data with marker and pedigree data in order to increase the accuracy of prediction. As compared to MAS, GEBV is dependent on all markers including major and minor marker effects [Citation221]. In this technique, genetic markers having the ability to cover the whole genome are selected and utilized in a way that all QTLs are in LD with at least a single marker [Citation222]. Genomic selection of complex traits and high-throughput phenotyping have brought a revolution in breeding by enhancing the accuracy level of selection [Citation223]. Important steps in GS are:
| (1) | Development of a training population using diverse germplasm; | ||||
| (2) | Phenotyping and genotyping of the training population; | ||||
| (3) | Selection of individuals having superior GEBVs on the basis of their genotypic data; | ||||
| (4) | Progeny of the genotypes which are used as study material in the testing population are taken as input for the GS model and give GEBVs; | ||||
| (5) | Individuals with maximum GEBVs are again selected; | ||||
| (6) | Selected individuals are used as parents of the next offspring for continuous selection and breeding [Citation220,Citation224]. The general methodology of GS is described in . | ||||
Figure 7. General methodology of genomic selection (GS).
High-throughput phenotyping
With the rapid increase in the world population, the demand for food is also increasing and there is a need to develop high-yielding varieties with more resistance to biotic and abiotic stress. There is a need to precisely correlate genotype with phenotype [Citation225]. For precise phenotyping, high-throughput phenotyping platform (HTPP) was introduced. HTPP is successful in the precise acquiring of comprehensive measurement of plant attributes which provide accurate information about the traits of interest [Citation226]. Advanced cameras, sensors, robotics and computers are used to collect precise data [Citation227]. Similarly, development is also coming in the field of HTPP, making it possible to obtain precise data for various complex traits [Citation228].
Genomic selection and genome editing together: new way in crop improvement
With the advancements in the field of genetic engineering, many techniques have been evolved to modify a single locus of a target organism. This dream comes true with the development of CRISPR (clustered regularly interspaced short palindromic repeat), a gene-editing technology. Genome editing has revolutionized plant breeding and has been applied successfully in different economically important crops. This technique facilitates the direct improvement of less favourable alleles into more favourable alleles. For the production of improved crop varieties, it is necessary to utilize genome selection and genome editing collectively. Genome editing shortens the time when backcrossing is done between elite varieties and exotic germplasm. This exotic germplasm serves as the encyclopaedia for the ancient alleles that are referenced for the development of modern varieties having resistance against biotic and abiotic stress. For the recombination of alleles that are already adapted, GS is then applied [Citation229].
Genome editing (CRISPR)
CRISPR is a genome-editing technique applied successfully in various plants [Citation230]. Cas9 is a recent advancement in the genome-editing technology and is becoming the technique of choice due to its many advantages, like its being easy to use, genome-editing versatility and ability to cleave methylated loci [Citation231,Citation232]. CRISPR RNAs and Cas protein are the two most important parts in the CRISPR technique. CRISPR RNA (crRNA) and trans-encoded CRISPR RNA (tracrRNA) are two short RNAs that can cleave a particular target site with the help of Cas9 endonuclease (the most explored Cas protein). sgRNA, known as single guide RNA, results when crRNA and tracrRNA are fused artificially [Citation233]. When sgRNA is combined with Cas protein, this leads to the formation of RNA-guided endonuclease that mediates the cleavage at a particular sequence in the genome [Citation234]. On the basis of this Cas protein, the CRISPR–Cas system is grouped into three types; I, II and III. Cas1 and Cas2 are two different proteins which are commonly present in all three types. Type I is present in both archaea and bacteria, while type II is only present in bacteria; however, type III is most commonly present in archaea but also in some bacteria [Citation235]. Genome editing has been performed successfully in model plants like Nicotiana tabacum [Citation236], Arabidopsis [Citation237] and some economically important crops like maize [Citation238] and wheat [Citation239].
Mechanism
Acquisition, expression and interference are the three steps which are used by the CRISPR-Cas system to identify and target the pathogen genetic material. Identification and consolidation of foreign DNA is performed within the CASPR locus as a spacer during acquisition. During the acquisition of DNA fragments, a Protospacer having a short stretch (2–5) of conserved nucleotides (PAMs) is used as the identification motif. The AT (adenine–thymine) leader side of the CRISPR array, a 30-bp single copy of spacer is inserted and duplicated [Citation240]. During the expression step, a long pre-crRNA is transcribed from the CRISPR locus, while tracrRNA and Cas proteins (Cas1, Cas2, Cas9 and Cas4/Casn2) are applied for its processing into crRNAs [Citation241]. The Cas protein complex is guided towards the particular target area of foreign DNA by crRNA for cleavage during the interference step, thus facilitating the immunity against the attack of pathogens [Citation240,Citation242].
Reasons for the underutilization of molecular markers in crop plants
DNA markers were developed in the 1980s and after the development of the first PCR-based markers in the 1990s, a large number of markers have been developed and have been applied for various aspects [Citation243–246]. However, wise utilization of these markers has begun over the previous few years [Citation198]. After the development and advancement in the marker technology, huge numbers of research papers are being published annually. However, a large proportion of these papers fail to exert their effect on practical level breeding [Citation243]. Similarly, QTL mapping results in the generation of large numbers of publications providing information about newly identified QTLs. These QTLs have been developed during research programmes and there is a need to apply these linked markers after careful validation and to develop functional diagnostic markers that could lead to successful breeding programmes benefiting the farmer fields [Citation198].
Conclusions
The last 30 years have witnessed a continuous development in the molecular markers technology from RFLP to SNPs and a diversity of array-technology-based markers. Advancements in the sequencing technologies have led to the development of NGS platforms that are low cost with high throughput. In spite of the presence of these highly advanced molecular genetic techniques, we are still not achieving our goals. The main reason behind this lies in inaccurate phenotyping. High-throughput phenotyping techniques solve these problems by using light, cameras, sensors, computers and highly modified devices for the collection of very precise phenotypic data, which is a core requirement to achieving our breeding goals successfully. CRISPR technology has revolutionized the plant breeding and genetics and researchers are focusing on editing the genomes of all economically important plants. The coming years are likely to see continued innovations in molecular marker technology to make it more precise, productive and cost effective in order to investigate the underlying biology of various traits of interest.
Acknowledgement
Authors are very grateful to TUBİTAK (The Scientific and Technological Research Council of Turkey) for providing the doctoral fellowship to Muhammad Azhar Nadeem through project (Project Number: 215O630) and Abant izzet baysal university, Scientific Research Unit (Project number: 2015.10.07.872).
Disclosure statement
The authors report no conflicts of interest.
References
- Cole CT. Genetic variation in rare and common plants. Annu Rev Ecol Evol Syst. 2003;34: 213–227.
- Hamrick JL. Isozymes and the analysis of genetic structure in plant populations. In: Soltis DE, Soltis PS, Dudley TR, editors. Isozymes in plant biology. Dordrecht: Springer; 1989. p. 87–105.
- Kebriyaee D, Kordrostami M, Rezadoost MH, et al. QTL analysis of agronomic traits in rice using SSR and AFLP markers. Not Sci Biol. 2012;4(2):116–123.
- Collard BC, Jahufer MZ, Brouwer JB, et al. An introduction to markers, quantitative trait loci (QTL) mapping and marker-assisted selection for crop improvement: the basic concepts. Euphytica. 2005;142(1–2):169–196.
- Jiang GL. Molecular markers and marker-assisted breeding in plants. In: Andersen SB, editor. Plant breeding from laboratories to fields. Rijeka: InTech; 2013. p. 45–83.
- Eagles HA, Bariana HS, Ogbonnaya FC, et al. Implementation of markers in Australian wheat breeding. Crop Pasture Sci. 2001;52(12):1349–1356.
- Karaköy T, Baloch FS, Toklu F, et al. Variation for selected morphological and quality-related traits among 178 faba bean landraces collected from Turkey. Plant Genet Resour. 2014;12(01):5–13.
- Bayley DC. Isozymic variation and plant breeders' rights. In: Tanksley SD, Orton TJ, editors. Isozymes in plant genetics and breeding. Amsterdam: Elsevier; 1983. p. 425–440.
- Mateu-Andres I, De Paco L. Allozymic differentiation of the Antirrhinum majus and A. siculum species groups. Ann Bot. 2005;95(3):465–473.
- Mondini L, Noorani A, Pagnotta MA. Assessing plant genetic diversity by molecular tools. Diversity. 2009;1(1):19–35.
- Semagn K, Bjørnstad Å, Ndjiondjop MN. An overview of molecular marker methods for plants. Afr J Biotechnol. 2006;(2540):25–68.
- Madhumati B. Potential and application of molecular markers techniques for plant genome analysis. Int J Pure App Biosci. 2014;2(1):169–88.
- Mullis K, Faloona F, Scharf S, et al. Specific enzymatic amplification of DNA in vitro: the polymerase chain reaction. Cold Spring Harb Symp Quant Biol. 1986;51:263–273.
- Joshi M, Deshpande JD. Polymerase chain reaction: methods, principles and application. Int J Biomed Res. 2011;2(1):81–97.
- He Q, Marjamäki M, Soini H, et al. Primers are decisive for sensitivity of PCR. Biotechniques. 1994;17(1):82–84.
- Dieffenbach CW, Lowe TM, Dveksler GS. General concepts for PCR primer design. PCR Methods Appl. 1993;3(3):30–37.
- Williams JG, Kubelik AR, Livak KJ, et al. DNA polymorphisms amplified by arbitrary primers are useful as genetic markers. Nucleic Acids Res. 1990;18(22):6531–6535.
- Welsh J, McClelland M. Fingerprinting genomes using PCR with arbitrary primers. Nucleic Acids Res. 1990;18(24):7213–7218.
- Jones CJ, Edwards KJ, Castaglione S, et al. Reproducibility testing of RAPD, AFLP and SSR markers in plants by a network of European laboratories. Mol Breed. 1997;3(5):381–390.
- Wolff K, Schoen ED, Peters-Van Rijn J. Optimizing the generation of random amplified polymorphic DNAs in chrysanthemum. Theor Appl Genet. 1993;86(8):1033–1037.
- Vos P, Hogers R, Bleeker M, et al. AFLP: a new technique for DNA fingerprinting. Nucleic Acids Res. 1995;23(21):4407–4414.
- Lynch M, Walsh B. Genetics and analysis of quantitative traits. Sunderland (MA): Sinauer; 1998.
- Ridout CJ, Donini P. Use of AFLP in cereals research. Trends Plant Sci. 1999;4(2):76–79.
- Blears MJ, De Grandis SA, Lee H, et al. Amplified fragment length polymorphism (AFLP): a review of the procedure and its applications. J Ind Microbiol Biotechnol. 1998;21(3):99–114.
- Litt M, Luty JA. A hypervariable microsatellite revealed by in vitro amplification of a dinucleotide repeat within the cardiac muscle actin gene. Am J Hum Genet. 1989;44(3):397–401.
- Tautz D. Hypervariability of simple sequences as a general source for polymorphic DNA markers. Nucleic Acids Res. 1989;17(16):6463–6471.
- Schlotteröer C, Amos B, Tautz D. Conservation of polymorphic simple sequence loci in cetacean species. Nature. 1991;354(6348):63–65.
- Beckmann JS, Weber JL. Survey of human and rat microsatellites. Genomics. 1992;12(4):627–631.
- Weber JL. Informativeness of human (dC-dA) n·(dG-dT) n polymorphisms. Genomics. 1990;7(4):524–530.
- Provan J, Powell W, Hollingsworth PM. Chloroplast microsatellites: new tools for studies in plant ecology and evolution. Trends Ecol Evol. 2001;16(3):142–147.
- Rajendrakumar P, Biswal AK, Balachandran SM, et al. Simple sequence repeats in organellar genomes of rice: frequency and distribution in genic and intergenic regions. Bioinformatics. 2007;23(1):1–4.
- Morgante M, Hanafey M, Powell W. Microsatellites are preferentially associated with nonrepetitive DNA in plant genomes. Nat Genet. 2002;30(2):194–200.
- Zane L, Bargelloni L, Patarnello T. Strategies for microsatellite isolation: a review. Mol Ecol. 2002;11(1):1–16.
- Kalia RK, Rai MK, Kalia S, et al. Microsatellite markers: an overview of the recent progress in plants. Euphytica. 2011;177(3):309–334.
- Röder MS, Korzun V, Wendehake K, et al. A microsatellite map of wheat. Genetics. 1998;149(4):2007–2023.
- Navascues M, Emerson BC. Chloroplast microsatellites: measures of genetic diversity and the effect of homoplasy. Mol Ecol. 2005;14(5):1333–1341.
- Ebert D, Peakall RO. Chloroplast simple sequence repeats (cpSSRs): technical resources and recommendations for expanding cpSSR discovery and applications to a wide array of plant species. Mol Ecol Resour. 2009;9(3):673–690.
- Liu Y, Xue JY, Wang B, et al. The mitochondrial genomes of the early land plants Treubia lacunosa and Anomodon rugelii: dynamic and conservative evolution. PLoS One. 2011;6(10):e25836.
- Zhang DX, Hewitt GM. Nuclear DNA analyses in genetic studies of populations: practice, problems and prospects. Mol Ecol. 2003;12(3):563–584.
- Wu KS, Jones R, Danneberger L, Scolnik PA. Detection of microsatellite polymorphisms without cloning. Nucleic Acids Res. 1994;22(15):3257–3258.
- Salazar JA, Rasouli M, Moghaddam RF, et al. Low-cost strategies for development of molecular markers linked to agronomic traits in Prunus. Agric Sci. 2014;5(05):430–439.
- Li G, Quiros CF. Sequence-related amplified polymorphism (SRAP), a new marker system based on a simple PCR reaction: its application to mapping and gene tagging in Brassica. Theor Appl Genet. 2001;103(2–3):455–461.
- Uzun A, Yesiloglu T, Aka-Kacar Y, et al. Genetic diversity and relationships within citrus and related genera based on sequence related amplified polymorphism markers (SRAPs). Sci Hort. 2009;121(3):306–312.
- Zietkiewicz E, Rafalski A, Labuda D. Genome fingerprinting by simple sequence repeat (SSR)-anchored polymerase chain reaction amplification. Genomics. 1994;20(2):176–183.
- Gupta M, Chyi YS, Romero-Severson J, et al. Amplification of DNA markers from evolutionarily diverse genomes using single primers of simple-sequence repeats. Theor Appl Genet. 1994;89(7–8):998–1006.
- Fang DQ, Roose ML. Identification of closely related citrus cultivars with inter-simple sequence repeat markers. Theor Appl Genet. 1997;95(3):408–417.
- Moreno S, Martín JP, Ortiz JM. Inter-simple sequence repeats PCR for characterization of closely related grapevine germplasm. Euphytica. 1998;101(1):117–25.
- Tsumura Y, Ohba K, Strauss SH. Diversity and inheritance of inter-simple sequence repeat polymorphisms in Douglas-fir (Pseudotsuga menziesii) and sugi (Cryptomeria japonica). Theor Appl Genet. 1996;92(1):40–45.
- Ng WL, Tan SG. Inter-simple sequence repeat (ISSR) markers: are we doing it right? ASM Sci J. 2015;9:30–39.
- Chatterjee SN, Vijayan K, Roy GC, et al. ISSR profiling of genetic variability in the ecotypes of Antheraea mylitta Drury, the tropical tasar silkworm. Russ J Genet. 2004; 40(2):152–159.
- Kar PK, Vijayan K, Mohandas TP, et al. Genetic variability and genetic structure of wild and semi-domestic populations of tasar silkworm (Antheraea mylitta) ecorace Daba as revealed through ISSR markers. Genetica. 2005;125(2–3):173–183.
- Finnegan DJ. Eukaryotic transposable elements and genome evolution. Trends Genet. 1989; 5:103–107.
- Grzebelus D. Transposon insertion polymorphism as a new source of molecular markers. J Fruit Ornam Plant Res. 2006;14(Suppl 1):21–29.
- Kumar A, Bennetzen JL. Plant retrotransposons. Annu Rev Genet. 1999;33(1):479–532.
- Kalendar R, Vicient CM, Peleg O, et al. Large retrotransposon derivatives: abundant, conserved but nonautonomous retroelements of barley and related genomes. Genetics. 2004;166(3):1437–1450.
- Shirasu K, Schulman AH, Lahaye T, et al. A contiguous 66-kb barley DNA sequence provides evidence for reversible genome expansion. Genome Res. 2000;10(7):908–915.
- Pearce SR, Pich U, Harrison G, et al. TheTy1-copia group retrotransposons of Allium cepa are distributed throughout the chromosomes but are enriched in the terminal heterochromatin. Chromosome Res. 1996;4(5):357–364.
- Voytas DF, Boeke JD. Ty1 and Ty5 of Saccharomyces cerevisiae. In: Craigie R, Gellert M, Lambowitz A editors. Mobile DNA II American Society of Microbiology. Washington (DC): ASM Press; 2002. p. 631–662.
- Roy NS, Choi JY, Lee SI, et al. Marker utility of transposable elements for plant genetics, breeding, and ecology: a review. Genes Genom. 2015;37(2):141–151.
- Schulman AH, Wicker T. A field guide to transposable elements. In: Fedoroff NV, editor. Vol. 2, Plant transposons and genome dynamics in evolution. Oxford, Wiley-Blackwell; 2013. p. 15–40.
- Kalendar R, Flavell AJ, Ellis TH, et al. Analysis of plant diversity with retrotransposon-based molecular markers. Heredity. 2011;106(4):520–530.
- Kalendar R, Grob T, Regina M, et al. IRAP and REMAP: two new retrotransposon-based DNA fingerprinting techniques. Theor Appl Genet. 1999;98(5):704–711.
- Poczai P, Varga I, Laos M, et al. Advances in plant gene-targeted and functional markers: a review. Plant Methods. 2013;9(1):6.
- Kalendar R, Schulman AH. IRAP and REMAP for retrotransposon-based genotyping and fingerprinting. Nat Protoc. 2006;1(5):2478–2484.
- Fan F, Cui B, Zhang T, et al. LTR-retrotransposon activation, IRAP marker development and its potential in genetic diversity assessment of masson pine (Pinus massoniana). Tree Genet Genomes. 2014;10(1):213–222.
- Flavell AJ, Knox MR, Pearce SR, et al. Retrotransposon-based insertion polymorphisms (RBIP) for high throughput marker analysis. Plant J. 1998;16(5):643–650.
- Agarwal M, Shrivastava N, Padh H. Advances in molecular marker techniques and their applications in plant sciences. Plant Cell Rep. 2008;27(4):617–631.
- Jing R, Bolshakov V, Flavell AJ. The tagged microarray marker (TAM) method for high-throughput detection of single nucleotide and indel polymorphisms. Nat Protoc. 2007;2(1):168–177.
- Kalendar R, Antonius K, Smýkal P, et al. iPBS: a universal method for DNA fingerprinting and retrotransposon isolation. Theor Appl Genet. 2010;121(8):1419–1430.
- Baloch FS, Alsaleh A, de Miera LE, et al. DNA based iPBS-retrotransposon markers for investigating the population structure of pea (Pisum sativum) germplasm from Turkey. Biochem Syst Ecol. 2015;61:244–252.
- Maeda M, Uryu N, Murayama N, et al. A simple and rapid method for HLA-DP genotyping by digestion of PCR-amplified DNA with allele-specific restriction endonucleases. Hum Immunol. 1990;27(2):111–121.
- Jarvis P, Lister C, Szabo V, et al. Integration of CAPS markers into the RFLP map generated using recombinant inbred lines of Arabidopsis thaliana. Plant Mol Biol. 1994;24(4):685–687.
- Michaels SD, Amasino RM. A robust method for detecting single-nucleotide changes as polymorphic markers by PCR. Plant J. 1998;14(3):381–385.
- Spaniolas S, May ST, Bennett MJ, et al. Authentication of coffee by means of PCR-RFLP analysis and lab-on-a-chip capillary electrophoresis. J Agric Food Chem. 2006;54(20):7466–7470.
- Weiland JJ, Yu MH. A cleaved amplified polymorphic sequence (CAPS) marker associated with root-knot nematode resistance in sugarbeet. Crop Sci. 2003;43(5):1814–188.
- Paran I, Michelmore RW. Development of reliable PCR-based markers linked to downy mildew resistance genes in lettuce. Theor Appl Genet. 1993;85(8):985–993.
- Yang L, Fu S, Khan A, et al. Molecular cloning and development of RAPD-SCAR markers for Dimocarpus longan variety authentication. Springer Plus. 2013;2:501.
- Bhagyawant SS. RAPD-SCAR markers: an interface tool for authentication of traits. J Biosci Med. 2016;4:1–9.
- Kiran U, Khan S, Mirza KJ, et al. SCAR markers: a potential tool for authentication of herbal drugs. Fitoterapia. 2010;81(8):969–976.
- Franca LT, Carrilho E, Kist TB. A review of DNA sequencing techniques. Q Rev Biophys. 2002;35(2):169–200.
- Davey JW, Hohenlohe PA, Etter PD, et al. Genome-wide genetic marker discovery and genotyping using next-generation sequencing. Nat Rev Genet. 2011;12(7):499–510.
- Heather JM, Chain B. The sequence of sequencers: the history of sequencing DNA. Genomics. 2016;107(1):1–8.
- Sanger F, Coulson AR. A rapid method for determining sequences in DNA by primed synthesis with DNA polymerase. J Mol Biol. 1975;94(3):441–448.
- Englund PT. Analysis of nucleotide sequences at 3′termini of duplex deoxyribonucleic acid with the use of the T4 deoxyribonucleic acid polymerase. J Biol Chem. 1971;246(10):3269–3276.
- Englund PT. The 3′-terminal nucleotide sequences of T7 DNA. J Mol Biol. 1972;66(2):209–224.
- Sanger F, Nicklen S, Coulson AR. DNA sequencing with chain-terminating inhibitors. Proc Natl Acad Sci. 1977;74(12):5463–5467.
- Hyman ED. A new method of sequencing DNA. Anal Biochem. 1988;174(2):423–436.
- Ronaghi M. Pyrosequencing sheds light on DNA sequencing. Genome Res. 2001;11(1):3–11.
- Gharizadeh B, Herman ZS, Eason RG, et al. Large-scale Pyrosequencing of synthetic DNA: a comparison with results from Sanger dideoxy sequencing. Electrophoresis. 2006;27(15):3042–3047.
- Ronaghi M, Karamohamed S, Pettersson B, et al. Real-time DNA sequencing using detection of pyrophosphate release. Anal Biochem. 1996;242(1):84–89.
- Ronaghi M, Uhlén M, Nyren P. A sequencing method based on real-time pyrophosphate. Science. 1998;281(5375):363–365.
- Shendure J, Ji H. Next-generation DNA sequencing. Nat Biotechnol. 2008;26(10):1135–1145.
- Bentley DR, Balasubramanian S, Swerdlow HP, et al. Accurate whole human genome sequencing using reversible terminator chemistry. Nature. 2008;456(7218):53–59.
- Thudi M, Li Y, Jackson SA, et al. Current state-of-art of sequencing technologies for plant genomics research. Brief Funct Genomics. 2012;11(1):3–11.
- Rothberg JM, Hinz W, Rearick TM, et al. An integrated semiconductor device enabling non-optical genome sequencing. Nature. 2011;475(7356):348–352.
- Deschamps S, Llaca V, May GD. Genotyping-by-sequencing in plants. Biology. 2012;1(3):460–483.
- Metzker ML. Sequencing technologies—the next generation. Nat Rev Genet. 2010;11(1):31–46.
- Elshire RJ, Glaubitz JC, Sun Q, et al. A robust, simple genotyping-by-sequencing (GBS) approach for high diversity species. PloS one. 2011;6(5):e19379.
- Mardis ER. Next-generation DNA sequencing methods. Annu Rev Genomics Hum Genet. 2008;9:387–402.
- Poland JA, Rife TW. Genotyping-by-sequencing for plant breeding and genetics. Plant Genome. 2012;5(3):92–102.
- Beissinger TM, Hirsch CN, Sekhon RS, et al. Marker density and read depth for genotyping populations using genotyping-by-sequencing. Genetics. 2013;193(4):1073–1081.
- Xu Y. Molecular plant breeding. Wallingford: CABI; 2010.
- Sobrino B, Brión M, Carracedo A. SNPs in forensic genetics: a review on SNP typing methodologies. Forensic Sci Int. 2005;154(2):181–194.
- Jaccoud D, Peng K, Feinstein D, et al. Diversity arrays: a solid state technology for sequence information independent genotyping. Nucleic Acids Res. 2001;29(4):E25.
- Wenzl P, Carling J, Kudrna D, et al. Diversity Arrays Technology (DArT) for whole-genome profiling of barley. Proc Natl Acad Sci U S A. 2004;101(26):9915–9920.
- Huttner E, Wenzl P, Akbari M, et al. Diversity arrays technology: a novel tool for harnessing the genetic potential of orphan crops. In: Serageldin I, Persley GJ, editors. Discovery to delivery: BioVision Alexandria 2004; Proceedings of the 2004 Conference of the World Biological Forum; 2004 Apr 3–6; Alexandria, Egypt. Wallingford: CABI; 2005. p. 145–155.
- Slatkin M. Gene flow and the geographic structure of natural populations. Science. 1987;236:787–793.
- Wei C, Wang L, Yang Y, et al. Identification of an S5n allele in Oryza rufipogon Griff. and its effect on embryo sac fertility. Chinese Sci Bull. 2010;55(13):1255–1262.
- Tong J, Li Y, Yang Y, et al. Molecular evolution of rice S5n allele and functional comparison among different sequences. Chinese Sci Bull. 2011;56(19):2016–2024.
- Peng H, Shahid MQ, Li YH, et al. Molecular evolution of S5 locus and large differences in its coding region revealed insignificant effect on indica× japonica embryo sac fertility. Plant Syst Evol. 2015;301(2):639–655.
- Wang Y, Ghouri F, Shahid MQ, et al. The genetic diversity and population structure of wild soybean evaluated by chloroplast and nuclear gene sequences. Biochem Syst Ecol. 2017;71:170–178.
- Dong W, Liu J, Yu J, et al. Highly variable chloroplast markers for evaluating plant phylogeny at low taxonomic levels and for DNA barcoding. PLoS One. 2012;7(4):e35071.
- Wang Y, Shahid MQ, Baloch FS. Phylogeographical studies of Glycine soja: implicating the refugium during the quaternary glacial period and large-scale expansion after the last glacial maximum. Turk J Agric For. 2016;40(6):825–838.
- Comings DE, MacMurray JP. Molecular heterosis: a review. Mol Gen Metab. 2000;71(1):19–31.
- Martin JM, Talbert LE, Lanning SP, et al. Hybrid performance in wheat as related to parental diversity. Crop Sci. 1995;35(1):104–108.
- Betran FJ, Ribaut JM, Beck D, et al. Genetic diversity, specific combining ability, and heterosis in tropical maize under stress and nonstress environments. Crop Sci. 2003;43(3):797–806.
- Yu CY, Hu SW, Zhao HX, et al. Genetic distances revealed by morphological characters, isozymes, proteins and RAPD markers and their relationships with hybrid performance in oilseed rape (Brassica napus L.). Theor Appl Genet. 2005;110(3):511–518.
- Wu JW, Hu CY, Shahid MQ, et al. Analysis on genetic diversification and heterosis in autotetraploid rice. Springer Plus. 2013;2(1):439.
- Xie F, He Z, Esguerra MQ, et al. Determination of heterotic groups for tropical Indica hybrid rice germplasm. Theor Appl Genet. 2014;127(2):407–417.
- Guo H, Mendrikahy JN, Xie L, et al. Transcriptome analysis of neo-tetraploid rice reveals specific differential gene expressions associated with fertility and heterosis. Sci Rep. 2017;7:40139.
- Li X, Shahid MQ, Xia J, et al. Analysis of small RNAs revealed differential expressions during pollen and embryo sac development in autotetraploid rice. BMC Genomics. 2017;18(1):129.
- Kasha KJ, Maluszynski M. Production of doubled haploids in crop plants. An introduction. In: Maluszynski M, Kasha KJ, Forster BP, Szarejko I, editors. Doubled haploid production in crop plants. Dordrecht: Springer; 2003. p. 1–4.
- Khush GS, Virmani SS. Haploids in plant breeding. In: Jain SM, Sopory SK, Veilleux RE, editors. In vitro haploid production in higher plants. Current plant science and biotechnology in agriculture. Dordrecht: Springer; 1996. p. 11–33.
- Künzel G, Korzun L, Meister A. Cytologically integrated physical restriction fragment length polymorphism maps for the barley genome based on translocation breakpoints. Genetics. 2000;154(1):397–412.
- Belicuas PR, Guimarães CT, Paiva LV, et al. Androgenetic haploids and SSR markers as tools for the development of tropical maize hybrids. Euphytica. 2007;156(1–2):95–102.
- Melchinger AE, Winter M, Mi X, et al. Controlling misclassification rates in identification of haploid seeds from induction crosses in maize with high-oil inducers. Crop Sci. 2015;55(3):1076–1086.
- Tang F, Tao Y, Zhao T, et al. In vitro production of haploid and doubled haploid plants from pollinated ovaries of maize (Zea mays). Plant Cell Tissue Organ Cult. 2006;84(2):233–237.
- Shahid MQ, Chen FY, Li HY, et al. Double-neutral genes, and, for pollen fertility in rice to overcome× hybrid sterility. Crop Sci. 2013;53(1):164–176.
- Wu J, Shahid MQ, Chen L, et al. Polyploidy enhances F1 pollen sterility loci interactions that increase meiosis abnormalities and pollen sterility in autotetraploid rice. Plant Physiol. 2015;169(4):2700–2717.
- Nawaz MA, Baloch FS, Rehman HM, et al. Development of a competent and trouble free DNA isolation protocol for downstream genetic analysis in glycine species. Turk J Agri Food Sci Tech. 2016;4(8):700–705.
- Nawaz MA, Sadia B, Awan FS, et al. 2013. Genetic diversity in hyper glucose oxidase producing Aspergillus niger UAF mutants by using molecular markers. Int J Agric Biol. 2013;15(2):362–366.
- Nawaz MA, Yang SH, Rehman HM, et al. Genetic diversity and population structure of Korean wild soybean (Glycine soja Sieb. and Zucc.) inferred from microsatellite markers. Biochem Syst Ecol. 2017;71:87–96.
- Nawaz MA, Rehman HM, Baloch FS, et al. Genome and transcriptome-wide analysis of cellulose synthase gene superfamily in soybean. J Plant Physiol. 2017;215:163–175.
- Liu W, Shahid MQ, Bai L, et al. Evaluation of genetic diversity and development of a core collection of wild rice (Oryza rufipogon Griff.) populations in China. PloS One. 2015;10(12):e0145990.
- Wang Y, Shahid MQ, Ghouri F, et al. Evaluation of the geographical pattern of genetic diversity of glycine soja and glycine max based on four single copy nuclear gene loci: for conservation of soybean germplasm. Biochem Syst Ecol. 2015;62:229–235.
- Tiwari JK, Singh BP, Gopal J, et al. Molecular characterization of the Indian Andigena potato core collection using microsatellite markers. Afr J Biotechnol. 2013;12(10).1025–1033.
- Naeem M, Ghouri F, Shahid MQ, et al. Genetic diversity in mutated and non-mutated rice varieties. Genet Mol Res. 2015;14(4):17109–17123.
- Baloch FS, Alsaleh A, Shahid MQ, et al. A whole genome DArTseq and SNP analysis for genetic diversity assessment in durum wheat from Central Fertile Crescent. PloS One. 2017;12(1):e0167821.
- Simmonds NW. Introgression and incorporation. Strategies for the use of crop genetic resources. Biol Rev. 1993;68(4):539–562.
- Wang YH, Liu SJ, Ji SL, et al. Fine mapping and marker-assisted selection (MAS) of a low glutelin content gene in rice. Cell Res. 2005;15(8):622–630.
- You-Xin Y, Yan-Hong L, Jing-Fei T. Wide-compatibility gene exploited by functional molecular markers and its effect on fertility of intersubspecific rice hybrids. Crop Sci. 2012;52(2):669–675.
- Angaji SA. QTL mapping: a few key points. Int J Appl Res Nat Prod. 2009;2(2):1–3.
- Paterson AH. Making genetic maps. In: Paterson AH, editor. Genome mapping in plants. Austin (TX): R.G. Landes Company; 1996. p. 23–39.
- Mohan M, Nair S, Bhagwat A, et al. Genome mapping, molecular markers and marker-assisted selection in crop plants. Mol Breed. 1997;3(2):87–103.
- Dhingani RM, Umrania VV, Tomar RS, et al. Introduction to QTL mapping in plants. Ann Plant Sci. 2015;4(04):1072–1079.
- Bernardo A, Wang S, Amand PS, et al. Using next generation sequencing for multiplexed trait-linked markers in wheat. PloS One. 2015;10(12):e0143890.
- Risch N. Genetic linkage: interpreting LOD scores. Science. 1992;255(5046):803–805.
- Tanksley SD. Mapping polygenes. Annu Rev Genet. 1993;27(1):205–233.
- Lander ES, Botstein D. Mapping mendelian factors underlying quantitative traits using RFLP linkage maps. Genetics. 1989;121(1):185–199.
- Silva LD, Wang S, Zeng ZB. Composite interval mapping and multiple interval mapping: procedures and guidelines for using Windows QTL cartographer. Methods Mol Biol. 2012;871:75–119.
- Broman KW, Wu H, Sen Ś, et al. R/qtl: QTL mapping in experimental crosses. Bioinformatics. 2003;19(7):889–890.
- Yang J, Hu C, Hu H, et al. QTLNetwork: mapping and visualizing genetic architecture of complex traits in experimental populations. Bioinformatics. 2008;24(5):721–723.
- Utz HF, Melchinger AE. PLABQTL: a program for composite interval mapping of QTL. J Quant Trait Loci. 1996;2(1):1–5.
- Nelson JC. QGENE: software for marker-based genomic analysis and breeding. Mol Breed. 1997;3(3):239–245.
- Voorrips RE. MapChart: software for the graphical presentation of linkage maps and QTLs. J Hered. 2002;93(1):77–78.
- George ML, Prasanna BM, Rathore RS, et al. Identification of QTLs conferring resistance to downy mildews of maize in Asia. Theor Appl Genet. 2003;107(3):544–551.
- Haley CS, Andersson LE. Linkage mapping of quantitative trait loci in plants and animals. In: Dear PH, editor. Genome mapping: a practical approach. Oxford: IRL Press; 1997. p. 49–71.
- Hackett CA. Statistical methods for QTL mapping in cereals. Plant Mol Biol. 2002;48(5–6):585–599.
- Ogbonnaya FC, Subrahmanyam NC, Moullet O, et al. Diagnostic DNA markers for cereal cyst nematode resistance in bread wheat. Crop Pasture Sci. 2001;52(12):1367–1374.
- Lukowitz W, Gillmor CS, Scheible WR. Positional cloning in Arabidopsis. Why it feels good to have a genome initiative working for you. Plant Physiol. 2000;123(3):795–806.
- Salvi S, Tuberosa R. To clone or not to clone plant QTLs: present and future challenges. Trends Plant Sci. 2005;10(6):297–304.
- Gallavotti A, Whipple CJ. Positional cloning in maize (Zea mays subsp. mays, Poaceae). Appl Plant Sci. 2015;3(1):1400092.
- Ochman H, Gerber AS, Hartl DL. Genetic applications of an inverse polymerase chain reaction. Genetics. 1988;120(3):621–623.
- Arnold C, Hodgson IJ. Vectorette PCR: a novel approach to genomic walking. Genome Res. 1991;1(1):39–42.
- Rishi AS, Nelson ND, Goyal A. Genome walking of large fragments: an improved method. J Biotechnol. 2004;111(1):9–15.
- Young ND, Kumar L, Menancio-Hautea D, et al. RFLP mapping of a major bruchid resistance gene in mungbean (Vigna radiata, L. Wilczek). Theor Appl Genet. 1992;84(7-8):839–844.
- Price AH. Believe it or not, QTLs are accurate ! Trends Plant Sci. 2006;11(5):213–216.
- Neale DB, Savolainen O. Association genetics of complex traits in conifers. Trends Plant Sci. 2004;9(7):325–330.
- Lübberstedt T, Zein I, Andersen JR, et al. Development and application of functional markers in maize. Euphytica. 2005;146(1):101–108.
- Jannink JL, Walsh B. Association mapping in plant populations. In: Kang MS, editor. Quantitative genetics, genomics and plant breeding. Oxford: CAB International; 2002. p. 59–68.
- Zhang P, Zhong K, Shahid MQ, et al. Association analysis in rice: from application to utilization. Front Plant Sci. 2016;7:1202.
- Zhang P, Zhong K, Tong H, et al. Association mapping for aluminum tolerance in a core collection of rice landraces. Front Plant Sci. 2016:7:1415.
- Kraakman AT, Martinez F, Mussiraliev B, et al. Linkage disequilibrium mapping of morphological, resistance, and other agronomically relevant traits in modern spring barley cultivars. Mol Breed. 2006;17(1):41–58.
- Holland JB. Genetic architecture of complex traits in plants. Curr Opin Plant Biol. 2007;10(2):156–161.
- Gupta PK, Rustgi S, Kulwal PL. Linkage disequilibrium and association studies in higher plants: present status and future prospects. Plant Mol Biol. 2005;57(4):461–485.
- Goldstein DB, Weale ME. Population genomics: linkage disequilibrium holds the key. Curr Biol. 2001;11(14):576–579.
- Mackay I, Powell W. Methods for linkage disequilibrium mapping in crops. Trends Plant Sci. 2007;12(2):57–63.
- Abdurakhmonov IY, Abdukarimov A. Application of association mapping to understanding the genetic diversity of plant germplasm resources. Int J Plant Genomics. 2008;2008:574927.
- Abecasis GR, Cookson WO. Gold – graphical overview of linkage disequilibrium. Bioinformatics. 2000;16(2):182–183.
- Bradbury PJ, Zhang Z, Kroon DE, et al. TASSEL: software for association mapping of complex traits in diverse samples. Bioinformatics. 2007;23(19):2633–2635.
- Sehgal D, Singh R, Rajpal VR. Quantitative trait loci mapping in plants: concepts and approaches. In: Rajpal V, Rao S, Raina S, editors. Vol. 2, Molecular breeding for sustainable crop improvement. Cham: Springer International; 2016. p. 31–59. (Sustainable development and biodiversity; Vol. 11).
- Tabor HK, Risch NJ, Myers RM. Candidate-gene approaches for studying complex genetic traits: practical considerations. Nat Rev Genet. 2002;3(5):391–397.
- Mackay TF. The genetic architecture of quantitative traits. Annu Rev Genet. 2001;35(1):303–339.
- Whitt SR, Buckler ES. Using natural allelic diversity to evaluate gene function. Plant Func Genomics. 2003;236:123–139.
- Lau WC, Rafii MY, Ismail MR, et al. Review of functional markers for improving cooking, eating, and the nutritional qualities of rice. Front Plant Sci. 2015;6:832.
- Atwell S, Huang YS, Vilhjálmsson BJ, et al. Genome-wide association study of 107 phenotypes in Arabidopsis thaliana inbred lines. Nature. 2010;465(7298):627–631.
- Zargar SM, Raatz B, Sonah H, et al. Recent advances in molecular marker techniques: insight into QTL mapping, GWAS and genomic selection in plants. JCSB. 2015;18(5):293–308.
- Hindorff LA, Sethupathy P, Junkins HA, et al. Potential etiologic and functional implications of genome-wide association loci for human diseases and traits. Proc Natl Acad Sci. 2009;106(23):9362–9367.
- Jia P, Zhao Z. Network-assisted analysis to prioritize GWAS results: principles, methods and perspectives. Hum Genet. 2014;133(2):125–138.
- Yu J, Holland JB, McMullen MD, et al. Genetic design and statistical power of nested association mapping in maize. Genetics. 2008;178(1):539–551.
- McMullen MD, Kresovich S, Villeda HS, et al. Genetic properties of the maize nested association mapping population. Science. 2009;325(5941):737–740.
- Cavanagh C, Morell M, Mackay I, et al. From mutations to MAGIC: resources for gene discovery, validation and delivery in crop plants. Curr Opin Plant Biol. 2008;11(2):215–221.
- Darvasi A, Soller M. Advanced intercross lines, an experimental population for fine genetic mapping. Genetics. 1995;141(3):1199–1207.
- Bandillo N, Raghavan C, Muyco PA, et al. Multi-parent advanced generation inter-cross (MAGIC) populations in rice: progress and potential for genetics research and breeding. Rice. 2013;6(1):11.
- Francia E, Tacconi G, Crosatti C, et al. Marker assisted selection in crop plants. Plant Cell Tiss Org. 2005;82(3):317–342.
- Holland JB. Implementation of molecular markers for quantitative traits in breeding programs—challenges and opportunities. In: New directions for a diverse planet; Proceedings of the 4th International Crop Science Congress; 2004 Sep 26–Oct 1; Brisbane, Australia. Gosford: Regional Institute; 2004. Available from: www.cropscience.org.au/icsc2004
- Charcosset A. Marker-assisted introgression of quantitative trait loci. Genetics. 1997; 147(3):1469–1485.
- Hospital F. Selection in backcross programmes. Philos Trans Biol Sci. 2005:1503–1511.
- Collard BC, Mackill DJ. Marker-assisted selection: an approach for precision plant breeding in the twenty-first century. Philos Trans R Soc B. 2008;363(1491):557–572.
- Bernardo R, Charcosset A. Usefulness of gene information in marker-assisted recurrent selection: a simulation appraisal. Crop Sci. 2006;46(2):614–621.
- Eathington SR, Crosbie TM, Edwards MD, et al. Molecular markers in a commercial breeding program. Crop Sci. 2007;47(Suppl 3):S154–S163.
- Luo Y, Sangha JS, Wang S, et al. Marker-assisted breeding of Xa4, Xa21 and Xa27 in the restorer lines of hybrid rice for broad-spectrum and enhanced disease resistance to bacterial blight. Mol Breed. 2012;30(4):1601–1610.
- Gupta PK, Langridge P, Mir RR. Marker-assisted wheat breeding: present status and future possibilities. Mol Breed. 2010;26(2):145–161.
- Ye G, Smith KF. Marker-assisted gene pyramiding for inbred line development: basic principles and practical guidelines. Int J Plant Breed. 2008;2(1):1–10.
- Andersen JR, Lübberstedt T. Functional markers in plants. Trends Plant Sci. 2003;8(11):554–560.
- Xu Y, McCouch SR, Zhang Q. How can we use genomics to improve cereals with rice as a reference genome? Plant Mol Biol. 2005;59(1):7–26.
- Liu Y, He Z, Appels R, et al. Functional markers in wheat: current status and future prospects. Theor Appl Genet. 2012;125(1):1–10.
- Zhang X, Yang S, Zhou Y, et al. Distribution of the Rht-B1b, Rht-D1b and Rht8 reduced height genes in autumn-sown Chinese wheats detected by molecular markers. Euphytica. 2006;152(1):109–116.
- Andeden E, Yediay F, Baloch F, et al. Distribution of vernalization and photoperiod genes (Vrn-A1, Vrn-B1, Vrn-D1, Vrn-B3, Ppd-D1) in Turkish bread wheat cultivars and landraces. Cereal Res Commun. 2011;39(3):352–364.
- Shaaf S, Sharma R, Baloch FS, et al. The grain Hardness locus characterized in a diverse wheat panel (Triticum aestivum L.) adapted to the central part of the Fertile Crescent: genetic diversity, haplotype structure, and phylogeny. Mol Genet Genomics. 2015;291(3):1259–1275.
- Anuradha K, Agarwal S, Rao YV, et al. Mapping QTLs and candidate genes for iron and zinc concentrations in unpolished rice of Madhukar× Swarna RILs. Gene. 2012;508(2):233–240.
- McCallum CM, Comai L, Greene EA, et al. Targeting induced local lesions in genomes (TILLING) for plant functional genomics. Plant Physiol. 2000;123(2):439–442.
- Kurowska M, Daszkowska-Golec A, Gruszka D, et al. TILLING – a shortcut in functional genomics. J Appl Genet. 2011;52(4):371–390.
- Comai L, Henikoff S. TILLING: practical single-nucleotide mutation discovery. Plant J. 2006;45(4):684–694.
- Gupta B, Saha J, Sengupta A, et al. Recent advances on virus induced gene silencing (VIGS): plant functional genomics. J Plant Biochem Physiol. 2013:1:e116.
- Lu R, Malcuit I, Moffett P, et al. High throughput virus-induced gene silencing implicates heat shock protein 90 in plant disease resistance. Embo J. 2003;22(21):5690–5699.
- Braae A, Thompson CE, Morgan K. Comparison of custom designed KASP and TaqMan genotyping assays for a rare genetic variant identified through resequencing GWAS loci. Available from: www.lgcgroup.com
- Kumpatla SP, Abdurakhmonov IY, Mammadov JA, et al. Genomics-assisted plant breeding in the 21st century: technological advances and progress. Rijeka: InTech; 2012.
- Rasheed A, Wen W, Gao F, et al. Development and validation of KASP assays for genes underpinning key economic traits in bread wheat. Theor Appl Genet. 2016;129(10):1843–1860.
- Meuwissen TH, Hayes BJ, Goddard ME. Prediction of total genetic value using genome-wide dense marker maps. Genetics. 2001;157(4):1819–1829.
- Newell MA, Jannink JL. Genomic selection in plant breeding. In: Fleury D, Whitford R, editors. Crop breeding: methods and protocols. New York (NY): Humana Press; 2014. p. 117–130. (Methods in Molecular Biology; Vol. 1145).
- Goddard ME, Hayes BJ. Genomic selection. J Anim Breed Genet. 2007;124(6):323–330.
- Ingvarsson PK, Street NR. Association genetics of complex traits in plants. New Phytol. 2011;189(4):909–922.
- Lorenz AJ, Chao S, Asoro FG, et al. Chapter 2: genomic selection in plant breeding: knowledge and prospects. In: Sparks DL, editor. Vol. 110, Advances in agronomy. San Diego (CA): Academic Press; 2011; p. 77–123.
- Furbank RT, Tester M. Phenomics – technologies to relieve the phenotyping bottleneck. Trends Plant Sci. 2011;16(12):635–644.
- Finkel E. With ‘phenomics,’ plant scientists hope to shift breeding into overdrive. Science. 2009;325(5939):380–381.
- Spalding EP, Miller ND. Image analysis is driving a renaissance in growth measurement. Curr Opin Plant Biol. 2013;16(1):100–104.
- Montes JM, Technow F, Dhillon BS, et al. High-throughput non-destructive biomass determination during early plant development in maize under field conditions. Field Crop Res. 2011;121(2):268–273.
- Spindel JE, Begum H, Akdemir D, et al. Genome-wide prediction models that incorporate de novo GWAS are a powerful new tool for tropical rice improvement. Heredity. 2016;116;395–408.
- Feng Z, Zhang B, Ding W, et al. Efficient genome editing in plants using a CRISPR/Cas system. Cell Res. 2013;23(10):1229–1232.
- Hsu PD, Scott DA, Weinstein JA, et al. DNA targeting specificity of RNA-guided Cas9 nucleases. Nat Biotechnol. 2013;31(9):827–832.
- Lozano-Juste J, Cutler SR. Plant genome engineering in full bloom. Trends Plant Sci. 2014;19(5):284–287.
- Qi LS, Larson MH, Gilbert LA, et al. Repurposing CRISPR as an RNA-guided platform for sequence-specific control of gene expression. Cell. 2013;152(5):1173–1183.
- Jinek M, East A, Cheng A et al. RNA-programmed genome editing in human cells. Elife. 2013;2:e00471.
- Makarova KS, Haft DH, Barrangou R et al. Evolution and classification of the CRISPR–Cas systems. Nat Rev Microbiol. 2011;9(6):467–477.
- Shan Q, Wang Y, Li J, et al. Targeted genome modification of crop plants using a CRISPR-Cas system. Nat Biotechnol. 2013;31(8):686–688.
- Ali Z, Abul-faraj A, Piatek M, et al. Activity and specificity of TRV-mediated gene editing in plants. Plant Signal Behav. 2015;10:e1044191.
- Svitashev S, Young JK, Schwartz C, et al. Targeted mutagenesis, precise gene editing, and site-specific gene insertion in maize using Cas9 and guide RNA. Plant Physiol. 2015;169(2):931–945.
- Ma X, Zhang Q, Zhu Q et al. A robust CRISPR/Cas9 system for convenient, high-efficiency multiplex genome editing in monocot and dicot plants. Mol Plant. 2015;8(8):1274–1284.
- Garneau JE, Dupuis ME, Villion M, et al. The CRISPR/Cas bacterial immune system cleaves bacteriophage and plasmid DNA. Nature. 2010;468(7320):67–71.
- Karvelis T, Gasiunas G, Miksys A et al. crRNA and tracrRNA guide Cas9-mediated DNA interference in Streptococcus thermophilus. RNA Biol. 2013;10(5):841–851.
- Marraffini LA, Sontheimer EJ. CRISPR interference: RNA-directed adaptive immunity in bacteria and archaea. Nat Rev Genet. 2010;11(3):181–190.
- Xu Y, Crouch JH. Marker-assisted selection in plant breeding: from publications to practice. Crop Sci. 2008;48(2):391–407.
- Baloch FS, Alsaleh A, Andeden et al. High levels of segregation distortion in the molecular linkage map of bread wheat representing the West Asia and North Africa region. Turk J Agric For 2016;40(3):352–364.
- Baloch FS, Derya M, Andeden EE, et al. Inter-primer binding site retrotransposon and inter-simple sequence repeat diversity among wild Lens species. Biochem Syst Ecol. 2015;58:162–168.
- Andeden EE, Baloch FS, et al. Development, characterization and mapping of microsatellite markers for lentil (Lens culinaris Medik.). Plant Breed. 2015;134(5):589–598.