
 ?Mathematical formulae have been encoded as MathML and are displayed in this HTML version using MathJax in order to improve their display. Uncheck the box to turn MathJax off. This feature requires Javascript. Click on a formula to zoom.
Abstract
Lipases are enzymes that hydrolyze fats into fatty acids and glycerol at the water–lipid interface and are also involved in a variety of bioconversion reactions in non-aqueous and micro-aqueous environments. In this study, we optimized the culture conditions for extracellular lipase production by an indigenous lipase-producing bacterial strain isolated from lipid-rich wastewater, using response surface methodology. The studied isolate was identified as Bacillus aryabhattai SE3-PB by polymerase chain reaction and analysis of 16S rDNA. Sunflower oil was found to induce maximum lipase production. Face centered central composite design revealed that temperature (40 °C), pH (7.6), inoculum volume (2.8%, v/v), agitation (193 rpm) and inducer oil concentration (2%, v/v) significantly influenced lipase production at the respective optimum conditions. The coincidence of observed lipase production (264.02 ± 1.94 U/mL) with predicted lipase yield (265.82 U/mL) coupled with a high correlation coefficient (R2 = 0.9919, P < 0.01) confirmed the validity of the model. A 7.2-fold increase in lipase production was obtained in the optimized medium compared to the basal medium. These findings provide the first report on lipase production and optimization by B. aryabhattai SE3-PB and suggest a rational choice of optimum processing conditions for commercial lipase production by B. aryabhattai SE3-PB.
Introduction
Lipases (triacylglycerol acylhydrolases EC 3.1.1.3) are enzymes that catalyze the hydrolysis of long-chain triglycerides into di-acylglycerides, mono-acylglycerides, glycerol and fatty acids over an oil–water interface [Citation1–3]. In addition, they are involved in a variety of bioconversion reactions including esterification, interesterification, transesterification, alcoholysis, acidolysis and aminolysis in non-aqueous and micro-aqueous milieu [Citation4–6]. This versatility makes lipases the enzyme of choice for numerous biotechnological applications including food, leather, cosmetic, pharmaceutical, detergent, paper and textile industries as well as in the treatment of fat-containing waste effluents [Citation7–9].
Lipases are ubiquitous in nature and are produced by plants, animals and microorganisms [Citation4,Citation10]. However, microbial lipases form the most widely used class of enzymes due to their selectivity, lower production cost, ease of genetic manipulation, high productivity, regiospecificity, stereospecificity, broad substrate specificity and ability to catalyze heterogeneous reactions at the interface of water soluble and water insoluble systems [Citation8,Citation11–13]. Microorganisms such as bacteria, yeast, fungi and actinomycetes have been reported as potential producers of lipase [Citation14–17]. They are found in different habitats, including industrial wastes, vegetable oil processing industries, dairy industries and oil-contaminated sites, among others [Citation18]. Lipase production from many species of Bacillus, including Bacillus pumilus [Citation19], Bacillus subtilis [Citation20], Bacillus thermoleovorans [Citation21], Bacillus cereus [Citation22], Bacillus coagulans [Citation23], Bacillus megaterium [Citation24] and Bacillus licheniformis [Citation25], has been reported. However, this is the first report on production and optimization of lipase from Bacillus aryabhattai.
Bacterial lipases are mostly extracellular and their production is influenced by fermentation conditions such as temperature, pH, inoculum size, agitation, carbon sources, inducer sources and concentrations [Citation26–28]. The search for optimal conditions of the above-mentioned parameters for lipase production in fermentation processes is imperative in order to obtain high yields of the enzyme at lower costs. A classical and conventional practice of achieving these is by varying one factor at a time while keeping others at constant levels. This approach has been proved to be laborious, time-consuming and expensive for simultaneous consideration of many variables in addition to its inability to depict interactive effects among factors and locate optimum conditions among variables. In order to overcome these drawbacks, statistical experimental designs by response surface methodology (RSM) have been recognized as an effective approach in many biotechnological processes [Citation12,Citation26,Citation29].
RSM is a collection of mathematical and statistical techniques for designing experiments, modelling and searching for optimum conditions of factors influencing the responses. It is widely used to identify effective factors, study interactions, select optimum conditions and quantify the relationships between one or more measured responses and the vital input factors in a limited number of experiments [Citation11,Citation30]. Furthermore, RSM has been successfully applied to evaluate and optimize the effect of process parameters in the production of lipase [Citation28,Citation31,Citation32]. A central composite design (CCD) is the most commonly used response surface design when the experimental design is defined by the upper and lower limits of each parameter [Citation16,Citation33]. Several bioprocess parameters have been optimized for enhanced lipase production using CCD [Citation15,Citation16,Citation33,Citation34].
The continuous demand for industrial lipase production with potential biotechnological applications necessitated the need to bioprospect for native and robust/hyperactive bacterial strains capable of mass production of this enzyme. In this study, optimization of culture conditions for enhanced extracellular lipase production by an indigenous B. aryabhattai SE3-PB was investigated using RSM. The effect of various inducer oils on lipase production was also studied. Thereafter, optimization of the selected inducer concentrations along with other process parameters, including temperature, pH, agitation speed and inoculum volume for enhanced lipase production was carried out using face centered CCD (FCCCD).
Materials and methods
Chemicals
p-nitrophenyl palmitate (p-NPP) used as substrate for lipase assay was purchased from Sigma–Aldrich (St. Louis, MO, USA). All other reagents were of analytical grade.
Sample collection and bacterial isolation procedures
Lipid-rich wastewater samples were collected from an oil mill industry in Pietermaritzburg, KwaZulu-Natal (KZN) province, South Africa in sterile 500 mL Schott bottles. Samples (10 mL) were transferred to 250 mL Erlenmeyer flasks containing 100 mL mineral salt medium (MSM) consisting: 1.0 g/L KH2PO4, 1.0 g/L K2HPO4, 1.0 g/L NH4NO3, 0.2 g/L MgSO4.7H2O, 0.02 g/L CaCl2.2H2O and 0.05 g/L FeCl3.6H2O supplemented with 1% olive oil, and then incubated at 37 °C for 48 h at 130 rpm [Citation35]. Enriched cultures (5 mL) were subsequently transferred into a second flask and cultivated under the same conditions. This process was repeated four times. Samples (0.1 mL) of the last enrichment cultures were serially diluted, plated onto nutrient agar (NA) and incubated at 37 °C for 24 h. Pure cultures obtained by sub-culturing on fresh NA plates were preserved as glycerol stock at –80 °C.
Screening of bacteria for lipolytic activity
The lipolytic activity of the bacteria was assessed by using solid media containing different lipid sources, such as olive oil and Tween-20. Enzymatic activity was detected by visual observation and measurement of clear zone on the agar surface.
Screening of bacteria for lipolytic activity using Tween-20 agar
Tween-20 agar consisting (in %, w/v, v/v): peptone 1.0, NaCl 0.5, CaCl2.2H2O 0.01, agar 2.0 and Tween-20 1.0 was prepared as described by Gopinath et al. [Citation36]. A loopful of bacterial culture was inoculated into 10 mL sterile nutrient broth and then incubated at 130 rpm (37 °C) for 24 h. Twenty microliters of obtained culture supernatant were added into wells bored on Tween-20 agar plate and then incubated at 37 °C for 48 h. Sterile nutrient broth was used as a control. Visible precipitate of calcium salts around the wells resulting from formation of fatty acid from lipid hydrolysis indicates the presence of lipolytic activity. All experiments were carried out in triplicate.
Screening of bacteria for lipolytic activity using phenol red agar
Phenol red agar consisting (in %, w/v, v/v): phenol red dye 0.01, olive oil 0.1, CaCl2 0.1 and agar 2.0 was prepared as previously described [Citation37]. The pH of the medium was adjusted to 7.3 using 1 mol/L NaOH or 1 mol/L HCl. Culture supernatant (20 µL) was added into the agar wells and then incubated at 37 °C for 48 h. The change in the colour of phenol red dye to yellow was used as an indication of lipolytic activity. All experiments were carried out in triplicate.
Molecular identification of lipase-producing bacteria and phylogenetic analysis
Genomic DNA extraction
Genomic DNA was isolated from bacterial culture grown overnight on NA plate at 37 °C using the boiling method described by Akinbowale et al. [Citation38] with modifications. Freshly grown colonies (5–7) were suspended in 70 µL sterile distilled water and then boiled at 100 °C for 10 min before cooling on ice for 5 min. This was centrifuged at 13,000 rpm in a micro-centrifuge 5415D (Eppendorf, Hamburg, Germany) for 5 min. Cell-free supernatant was transferred into fresh sterile Eppendorf tubes and used as template DNA for the polymerase chain reaction (PCR).
Amplification, sequencing and analysis of16S rRNA gene
Amplification of the 16S rDNA of the lipase-producing bacterial isolate was carried out using the universal bacterial primers F-5′-CAGGCCTAACACATGCAAGTC-3′ and R-5′-GGGCGGTGTGTACAAGGC-3′ [Citation39]. The PCR mixture consisted of 1× buffer, 1 mmol/L MgCl2, 0.2 mmol/L of each deoxyribonucleoside triphosphate (dNTP), 0.4 µm of each primer, 2 U of Taq polymerase and 2 µL template DNA in a total volume of 25 µL. The mixture was subjected to amplification using a thermocycler (Bio-Rad T100, Singapore) at initial denaturation of 95 °C for 5 min, followed by 30 cycles of; denaturation at 95 °C for 1 min, annealing at 55 °C for 1 min, extension at 72 °C for 1 min 30 s and a final extension at 72 °C for 5 min. Amplification products were observed by electrophoresis in a 1.5% (w/v) agarose gel at 100 V for 45 min in a 1% Tris-acetate-ethylenediaminetetraacetic acid (TAE) buffer. After staining in 1 mg/mL ethidium bromide for 15 min, the products were viewed by ultraviolet (UV) illumination (Syngene, UK), and then sequenced (Inqaba Biotech, Pretoria, South Africa). The resulting sequences were compared with sequences in the GenBank database of the National Centre for Biotechnology Information (NCBI) using the Nucleotide Basic Local Alignment Search Tool (BLAST N) software (www.ncbi.n1m.nih.gov/BLAST). The sequences were aligned using the multiple sequences alignment tool, Clustal W. A phylogenetic tree was constructed with Molecular Evolutionary Genetics analysis (MEGA) version 6.0 software [Citation40] using a neighbour-joining method.
Kinetics of growth and extracellular lipase production
The production medium composed (in %, w/v, v/v): peptone 0.5, yeast extract 0.5, NaCl 0.05, CaCl2 0.005 and olive oil 1.0 emulsified with gum arabic 0.5 [Citation41]. The pH of the medium was adjusted to 7.2 with 1 mol/L NaOH or 1 mol/L HCl. One milliliter of the bacterial culture (OD600nm = 1) was inoculated into 99 mL basal medium in 250 mL Erlenmeyer flasks. The flasks were then incubated at 37 °C (130 rpm) for 72 h in a shaking incubator. Samples were taken at 12-h intervals to determine bacterial growth and lipase production. Bacterial growth was determined by measuring the optical density at 600 nm using a UV-Vis spectrophotometer (UVmini-1240, Schimadzu, Australia). Subsequently, samples were centrifuged at 10,000 rpm for 10 min at 4 °C using a high-speed refrigerated centrifuge (Avanti J-26 XP, Beckman Coulter, USA). The obtained culture supernatants (crude enzyme) were then assayed for lipase activity. Lipase activity was determined as described by Winkler and Stuckmann [Citation42] with some modifications using p-NPP as a substrate. One unit (U) of lipase activity was defined as the amount of enzyme that liberated 1 µmol of p-nitrophenol per milliliter and per minute under standard assay conditions. All experiments were done in triplicate.
Optimization of culture conditions for maximum lipase production
Effect of inducer oils on lipase production
Various vegetable oils including palm oil, castor oil, sunflower oil, canola oil or rice bran oil were screened for the ability to induce maximum lipase production by B. aryabhattai SE3-PB. Olive oil in the fermentation medium for lipase production was replaced with (1%, v/v) of the tested oils while keeping the remaining parameters constant. Homogenous bacterial culture [1% (v/v) of OD600nm = 1] was inoculated into the production medium and then, incubated in a shaking incubator at 130 rpm for 48 h at 37 °C. The fermentation medium was centrifuged at 10,000 rpm at 4 °C for 10 min. The obtained cell-free culture supernatant was assayed for lipase activity, as previously described. All experiments were carried out in triplicate.
Response surface methodology
RSM was employed for the optimization of selected independent variables including inducer oil concentration, agitation, pH, temperature and inoculum volume using FCCCD. These variables were tested at three coded levels (–1, 0, +1). The minimum and maximum ranges of the studied variables and the full experimental plan with respect to their values in actual and coded levels are listed in . A total of 50 experimental runs were generated using the statistical software package Design-Expert® version 10 (Stat Ease Inc., Minneapolis, USA). The response values (Y) in each run were the average of the triplicate. The data obtained from the FCCCD for lipase production were subjected to analysis of variance (ANOVA) in order to assess the significance of the developed model. The experimental results were fitted with the response surface regression procedure using the following second order polynomial equation shown in EquationEquation (1)(1)
(1) :
(1)
(1)
where Y is the predicted response, βo is the intercept term, XiXj are independent variables, βi is the linear coefficient, βii is the quadratic coefficient and βij is the interaction coefficient.
Table 1. Experimental range of independent variables used in FCCCD in terms of actual and coded levels.
Results and discussion
Isolation, screening and identification of lipase-producing bacteria
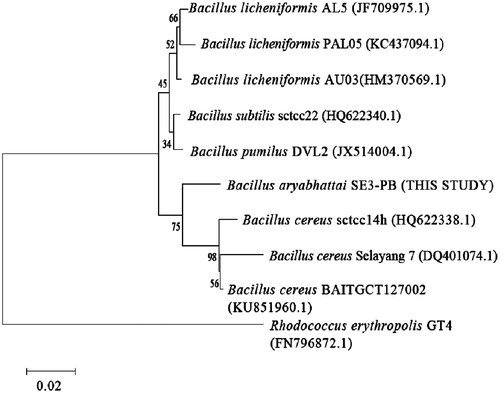
Lipid-rich wastewater samples were collected from an edible oil mill industry in Pietermaritzburg, KwaZulu-Natal (KZN) province of South Africa. The rational choice of this site was to provide a good environment for lipolytic organisms to flourish. Samples were enriched in MSM supplemented with 1% (v/v) olive oil as a sole carbon source in order to stimulate the growth of lipolytic organisms [Citation35]. Lipase-producing bacteria isolated from lipid-rich wastewater have been reported [Citation43–46]. Among the isolated bacterial strains screened for extracellular lipase production on solid media consisting of Tween-20 as an inducer substrate, strain SE3-PB was found to exhibit higher lipolytic activity. This was based on the formation of large visible calcium salt precipitates around the agar well, resulting from the breakdown of Tween-20 into fatty acids (result not shown). Tween-20 is a commonly used substrate for detecting bacterial lipolytic activity as it promotes optimal contact between cells and/or enzymes and substrate [Citation47]. Further screening of strain SE3-PB for lipolytic activity was carried out using a chromogenic approach involving the use of phenol red dye and olive oil as an inducer substrate. Phenol red is a pH indicator with end point at pH 7.3–7.4. The release of fatty acids from lipolysis reaction of olive oil caused a decrease in the pH of the dye, resulting in yellow colouration – an indication of lipolytic activity of the tested bacterial strain [Citation37]. Analysis of the 16S rRNA gene sequence of strain SE3-PB showed that it exhibits close homology (100%) to B. aryabhattai (KX781238.1). This study strain was therefore designated as B. aryabhattai SE3-PB. The relatedness of this strain to other lipase-producing Bacillus sp. is illustrated in the constructed phylogenetic tree ().
Figure 1. Phylogenetic neighbour-joining tree based on 16S rRNA gene sequences of Bacillus aryabhattai SE3-PB showing its relatedness to other lipase-producing Bacillus strains.
Note: GenBank accession numbers are included in parentheses. Number at branching nodes are bootstrap percentages (based on 1000 replicates). Rhodococcus erythropolis GT4 was used as an outgroup. Bar indicates 2% sequence divergence.
Kinetics of growth and lipase production
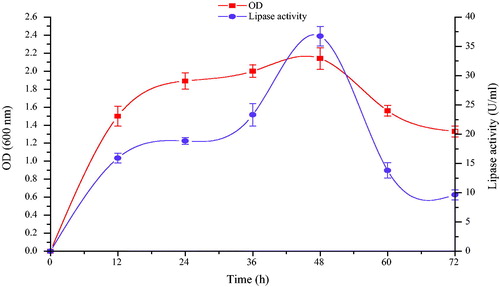
In order to ascertain the exact growth phase at which maximum extracellular lipase production was obtained, B. aryabhattai SE3-PB was grown in a basal medium in shake flasks for 72 h. Samples were taken at 12-h intervals and assayed for bacterial growth and lipase production. Lipase production was found to be growth-linked as parallel relationship was recorded between cell growth and lipase activity. Lipase production was initiated at early log phase and reached optimum during late exponential growth phase. Maximum lipase production (36.75 U/mL) was recorded at 48 h of cultivation period (). This is similar to the findings of Jagtap et al. [Citation48] and Bacha et al. [Citation49], in which optimum lipase production by Acinetobacter haemolyticus and Bacillus stearothermophilus was recorded during late exponential phase. Beyond 48 h, there was a decrease in lipase activity, probably due to the presence of proteases in the fermentation medium.
Figure 2. Time course profile of growth (■) and lipase production (•) by Bacillus aryabhattai SE3-PB cultivated in basal medium at 37 °C and 130 rpm during 72 h incubation.
Note: Values indicate the average of triplicate values; error bars represent the standard deviation.
Selection of inducer oil for maximum lipase production
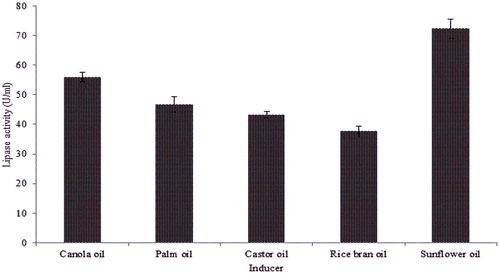
The supplementation of fermentation medium with inducer substrates enhances lipase production and promotes its purification and utilization since the carbon chain moiety of the fatty acids present in triacylglycerol controls lipase production [Citation50]. In this study, olive oil in the fermentation media with lipase production of 36.75 U/mL was replaced with commercial vegetable oils (1%, v/v), viz. castor oil, sunflower oil, rice bran oil, canola oil or palm oil in order to determine the best oil that will induce maximum extracellular lipase production by B. aryabhattai SE3-PB. Lipase production differs in the presence of the various inducer oils. Maximum lipase production of 72.32 U/mL was recorded in the fermentation media supplemented with sunflower oil as an inducer (). The high amounts of lipase production observed in the presence of sunflower oil may be due to high oleic and linoleic fatty acids in the edible oil that act to enhance lipase activity [Citation51]. The lipase production decreased in the order: sunflower oil > canola oil > palm oil > castor oil > rice bran oil. This may probably be due to variations in the fatty acid composition of the vegetable oils, which play a key role in the enzyme production [Citation52,Citation53]. Maximum lipase production by Rhizopus delemar [Citation27], Staphylococcus chromogenes strain 01 A [Citation54] and Fusarium verticillioides [Citation55] in the presence of sunflower oil as an inducible substrate has been reported. Sunflower oil was then selected as inducer for further optimization of lipase production by RSM.
Figure 3. Effect of inducer oils on lipase production by Bacillus aryabhattai SE3-PB grown in a basal medium at 37 °C (130 rpm) for 48 h.
Note: Values indicate the average of triplicate values; error bars represent the standard deviation.
Optimization of culture conditions for improved lipase production using RSM
RSM was used as a successive and exploratory tool for establishing interactions of five independent variables including temperature, pH, inoculum volume, agitation and inducer oil concentration, and to determine their optimum conditions for maximum lipase production. A set of 50 experimental runs were generated by the FCCCD; the results of the predicted and experimental responses (lipase production) are presented in . The results obtained were then subjected to the analysis of variance (ANOVA) in order to establish a response surface quadratic model. The lipase production (Y) expressed as a function of temperature (X1), pH (X2), inoculum volume (X3), agitation (X4) and inducer oil concentration (X5) is illustrated in the second-order polynomial equation in EquationEquation (2)(2)
(2) :
(2)
(2)
Table 2. FCCCD of five independent variables with predicted and observed lipase production.
The model generated was found to be statistically significant with a value of ‘Probability > F’ less than 0.0500 (P < 0.0001), an indication that lipase production could be well described with this model (). The F-value (178.26) showed that the model was significant and suitable for simulation of lipase production with any interaction of the five variables [Citation56,Citation57]. There is only a 0.01% chance that a large ‘model F-value’ could occur due to noise. The high F-value and very low probability depict the model good prediction of lipase production.
Table 3. Analysis of variance (ANOVA) for the response surface quadratic model for optimization of lipase production.
The correlation coefficient (R2) is an index of variance that lies between 0 and 1, with 1 suggesting the effectiveness of the model to navigate the design accurately and 0 showing a total inability [Citation58]. The closer the value of R2 to 1, the stronger the model and better its prediction efficiency of the response [Citation59,Citation60]. The R2 value of 0.9919 signified a relatively high correlation between experimental and predicted values. This also implied that, 99.19% variability of the response could be explained by the model and only about 0.81% of the entire variation cannot be explained by the model [Citation61]. The predicted R2 value of 0.9781 was in accordance with the adjusted R2 value of 0.9864. This suggested that the regression model could be used to describe the response trends [Citation15,Citation30].
The lack-of-fit F-value of 0.48 suggests the lack of fit is not significant relative to pure error. There was a 91.34% chance that a lack of fit F-value this large could occur due to noise. Non-significant lack of fit is good for a model to be fit. Adequate precision measures the ratio of signal to noise. A ratio of 74.857 found to be greater than 4 indicates adequate signal and confirms the model adequacy [Citation30,Citation61,Citation62]. The model could suitably be used to navigate the design space. The coefficient of variation (CV) is the ratio of the standard error of the estimate to the mean value of the observed response. A model can be considered practically reproducible if the CV is below 10% [Citation63]. In the present study, a relative lower CV value of 3.13% suggested precision and reliability of the conducted experiments. In addition, standard deviation, mean and predicted residual sum of squares (PRESS) values of 3.73, 119.09 and 1095.64, respectively were also generated from the model.
Values of probability less than 0.05 show the significance of the model terms whereas, values above 0.1 imply the model terms are not significant. All the independent variables viz. X1, X2, X3, X4 and X5 were significant model terms. The interaction effects of the variables including X1*X2(P = 0.0007), X1*X3 (P < 0.0001), X1*X4(P < 0.0001), X1*X5 (P < 0.0001), X2*X3(P < 0.0001), X2*X4(P < 0.0001), X2*X5(P < 0.0001), X3*X4(P < 0.0001), X3*X5(P < 0.0001) and X4*X5(P < 0.0001) were also found to be significant (P < 0.05) ().
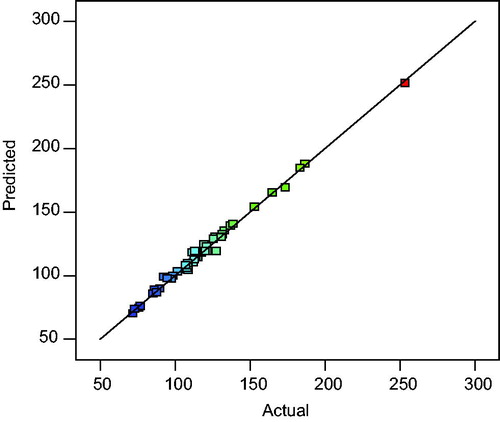
A satisfactory correlation between experimental and predictive values is shown by the predicted versus actual plot (). The clustered points around the diagonal indicate a good fit of the model.
Figure 4. Predicted versus actual response plot for lipase production by Bacillus aryabhattai SE3-PB.
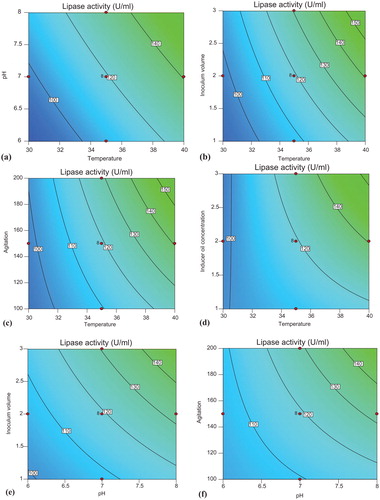
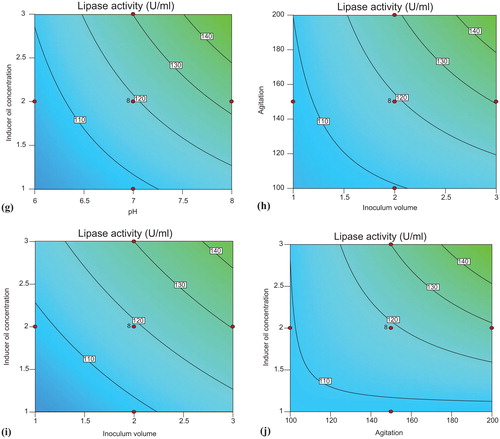
The interaction effects and optimum conditions of the independent variables optimized for enhanced lipase production are presented by contour plots shown in . Two variables were analyzed at a time while keeping other variables at fixed levels (center point) using Design Expert 10 software. Significant interaction was observed among the variables, as illustrated by elliptical contour plot obtained in the case of inducer oil concentration and agitation ().
Figure 5. Contour plots of lipase production by Bacillus aryabhattai SE3-PB showing interaction between temperature and pH (a), inoculum volume and temperature (b), temperature and agitation (c), inducer oil concentration and temperature (d), inoculum volume and pH (e), agitation and pH (f), inducer oil concentration and pH (g), agitation and inoculum volume (h), inducer oil concentration and inoculum volume (i) and inducer oil concentration and agitation (j).
Verification of experimental model
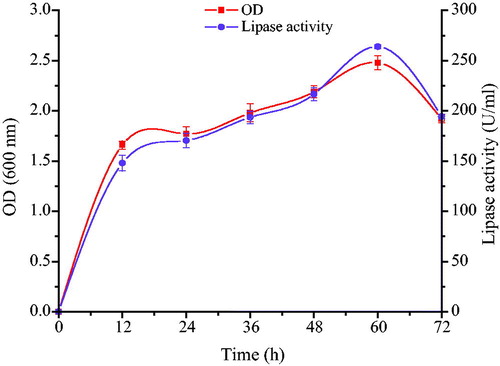
The predicted optimization result by the model suggested that maximum lipase production (265.82 U/mL) by B. aryabhattai SE3-PB could be achieved when temperature, pH, inoculum volume, agitation and inducer oil concentration were set at 40 °C, 7.6, 2.8% (v/v), 193 rpm and 2% (v/v), respectively. This was further confirmed by carrying out a laboratory scale experiment in shake flasks under the conditions predicted by the model. Results obtained showed a maximum mean lipase production of 264.02 ± 1.94 U/mL (60 h) () during late log phase, found to be in agreement with the predicted value. This implied an approximately 98.9% of validity attained, an indication that the model gave an adequate prediction on lipase production. Optimization of culture conditions by B. aryabhattai SE3-PB led to an approximately 7.2-fold increase in lipase production when using the unoptimized medium as reference. A high similarity observed between the predicted and experimental results confirmed the accuracy and applicability of the model for process optimization studies. The statistical experimental design and analysis were found to be efficient in elucidating the significant parameters and respective optimum conditions for maximum lipase production. Improvement of lipase production by B. aryabhattai SE3-PB using FCCCD was considerably higher than that of Burkholderia sp. [Citation15,Citation64], Enterobacter aerogenes [Citation26] and Acinetobacter sp. AU07 [Citation28].
Figure 6. Time course profile of growth (■) and lipase production (•) by Bacillus aryabhattai SE3-PB under the predicted optimal conditions.
Note: The culture medium consisted of 2.8% (v/v) inoculum volume and 2% (v/v) inducer oil concentration with initial pH adjusted to 7.6, and incubated at 40 °C at 193 rpm. Values indicate the average of triplicate values; error bars represent the standard deviation.
Conclusions
In this study, optimization of culture conditions for enhanced extracellular lipase production by B. aryabhattai SE3-PB was investigated using FCCCD. Lipase production was found to be significantly influenced by temperature, pH, inoculum volume, agitation and inducer oil concentration. The coincidence of observed lipase production with the predicted lipase yield confirmed the validity and accuracy of the generated model. An overall 7.2-fold increase in lipase production was recorded after optimization of culture conditions by RSM. This study further reiterates the use of FCCCD in determining significant parameters and optimum conditions for maximum production of desired microbial metabolite. Optimum conditions of the parameters investigated will provide a baseline for further study involving large scale and cost-effective production of lipase by B. aryabhattai SE3-PB.
Acknowledgements
The first author is thankful to Dr. Ajit Kumar for providing technical assistance during the conduct of the experiments.
Disclosure statement
No potential conflict of interest was reported by the authors.
Additional information
Funding
References
- Gilham D, Lehner R. Techniques to measure lipase and esterase activity in vitro. Methods. 2005;36:139–147.
- Angkawidjaja C, Kanaya S. Family I.3 lipase: bacterial lipases secreted by the type I secretion system. Cell Mol. Life Sci. 2006;63:2804–2817.
- Treichel H, de Oliveira D, Mazutti MA, et al. A review on microbial lipases production. Food Bioproc Technol. 2010;3:182–196.
- Joseph B, Ramteke PW, Thomas G. Cold active microbial lipases: some hot issues and recent developments. Biotechnol Adv. 2008;26:457–470.
- Casas-Godoy L, Duquesne S, Bordes F, et al. Lipases: an overview. Methods Mol Biol. 2012;861:3–30.
- Singh AK, Mukhopadhyay M. Overview of fungal lipase: a review. Appl Biochem Biotechnol. 2012;166:486–520.
- Bora L, Gohain D, Das R. Recent advances in production and biotechnological applications of thermostable and alkaline bacterial lipases. J Chem Technol Biotechnol. 2013;88:1959–1970.
- Hasan F, Shah AA, Hameed A. Industrial applications of microbial lipases. Enzyme Microb Technol. 2006;39:235–251.
- Kapoor M, Gupta MN. Lipase promiscuity and its biochemical applications. Proc Biochem. 2012;47:555–569.
- Dutta S, Ray L. Production and characterization of an alkaline thermostable crude lipase from an isolated strain of Bacillus cereus C7. Appl Biochem Biotechnol. 2009;159:142–154.
- Gupta N, Mehra G, Gupta R. A glycerol-inducible thermostable lipase from Bacillus sp.: medium optimization by a Plackett-Burman design and by response surface methodology. Can J Microbiol. 2004;50:361–368.
- Oliveira F, Souza CE, Peclat VROL, et al. Optimization of lipase production by Aspergillus ibericus from oil cakes and its application in esterification reactions. Food Bioprod Process. 2017;102:268–277.
- Wang F, Zhang H, Zhao Z, et al. Recombinant lipase from Gibberella zeae exhibits broad substrate specificity: a comparative study on emulsified and monomolecular substrate. Int J Mol Sci. 2017;18:1535. doi:10.3390/ijms18071535
- Aly MM, Tork S, Alo-Garni SM, et al. Production of lipase from genetically improved Streptomyces exfoliates LP10 isolated from oil-contaminated soil. Afr J Microbiol Res. 2012;6:1125–1137.
- Lo C-F, Yu C-Y, Kuan I-C, et al. Optimization of lipase production by Burkholderia sp. using response surface methodology. Int J Mol Sci. 2012;13:14889–14897.
- Colla LM, Primaz AL, Benedetti S, et al. Surface response methodology for the optimization of lipase production under submerged fermentation by filamentous fungi. Braz J Microbiol. 2016;47:461–467.
- de Almeida AF, Dias KB, da Silva ACC, et al. Agroindustrial wastes as alternative for lipase production by Candida viswanathii under solid-state cultivation: purification, biochemical properties, and its potential for poultry fat hydrolysis. Enzyme Res. 2016;2016:1353497. doi:10.1155/2016/1353497
- Sharma R, Christi Y, Banerjee UC. Production, purification, characterization, and application of lipases. Biotechnol Adv. 2001;19:627–662.
- Kumar R, Sharma A, Kumar A, et al. Lipase from Bacillus pumilus RK31: production, purification and some properties. World Appl Sci J. 2012;16:940–948.
- Shah KR, Bhatt SA. Purification and characterization of lipase from Bacillus subtilis Pa2. J Biochem Technol. 2011;3:292–295.
- Castro-Ochoa LD, Rodríguez-Gómez C, Valerio-Alfaro G, et al. Screening, purification and characterization of the thermoalkalophilic lipase produced by Bacillus thermoleovorans CCR11. Enzyme Microb Technol. 2005;37:648–654.
- Awad GEA, Mostafa H, Danial EN, et al. Enhanced production of thermostable lipase from Bacillus cereus ASSCRC-P1 in waste frying oil based medium using statistical experimental design. J Appl Pharm Sci. 2015;5:007–015.
- Daouadji KL, Reffas FZI, Benine ML, et al. Optimization of various physical and chemical parameters for lipase production by Bacillus coagulans. Am Eurasian J Agric Environ Sci. 2015;15:962–968.
- Sekhon A, Dahiya N, Tewari RP, et al. Production of extracellular lipase from Bacillus megaterium AKG-1 in submerged fermentation. Indian J Biotechnol. 2006;5:179–183.
- Kaur G, Singh A, Sharma R, et al. Cloning, expression, purification and characterization of lipase from Bacillus licheniformis isolated from hot spring of Himachal Pradesh, India. 3 Biotech. 2016;6:49. doi:10.1007/s13205-016-0369-y
- Kumari A, Mahapatra P, Banerjee R. Statistical optimization of culture conditions by response surface methodology for synthesis of lipase with Enterobacter aerogenes. Braz Arch Biol Technol. 2009;52:1349–1356.
- Açikel Ü, Erşan M, Açikel YS. The effect of the composition of growth medium and fermentation conditions on the production of lipase by R. delemar. Turk J Biol. 2011;35:35–44.
- Gururaj P, Ramalingam S, Devi GN, et al. Process optimization for production and purification of a thermostable, organic solvent tolerant lipase from Acinetobacter sp. AU07. Braz J Microbiol. 2016;47:647–657.
- Yin XL, You QH, Jiang ZH. Optimization of enzyme assisted extraction of polysaccharides from Tricholoma matsutake by response surface methodology. Carbohydr Polym. 2011;86:1358–1364.
- Açikel Ü, Erşan M, Açikel YS. Optimization of critical medium components using response surface methodology for lipase production by Rhizopus delemar. Food Bioprod Proc. 2010;88:31–39.
- Jia J, Yang X, Wu Z, et al. Optimization of fermentation medium for extracellular lipase production from Aspergillus niger using response surface methodology. Biomed Res Int. 2015;2015:497462. doi:10.1155/2015/497462
- Neter J, Kutner MH, Nachtsheim CJ, et al. Applied linear statistical models. 4th ed. Chicago, IL: McGraw-Hill Inc.; 1996.
- Rathi P, Goswami VK, Sahai V, et al. Statistical medium optimization and production of a hyperthermostable lipase from Burkholderia cepacia in a bioreactor. J Appl Microbiol. 2002;93:930–936.
- Papagora C, Roukas T, Kotzekidou P. Optimization of extracellular lipase production by Debaryomyces hansenii isolates from dry-salted olives using response surface methodology. Food Bioprod Process. 2013;91:413–420.
- Abd Rahman RN, Leow TC, Salleh A, et al. Geobacilluszalihae sp. nov., a thermophilic lipolytic bacterium isolated from palm oil mill effluent in Malaysia. BMC Microbiol. 2007;7:77. doi:10.1186/1471-2180-7-77
- Gopinath SCB, Anbu P, Hilda A. Extracellular enzymatic activity profiles in fungi isolated from oil-rich environments. Mycoscience. 2005;46:119–126.
- Singh R, Gupta N, Goswami VK, et al. A simple activity staining protocol for lipases and esterases. Appl Microbiol Biotechnol. 2006;70:679–682.
- Akinbowale OL, Peng H, Grant P, et al. Antibiotic and heavy metal resistance in motile aeromonads and pseudomonads from rainbow trout (Oncorhynchus mykiss) farms in Australia. Int J Antimicrob Agents. 2007;30:177–182.
- Marchesi JR, Sato T, Weightman AJ, et al. Design and evaluation of useful bacterium-specific PCR primers that amplify genes coding for bacterial 16S rRNA. Appl Environ Microbiol. 1998;64:795–799.
- Tamura K, Stecher G, Peterson D, et al. MEGA 6: molecular evolutionary genetics analysis version 6.0. Mol Biol Evol. 2013;30:2725–2729.
- Kumar S, Kiko K, Upadhyay A, et al. Production, purification, and characterization of lipase from thermophilic and alkaliphilic Bacillus coagulans BTS-3. Protein Expression Purif. 2005;41:38–44.
- Winkler UK, Stuckmann M. Glycogen, hyaluronate, and some other polysaccharides greatly enhance the formation of exolipase by Serratia marcescens. J Bacteriol. 1979;138:663–670.
- Bhumibhamon O, Koprasertsak A, Funthong S. Biotreatment of high fat and oil wastewater by lipase producing microorganisms. Kasetsart J Nat Sci. 2002;36:261–267.
- Shon HK, Tian D, Kwon D-Y, et al. Degradation of fat, oil and greases (FOGs) by lipase-producing bacterium Pseudomonas sp. Strain D2D3. J Microbiol Biotechnol. 2002;12:583–591.
- Mobarak-Qamsari E, Kasra-Kermanshahi R, Moosavi-nejad Z. Isolation and identification of a novel, lipase-producing bacterium, Pseudomonas aeruginosa KM110. Iranian J Microbiol. 2011;3:92–98.
- Sarac N, Ugur A. A green alternative for oily wastewater treatment: lipase from Acinetobacter haemolyticus NS02-30. Desalin Water Treat. 2016;57:19750–19759.
- Thomson CA, Delaquis PJ, Mazza G. Detection and measurement of microbial lipase activity: a review. Crit Rev Food Sci Nutr. 1999;39:165–187.
- Jagtap S, Gore S, Yavankar S, et al. Optimization of medium for lipase production by Acinetobacter haemolyticus from healthy human skin. Indian J Exp Biol. 2010;48:936–941.
- Bacha AB, Moubayed NMS, Abid I. Thermostable, alkaline and detergent-tolerant lipase from a newly isolated thermophilic Bacillus stearothermophilus. Indian J Biochem Biophys. 2015;52:179–188.
- Sethi BK, Nanda PK, Sahoo S. Characterization of biotechnologically relevant extracellular lipase produced by Aspergillus terreus NCFT 4269.10. Braz. J Microbiol. 2016;47:143–149.
- dos Santos RR, Muruci LNM, Santos LO, et al. Characteristics of different oil soapstocks and their application in the lipase production by Aspergillus niger under solid state fermentation. J Food Nutr Res. 2014;2:561–566.
- Wang D, Xu Y, Shan T. Effects of oils and oil-related substrates on the synthetic activity of membrane-bound lipase from Rhizopus chinensis and optimization of the lipase fermentation media. Biochem Eng J. 2008;41:30–37.
- Krzyczkowska J, Kozlowska M. Effect of oils extracted from plant seeds on the growth and lipolytic activity of Yarrowia lipolytica yeast. J Am Oil Chem Soc. 2017;94:661–671.
- Golani M, Hajela K, Pandey GP. Screening, identification, characterization and production of bacterial lipase from oil spilled soil. Int J Curr Microbiol Appl Sci. 2016;5:745–763.
- Facchini FDA, Vici AC, Pereira MG, Jorge JA, Polizeli MDTM. Enhanced lipase production of Fusarium verticillioides by using response surface methodology and wastewater pretreatment application. J Biochem Tech. 2015;6:996–1002.
- Sifour M, Zaghloul TI, Saeed HM, et al. Enhanced production of lipase by the thermophilic Geobacillus stearothermophilus strain-5 using statistical experimental designs. New Biotechnol. 2010;27:330–336.
- Ebrahimipour G, Sadeghi H, Zarinviarsagh M. Statistical methodologies for the optimization of lipase and biosurfactant by Ochrobactrum intermedium strain MZV101 in an identical medium for detergent applications. Molecules. 2017;22:1460. doi:10.3390/molecules22091460
- Whiteman J, Kana EBG. Comparative assessment of the artificial neural network and response surface modelling efficiencies for biohydrogen production on sugar cane molasses. Bioenergy Res. 2014;7:295–305.
- Doddapaneni KK, Tatineni R, Potumarthi R, et al. Optimization of media constituents through response surface methodology for improved production of alkaline protease by Serratia rubidea. J Chem Technol Biotechnol. 2007;82:721–729.
- Abu ML, Nooh HM, Oslan SN, et al. Optimization of physical conditions for the production of thermostable T1 lipase in Pichia guilliermondii strain SO using response surface methodology. BMC Biotechnol. 2017;17:78. doi:10.1186/s12896-017-0397-7
- Shabbiri K, Adnan A. Bio-statistically optimized production of lipases by Brevibacterium linens DSM 20158. World Appl Sci J. 2011;13:1059–1066.
- Gupta N, Sahai V, Gupta R. Alkaline lipase from a novel strain Burkholderia multivorans: statistical medium optimization and production in a bioreactor. Proc Biochem. 2007;42:518–526.
- Joglekar AM, May AT. Product excellence through design of experiments. Cereal Food World. 1987;32:857–868.
- Liu C-H, Lu W-B, Chang J-S. Optimizing lipase production of Burkholderia sp. by response surface methodology. Proc Biochem. 2006;41:1940–1944.