
Abstract
The use of plasmid DNA (pDNA) for human vaccines is a novel approach against leishmaniasis, a neglected tropical disease with severe clinical manifestations. The development of feasible bioprocesses to obtain such vaccines is a public-health priority. The aim of this work was to investigate the substrate-source flexibility of an exponential-fed perfusion (EFP) system to produce the plasmid pVAX1-NH36 for use as a leishmaniasis vaccine. Batch and EFP cultures were conducted using Escherichia coli DH5α as a host and glucose or glycerol as a carbon source. The culture kinetics of the cell, substrate and plasmid concentrations were measured. Mathematical kinetics models were fitted to experimental data and used to describe the system comportment (r2 > 0.95). Plasmid productivities of 13.3 mg/(L h) using glucose and 19.4 mg/(L h) using glycerol were obtained. These levels represent a 1–3-fold increase in performance index compared with previously reported cultures using E. coli DH5α. The novel aspect of this work is the demonstration of the flexibility of EFP cultures for production of pDNA vaccines. Our data suggest that E. coli engineering to increase pDNA production using glucose can be circumvented with an EFP culture, reducing the host strain development costs. In addition, the greater productivity of EFP cultures entails a reduction in manufacturing costs.
Introduction
The employment of plasmid DNA (pDNA) vaccines is a new technology to mimic infections and generate a resilient immune response [Citation1]. The advances made in pDNA design, delivery, formulation and manufacturing have been reviewed recently [Citation2,Citation3]. pDNA vaccines are candidates for several diseases [Citation4], but have only been licensed for veterinary use [Citation5]. However, several clinical studies of human pDNA vaccines are currently being developed against challenging diseases and viral pandemics [Citation6,Citation7]. Hence, the DNA vaccination market is growing and demands the development of sustainable industrial bioprocesses to produce pDNA [Citation8–10].
Leishmaniasis is prevalent mainly in countries with limited resources, where it presents millions of human infections each year [Citation11]. It is categorized as a neglected tropical disease (NTD) and occupies first place in the disability-adjusted life years (DALYs) rank, representing years of life lost for premature death plus years lived with disability [Citation12]. Leishmaniasis comprises a group of diseases caused by obligate intracellular parasites, belonging to the genus Leishmania, which infect mononuclear phagocytes [Citation13]. Their pathogenicity ranges from mild cutaneous lesions to severe organ injuries. The transmission of leishmaniasis occurs by the bite of a sand fly belonging to the genus Phlebotomus and Lutzomiya [Citation14].
The development of a vaccine is currently perceived as the right approach to battle leishmaniasis and is considered a social priority [Citation15]. In particular, a pDNA vaccine carrying the nucleoside hydrolase NH36 gene is a suitable candidate for this purpose [Citation16,Citation17].
First-generation vaccines are typically produced using eukaryotic cells, while pDNA is manufactured using a bacterial host in high cell density cultures (HCDC), resulting in improved production systems [Citation18]. Plasmid solutions obtained in Escherichia coli cultures contain supercoiled (CCC), open circular (OC) and linear (L) isoforms [Citation19]. Isoform CCC pDNA is recommended by regulatory agencies for vaccine treatments due to the structural alterations present in the OC and L isoforms [Citation20].
The key performance parameters of pDNA production bioprocesses, besides vector design and host strain, depend on culture medium design, growth conditions, and purification strategy [Citation21–23]. Several cultivation reports have shown an inverse relationship between plasmid content and growth rate, and control of this kinetic parameter at low values during the culture has been recommended, but more research is required to better understand this behaviour [Citation8].
An improper cultivation environment can reduce the percentage of pDNA yield. For example, it has been observed that the changes associated with the transition at the end of the conventional culture modes appear to increase the genomic contamination [Citation24]. The use of synthetic growth medium for pDNA production is recommended by regulatory guidelines [Citation2]. An important consideration is the medium composition including the carbon source, since it can affect this production [Citation25]. It has been reported that E. coli DH5α produces more pDNA in HCDC using glycerol than using glucose. Moreover, the use of glucose increases the surplus acetate production [Citation10,Citation26].
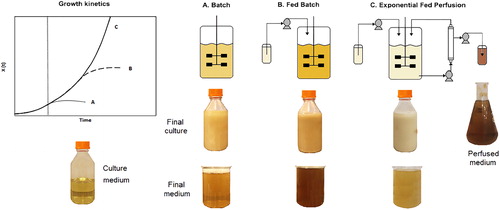
A fundamental decision in the process development is the selection between batch, fed-batch and perfusion bioreactors () [Citation4,Citation23,Citation25]. The operating time of HCDC in batch and fed-batch modes for pDNA production is restricted by the concentration of unwanted substances and plasmid instability [Citation27]. The perfusion mode can circumvent these restrictions, since the exhausted medium is eliminated and the growth rate is controlled with the substrate feed-rate, resulting in less cell injury, and higher CCC pDNA yield and productivity compared with fed-batch cultures [Citation4,Citation23].
Figure 1. Modes of operation of bioreactors for pDNA production and medium colour comparison.
The technical feasibility of EFP culture has been demonstrated using the conventional approach of glycerol-limited culture [Citation28]. The competitive prices of glycerol support this practice [Citation29], but the development of flexible processes suitable to metabolise glucose or glycerol as substrate is pertinent for industrial plasmid manufacturing [Citation23]. Nevertheless, it is necessary to consider that plasmid yield and purity are affected by the type of nutrients or by oxygen limitation [Citation30], and the flexibility-based relevance of EFP cultures needs to be demonstrated experimentally.
In this study, the flexibility of an EFP culture to produce pVAX1-NH36 was investigated using glucose or glycerol as carbon source. A model of cell, substrate and plasmid kinetics was solved numerically, fitted to the data and used to analyze the system’s comportment and flexibility. In addition, the oxygen demand and control with each carbon source were also evaluated.
Materials and methods
Host strain and plasmid
The E. coli DH5α strain hosting pVAX1-NH36 (4.0 kbp) used in this work was acquired form CINVESTAV-IPN (Mexico City, Mexico) [Citation31].
Culture conditions
Three batch cultures were performed using a defined medium with each substrate (glucose or glycerol) and the same experimental conditions in order to obtain the culture kinetics parameters. The information obtained was used to experimentally reproduce EFP cultures with each carbon source.
Culture medium
A mineral salt medium was employed with glucose or glycerol as carbon source as described previously [Citation10]. The batch cultures and the initial batch phase of the EFP cultures started with 13.0 g/L of the carbon substrate. In the EFP phase, a defined medium solution with 18 g/L of the carbon source was fed to the bioreactor.
Bioreactor cultivations
To implement the batch and perfusion cultures, a 3.0 L stirred-tank bioreactor (Applikon® Biotechnology, Delft, The Netherlands) with an operational volume of 1.0 L was used as described in a prior study [Citation4], except that pH was controlled at 6.7 ± 0.05 using a 28% NH4OH solution. Dissolved oxygen (DO) was controlled at 30% of saturation combining agitation, aeration and pure oxygen pulses.
Additionally, we used the KrosFlo Research III tangential flow filtration (TFF) system with a UF unit X3-500S-300-02N (Spectrum® Laboratories, Inc., Rancho Dominguez, CA, USA) for EFP cultures. Fermentations started in a batch mode to increase cell mass. When the substrate was exhausted, an exponential feed was applied to keep a perfusion growth rate of µp = 0.25 h−1.
Analytical methods
Biomass and substrate determination
The optical density at 600 nm (OD600) of the culture samples taken was measured in a UV-1600PC spectrometer (VRW®, United States). Glucose was determined with a kit glucose (GO) assay and glycerol using free glycerol reagent (Sigma-Aldrich, USA).
Plasmid analysis
For determining plasmid content, samples with uniform cell mass were obtained during the culture. Each sample was lysed and then centrifuged, obtaining a pellet for plasmid preparation. We used HIC-HPLC analysis to measure pDNA concentration, as reported in the literature [Citation32]. Plasmid solutions were also examined by electrophoresis as described previously [Citation4], except that they were run on agarose gel (0.8%) at 60 V for 120 min.
Mathematical model
The corresponding kinetic model for the EFP process has been reported recently [Citation28]. In this work, the model was validated and used to reproduce the EFP cultures and to analyze the system’s performance. The simulation studies were conducted using MATLAB.
Results and discussion
Batch cultures
Cell growth and substrate consumption
shows the biomass growth and substrate consumption kinetics of the batch cultures. The culture using glucose lasted for 5.5 h and a maximum cell density of 16.36 OD600 was obtained (). The culture using glycerol lasted for 5.0 h and a maximum cell density of 12.50 OD600 was obtained (). The simulation results of the three batch cultures presented an adequate adjustment to the kinetic data with r2 ≥ 0.98 for both biomass and substrate concentration. The corresponding operating and kinetic parameters are shown in .
Figure 2. Kinetics of batch fermentation. Biomass growth and substrate-consumption kinetics using glucose (a) and glycerol (b). Experimental mean with standard deviation (±SD) of cell [○] and substrate [■] concentrations. Plasmid formation kinetics using glucose (c) and glycerol (d). Experimental mean with SD of VY [♦], SY [▲]. [—] Adjusted model.
![Figure 2. Kinetics of batch fermentation. Biomass growth and substrate-consumption kinetics using glucose (a) and glycerol (b). Experimental mean with standard deviation (±SD) of cell [○] and substrate [■] concentrations. Plasmid formation kinetics using glucose (c) and glycerol (d). Experimental mean with SD of VY [♦], SY [▲]. [—] Adjusted model.](/cms/asset/fe36372e-673b-463e-a727-acd2f9499747/tbeq_a_1560232_f0002_b.jpg)
Table 1. Operating and kinetic parameters of batch and EFP cultures.
Plasmid kinetics and yield
The plasmid kinetics in batch cultures using glucose or glycerol are shown in . In the glucose batch experiment (), the final plasmid specific yield (SY) was 1.35 mg/(L OD600) and the volumetric yield (VY) was 22.10 mg/L. Plasmid specific yield decreased as the cell growth rate increased due to a dilution effect, which is one of the limitations of batch cultures for plasmid production. However, the volumetric yield increased due to the quantitative effect of cell growth.
In the glycerol batch experiments (), the final plasmid SY was 2.70 mg/(L OD600) and the VY was 33.75 mg/L. Plasmid specific yield increased during the culture due to a lower specific growth rate. In all the batch experiments, the models presented an adequate adjustment to the kinetic data with r2 ≥ 0.97 for both volumetric and specific plasmid yield.
Plasmid specific and volumetric yields depend on the biological system used, and on the culture conditions. Cultures in lab-scale bioreactors using E. coli DH5α and diverse fermentation approaches have been reported recently [Citation29]. High productivity of 4.00 and 6.75 mg pDNA/(L h) was obtained in this study in batch mode for glucose and glycerol, respectively. This short-term culture permits the maintenance of cellular plasmid content without a significant dilution, as seen in , but in the long run the use of this approach will entail higher operational costs.
Plasmid purity
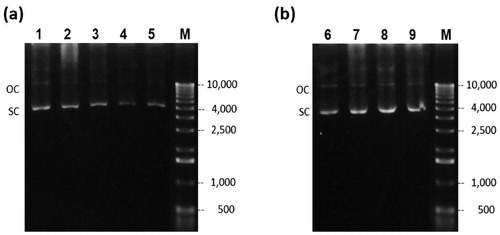
The agarose gel electrophoresis images () of the samples taken during the batch cultures for glucose or glycerol showed predominantly CCC pDNA with small amounts of OC pDNA. When using glucose (), the plasmid content decreases as the fermentation time progresses, as was determined in the HIC-HPLC analysis and discussed above. However, plasmid content () increased with glycerol, due to a lower specific growth rate.
Figure 3. Agarose gel electrophoresis of cell lysate of the batch fermentation. Glucose culture (a) lanes 1–5 correspond to time 0, 2, 4, 5, and 5.5 h respectively. Glycerol culture, (b) lanes 6–9 correspond to 0, 2, 4 and 5 h respectively. (M) Molecular weight marker.
Exponential-fed perfusion cultures
Cell growth and substrate consumption
Using the experimental parameters obtained in the batch cultures, we reproduced the EFP cultures. shows the corresponding biomass and substrate kinetics. The continuous lines in the figure represent the fitted EFP model.
Figure 4. Kinetics of the EFP fermentation. Exponential feed with μp = 0.25 h−1. Biomass and substrate consumption kinetics using glucose (a) and glycerol (b). Experimental cell concentration [○] and substrate concentration [■]. Plasmid formation kinetics using glucose (c) and glycerol (d). Experimental VY [♦] and SY [▲]. [—] Fitted model.
![Figure 4. Kinetics of the EFP fermentation. Exponential feed with μp = 0.25 h−1. Biomass and substrate consumption kinetics using glucose (a) and glycerol (b). Experimental cell concentration [○] and substrate concentration [■]. Plasmid formation kinetics using glucose (c) and glycerol (d). Experimental VY [♦] and SY [▲]. [—] Fitted model.](/cms/asset/fbaaefde-b5ba-4f23-af49-94fa52bfacb2/tbeq_a_1560232_f0004_b.jpg)
The batch phase of the experiment using glucose () was run for 5.5 h, which enabled culture at μmax and minimized the operating time to reach the final biomass concentration of 86.0 OD600. This period was followed by an exponential phase of 6.5 h, initiated using a feeding strategy to accomplish a constant μp = 0.25 h−1, and to increase the plasmid specific yield. Analogously, the batch and exponential phases of the experiment using glycerol () lasted 5.0 and 7.0 h respectively. A maximum cell density of 66.5 OD600 was obtained at the end of the experiment.
In both EFP experiments, the model presented an adequate adjustment to the kinetic data, attaining r2 = 0.99. The final biomass concentration using glucose was 31% higher than with glycerol. Similar results have been reported previously [Citation33]. The corresponding operating and kinetic parameters are shown in .
Plasmid kinetics and yield
The kinetics of plasmid production determined by HIC-HPLC in the EFP cultures are shown in . The continuous line represents the fitted plasmid model.
In the glucose EFP experiment () the SY was 1.86 mg/(L OD600) and the VY was 160.00 mg/L. Plasmid SY decreases during the batch phase due to a dilution effect. Once the EFP phase begins, the SY starts to increase, since the plasmid dilution effect is minimized. However, the volumetric yield increases due to the quantitative effect of cell growth.
In the glycerol EFP experiment (), the final plasmid SY was 3.5 mg/(L OD600) and the VY was 233.0 mg/L. Plasmid SY increases in the batch and EFP phases due the lower specific growth rate attained. In both EFP experiments the model presented an adequate adjustment to the kinetic data with r2 ≥ 0.95.
The plasmid productivities were 13.33 and 19.40 mg/(L h) for glucose and glycerol respectively, representing 1–3-fold increases with respect to previously reported fed-batch cultures at bench and pilot scale using E. coli DH5α [Citation33–35]. The economic feasibility of EFP cultures requires that the increment in revenues expected from higher plasmid productivity outpaces the additional expenses related to the pumps and filters required for the system.
Plasmid purity
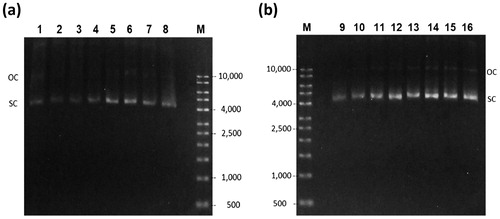
Agarose gel electrophoresis images of the samples taken during the EFP cultures showed predominately CCC pDNA with small amounts of OC pDNA (). Using glucose (), the plasmid content decreased as the fermentation time progressed during the batch phase, then increased during the EFP phase (based on the HIC-HPLC analysis and discussed above). The corresponding image for glycerol culture () showed a steady increase of plasmid content.
Figure 5. Agarose gel electrophoresis of cell lysate of the EFP fermentation. Glucose culture (a) lanes 1–8 correspond to samples at time 0, 4, 5, 5.5, 6, 8, 10, and 12 h respectively. Glycerol culture (b) lanes 9–16 correspond to time 0, 4, 5, 6, 8, 10, 11, and 12 h respectively. (M) Molecular weight marker.
Oxygen control
The oxygen control charts for the batch and EFP experiments are shown in . In the course of glucose cultures (), the DO comportment was steadier than in cultures using glycerol (). This behaviour was also steadier than DO variations observed in cultures reported previously [Citation36].
Figure 6. Dissolved oxygen control. Batch (a) and EFP (b) experiments using glucose and batch (c) and EFP (d) experiments using glycerol.
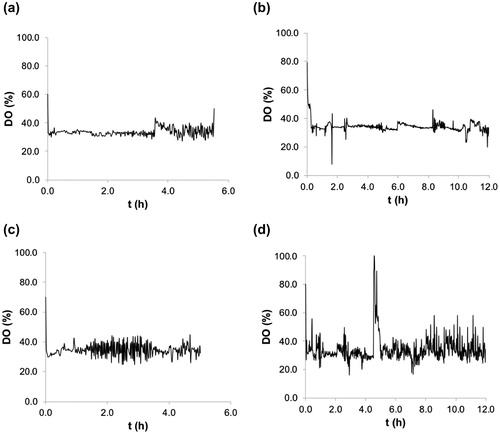
In E. coli aerobic cultures using glucose as substrate, the biomass yield based in oxygen (YX/O2) is bigger than the respective parameter using glycerol [Citation37,Citation38]. This implies a lower oxygen uptake rate (OUR) in glucose- than in glycerol-limited cultures and leads to a synergetic effect, since less aeration and consequently less antifoam is necessary in the culture. Under these conditions, a better oxygen control and transfer rate (OTR) is obtained, due to silicone oil-containing antifoams reducing the OTR even at low concentrations [Citation39,Citation40].
Conclusions
The substrate-source flexibility of an EFP system to produce the plasmid pVAX1-NH36 for use as leishmaniasis vaccine was investigated using batch and EFP cultures; with glucose or glycerol as limiting substrate. The kinetic parameters obtained in the batch cultures were used to reproduce the EFP cultures. The model of these cultures presented an adequate adjustment to the kinetic data. A higher productivity of the EFP cultures compared to conventional bioprocesses using either substrate source was found. The EFP using glycerol presented higher plasmid productivity but resulted in higher operational cost than EFP glucose cultures, in spite of the constant decrease in glycerol prices. On the other hand, the oxygen demand and control were better during the glucose fermentation. These results may suggest the use of glycerol during the batch phase culture to minimize the plasmid dilution, and glucose during the EFP phase for a better oxygen control, since in this phase the specific growth rate is controlled, and plasmid dilution is minimized. The novel aspect of this work is the demonstration of the flexibility of EFP cultures for production of pDNA vaccines, which is advantageous for industrial development of plasmid-based biopharmaceuticals. Our data suggest that E. coli engineering to increase pDNA production using glucose can be circumvented with an EFP culture, reducing the host strain development costs. In addition, the greater productivity of EFP cultures entails a reduction in manufacturing costs.
Disclosure statement
No potential conflict of interest was reported by the authors.
Additional information
Funding
Related Research Data
References
- Gonzalez-Valdez J, Aguilar-Yanez JM, Benavides J, et al. DNA based vaccines offer improved vaccination supply for the developing world. J Chem Technol Biotechnol. 2013;88:979–982.
- Schmeer M, Buchholz T, Schleef M. Plasmid DNA manufacturing for indirect and direct clinical applications. Hum Gene Ther. 2017;28:856–861.
- Tregoning JS, Kinnear E. Using plasmids as DNA vaccines for infectious diseases. Microbiol Spectr. 2014;2869:1–16.
- Munguia-Soto R, Garcia-Rendon A, Garibay-Escobar A, et al. Segregated growth kinetics of Escherichia coli DH5-NH36 in exponential-fed perfusion culture for pDNA vaccine production. Biotechnol Appl Biochem. 2015;62:795–805.
- Grunwald T, Ulbert S. Improvement of DNA vaccination by adjuvants and sophisticated delivery devices: vaccine-platforms for the battle against infectious diseases. Clin Exp Vaccine Res. 2015;4:1–10.
- Abbink P, Larocca RA, De La Barrera RA, et al. Protective efficacy of multiple vaccine platforms against Zika virus challenge in rhesus monkeys. Science. 2016;353:1129–1132.
- Nakayama Y, Aruga A. Comparison of current regulatory status for gene-based vaccines in the U.S., Europe and Japan. Vaccines (Basel). 2015;3:186–202.
- Goncalves GA, Bower DM, Prazeres DMF, et al. Rational engineering of Escherichia coli strains for plasmid biopharmaceutical manufacturing. Biotechnol J. 2012;7:251–261.
- Cheng L, Sun XM, Yi XP, et al. Large-scale plasmid preparation for transient gene expression. Biotechnol Lett. 2011;33:1559–1564.
- Bohle K, Ross A. Plasmid DNA production for pharmaceutical use: role of specific growth rate and impact on process design. Biotechnol Bioeng. 2011;108:2099–2106.
- de Almeida L, Fujimura AT, Del Cistia ML, et al. Nanotechnological strategies for treatment of leishmaniasis – a review. J Biomed Nanotechnol. 2017;13:117–133.
- Hotez PJ, Bottazzi ME, Strych U. New vaccines for the world's poorest people. Annu Rev Med. 2016;67:405–417.
- Walker DM, Oghumu S, Gupta G, et al. Mechanisms of cellular invasion by intracellular parasites. Cell Mol Life Sci. 2014;71:1245–1263.
- Jain K, Jain NK. Vaccines for visceral leishmaniasis: a review. J Immunol Methods. 2015;422:1–12.
- Kedzierski L. Leishmaniasis. Hum Vaccin. 2011;7:1204–1214.
- Carrillo E, Fernandez L, Ibarra-Meneses AV, et al. F1 domain of the Leishmania (Leishmania) donovani nucleoside hydrolase promotes a Th1 response in Leishmania (Leishmania) infantum cured patients and in asymptomatic individuals living in an endemic area of leishmaniasis. Front Immunol. 2017;8:1–13.
- Nagill R, Kaur S. Vaccine candidates for leishmaniasis: a review. Int Immunopharmacol. 2011;11:1464–1488.
- Wunderlich M, Taymaz-Nikerel H, Gosset G, et al. Effect of growth rate on plasmid DNA production and metabolic performance of engineered Escherichia coli strains. J Biosci Bioeng. 2014;117:336–342.
- Mahut M, Gargano A, Schuchnigg H, et al. Chemoaffinity material for plasmid DNA analysis by high-performance liquid chromatography with condition-dependent switching between isoform and topoisomer selectivity. Anal Chem. 2013;85:2913–2920.
- Urthaler J, Schuchnigg H, Garidel P, et al. Industrial manufacturing of plasmid-DNA products for gene vaccination and therapy. In: Thalhamer J, Weisss R, Scheiblhofer S, editors. Gene vaccines. New York: Springer-Verlag/Wein; 2012. p. 311–330.
- Tejeda-Mansir A, Montesinos RM. Upstream processing of plasmid DNA for vaccine and gene therapy applications. Recent Patents Biotechnol. 2008;2:156–172.
- Yang JL, Yang Y. Plasmid size can affect the ability of Escherichia coli to produce high-quality plasmids. Biotechnol Lett. 2012;34:2017–2022.
- Goncalves GA, Prather KLJ, Monteiro GA, et al. Plasmid DNA production with Escherichia coli GALG20, a pgi-gene knockout strain: fermentation strategies and impact on downstream processing. J Biotechnol. 2014;186:119–127.
- O'Kennedy RD, Ward JM, Keshavarz-Moore E. Effects of fermentation strategy on the characteristics of plasmid DNA production. Biotechnol Appl Biochem. 2003;37:83–90.
- Islas-Lugo F, Vega-Estrada J, Alvis CA, et al. Developing strategies to increase plasmid DNA production in Escherichia coli DH5 alpha using batch culture. J Biotechnol. 2016;233:66–73.
- Phue JN, Lee SJ, Trinh L, et al. Modified Escherichia coli B (BL21), a superior producer of plasmid DNA compared with Escherichia coli K (DH5alpha)). Biotechnol Bioeng. 2008;101:831–836.
- Silva F, Queiroz JA, Domingues FC. Plasmid DNA fermentation strategies: influence on plasmid stability and cell physiology. Appl Microbiol Biotechnol. 2012;93:2571–2580.
- Garcia-Rendon A, Munguia-Soto R, Montesinos-Cisneros RM, et al. Performance analysis of exponential-fed perfusion cultures for pDNA vaccines production. J Chem Technol Biotechnol. 2017;92:342–349.
- Bagnato G, Iulianelli A, Sanna A, et al. Glycerol production and transformation: a critical review with particular emphasis on glycerol reforming reaction for producing hydrogen in conventional and membrane reactors. Membranes. 2017;7:17–31.
- Grunzel P, Pilarek M, Steinbruck D, et al. Mini-scale cultivation method enables expeditious plasmid production in Escherichia coli. Biotechnol J. 2014;9:128–136.
- Sanchez-Casco M, Dumonteil E, Ortega-López J. Production optimisation of a DNA vaccine against leishmanaisis in flask culture. Afr J Biotechnol. 2013;12:4874–4880.
- Diogo MM, Queiroz JA, Prazeres DMF. Assessment of purity and quantification of plasmid DNA in process solutions using high-performance hydrophobic interaction chromatography. J Chromatogr A. 2003;998:109–117.
- Carnes AE. Fermentation design for manufacturing of therapeutic plasmid DNA. Bioprocess Int. 2005;3:36–42.
- Carnes AE, Williams JA. Plasmid fermentation process for DNA immunization applications. Methods Mol Biol. 2014;1143:197–217.
- Ruíz O, Pérez M, Pupo M, et al. High cell density culture to produce pDNA for gene therapy in E. coli. Biopharm Int. 2009;22:40–45.
- Carnes AE, Hodgson CP, Williams JA. Inducible Escherichia coli fermentation for increased plasmid DNA production. Biotechnol Appl Biochem. 2006;45:155–166.
- de Almeida A, Giordano AM, Nikel PI, et al. Effects of aeration on the synthesis of poly(3-hydroxybutyrate) from glycerol and glucose in recombinant Escherichia coli. Appl Environ Microbiol. 2010;76:2036–2040.
- Hempfling WP, Mainzer SE. Effects of varying the carbon source limiting growth on yield and maintenance characteristics of Escherichia coli in continuous culture. J Bacteriol. 1975;123:1076–1087.
- Koch V, Ruffer HM, Schugerl K, et al. Effect of antifoam agents on the medium and microbial cell properties and process performance in small and large reactors. Process Biochem. 1995;30:435–446.
- Morao A, Maia CI, da Fonseca MMR, et al. Effect of antifoam addition on gas-liquid mass transfer in stirred fermenters. Bioprocess Eng. 1999;20:165–172.