
Abstract
Melatonin (MEL) may influence the efficiency of reprogramming both by somatic cell nuclear transfer and by direct induction of pluripotent stem cells (iPSC) through a yet unidentified mechanism. Transcription factors linked to cell reprogramming and cell signalling may be differentially expressed according to cell differentiation status. To address the effect of MEL on the expression of transcription factors linked to reprogramming, we used two distinct in vitro models of cellular plasticity: human foreskin fibroblasts (HFF) and primary human granulosa-lutein cells (GLC). Real-time quantitative polymerase chain reaction (qRT-PCR) analysis revealed amplification of transcripts for KLF4, MYC and NANOG in both cell types. In GLC, treatment with 10 nmol/L of MEL provoked significant up-regulation of the expression of MYC and NANOG compared to controls. KLF4 expression was not altered in GLC but was significantly down-regulated in MEL-treated HFF cells. Alterations in the expression of ERK1/2 and pERK1/2 in GLC as analyzed by Western blot were not observed regardless of the MEL treatment. On the contrary, HFF cells responded to MEL treatment with 1.6-fold higher levels of pERK1/2 compared to the non-treated controls. Our data suggest that the activation of MT1 melatonin receptor is probably related to phosphorylation of ERK1/2 at least in expanding HFF, which subsequently may act to alter gene expression and regulate cell fate. In conclusion, we demonstrated for the first time, the selective effect of MEL in vitro at physiological concentration on transcription factors regulating pluripotency and differentiation in human non-cancer cells according to cell differentiation status.
Introduction
Cellular pluripotency is determined by the expression of small proteins. These include the products of the OCT4, SOX2, NANOG, SAL4, KLF4, and MYC genes, which encode transcription factors controlling the expression of a number of target genes as well as their own expression by a feedback mechanism [Citation1].
Transcription factors that are responsible for maintaining pluripotency of stem cells can also induce such condition in differentiated cells. This was achieved for the first time in 2006 when Takahashi and Yamanaka [Citation2] obtained the first induced pluripotent stem cells (iPSC) by introducing the expression of OCT4, SOX2, KLF4 and MYC in mouse fibroblasts. Reprogramming with the four factors of Yamanaka remains a standard in the production of iPSCs, but some small molecules and additional factors can increase the efficiency of the process or functionally replace some of the transcription factors used [Citation3,Citation4]. The pineal hormone melatonin (MEL) has been suggested to belong to this group due to its ability to improve the outcomes of stem cell therapy and preserve pluripotency of mesenchymal stem cells in vitro [Citation5]. Kumar et al. [Citation6] demonstrated that the incubation with MEL promoted colony formation in embryonic stem cells and maintained pluripotency. Other data indicated that MEL increased the efficiency of reprogramming both by somatic cell nuclear transfer (SCNT) [Citation7] and by direct induction of pluripotent stem cells (iPSC) [Citation8]. MEL was shown also to influence the pluripotency, proliferation and invasion properties of ovarian cancer stem cells by reducing the expression of SOX2 and NANOG [Citation9]. However, the precise action of the pineal hormone in cancer stem cells is yet to be clarified.
MEL is a small conservative hormone with pleiotropic physiological effects. There is plenty of evidence for its multiple functions: participation in circadian rhythms, positive effect on sleep, immune stimulation, blood pressure regulation, control on seasonal reproduction and anti-depressant action [Citation10]. The presence of high-affinity melatonin receptors (MR) in multiple cell types has been well-documented in many studies including ours [Citation11–13]. The different types of MRs display particular biochemical characteristics and the cell signalling response of ligand-stimulated cells may vary according to cell type and condition. Although MEL is widely studied, little is known about its role in cellular context as well as signalling mechanisms involved in many cell types.
Recent reports linking the activation of MRs to alterations in the extracellular signal-regulated (ERK) kinases signalling pathway [Citation14] have opened a new venue for research of its effects on cell metabolism, cell cycle and gene expression. ERKs are mainly stimulated by growth factors and have been shown to directly activate various transcription factors (c-Myc, c-Fos, Ets-1 and c-Jun), thus affecting the transcription of genes responsible for cell cycle regulation [Citation15].
Since MEL is an endogenous physiological regulator of the rest–activity cycle, it may be intimately involved in the control of cell growth, proliferation and differentiation. To address the unclarified molecular mechanisms behind its pleiotropic effect on cell fate, we studied the expression of transcription factors linked to cell reprogramming in two distinct cell types, human foreskin fibroblasts (HFF) and primary human granulosa-lutein cells (GLC), which both represent distinct in vitro models of cellular plasticity.
Material and methods
Cell cultures
Follicle aspirates were collected from healthy donors undergoing in vitro fertilization procedures due to male infertility factor at the IN VITRO Medical Center ‘Dimitrov’ (Sofia, Bulgaria) upon receipt of their informed consent.
The collected follicular fluid from one donor was centrifuged, washed in HAM’S F-10/0.1% bovine serum albumin (BSA), and then incubated for 2–3 min at 37 °С in the presence of 80 IU/mL hyaluronidase (Origio, Denmark). GLCs were isolated by Ficoll Plus gradient medium (GE Healthcare, USA) and culture incubated in Dulbecco’s Modified Eagle Medium (DMEM)/Ham’s F12 medium supplemented with 10% fetal calf serum (FCS, Cambrex, Belgium), 10,000 units penicillin and 10 mg/mL streptomycin in 0.9% NaCl (BioReagent, Germany) at density of 1 × 10⁶ cells/mL.
Aliquots of human fibroblast cell line HFF (NIDCR, NIH) were thawed and cells were cultured in DMEM (4.5 g/L glucose), 10% fetal bovine serum (FBS) with penicillin–streptomycin.
For the purpose of protein and gene expression analysis, the purified GLC and HFF cells (at approximately 80% confluence) were cultured for 24 h at 37 °C and 5% CO2 in the absence (vehicle) and presence of MEL in 10 nmol/L final concentration.
Ethics statement
Written informed consent was obtained from all donors. The study design was approved by the Ethics Committee at the IN VITRO Medical Center ‘Dimitrov’ (Sofia, Bulgaria).
Cell lysis
The GLC and HFF cell cultures were lysed in RIPA lysis buffer [150 mmol/L NaCl, 2 mmol/L ethylenediaminetetraacetic acid (EDTA), 1% Na deoxycholate, 0.1% sodium dodecyl sulfate (SDS), 1% Triton X-100, 10% glycerol and 50 mmol/L HEPES] with additional protease inhibitor cocktail (BioTool, Germany). Lysates were then centrifuged for 10 min at 14,000g and 4 °C. Supernatants were stored for further analysis at −80 °C until protein quantification by SDS–PAGE and Western blotting.
For gene expression analyses, cells were detached from the culture bottom using cell scrapers and pellets were stored at −80 °C until total RNA extraction was performed followed by reverse transcription and RT-qPCR.
Protein quantification, SDS–PAGE and Western blotting
Total protein amount in the cell lysates was measured according to Smith’s method [bicinchoninic acid assay (BCA)] using BSA as standard. All samples were incubated with BCA reagent (1:20) and the absorbance was measured at 562 nm with Epoch Microplate (BioTek Instruments, Inc.). The quantity of the total protein in all samples was equalized for further Western blotting analysis using 10 µg per each lane. SDS–PAGE and Western blotting were used to determine MT1, ERK1/2 and pERK1/2 expression. α-Tubulin served as a reference. Samples were run on 10% gels followed by wet transfer on nitrocellulose membranes. After blocking, membranes were incubated overnight at 4 °C with primary anti-human antibodies for MEL-1A-R (goat, sc-13179, Santa Cruz Biotechnology, Inc., USA), pERK1/2 (mouse, sc-7383, Santa Cruz Biotechnology, Inc., USA), ERK1/2 (rabbit, sc-94, Santa Cruz Biotechnology, Inc., USA) and α-tubulin (mouse, sc-5286, Santa Cruz Biotechnology, Inc., USA). Second antibodies included anti-goat, anti-rabbit and anti-mouse IgG-HRP and were all purchased from Santa Cruz Biotechnology, Inc. Signals were visualized using chemiluminescence detection/ECL (Western Blotting Luminol Reagent, Santa Cruz Biotechnology, Inc., USA) and Kodak Medical X-ray Film General Purpose Blue/E (Carestream Health, Inc., Canada). Signal intensity was finally processed using ImageJ software (Rasband, W.S., ImageJ, US National Institutes of Health, Bethesda, MA). All Western blots have been repeated independently three times. All the densitometry values for pERK1/2 were first divided by the corresponding ERK1/2 signal value and then normalized to α-tubulin. Statistical analyses were performed by applying a paired Student’s t-test using SPSS software (IBM, USA).
Total RNA isolation, reverse transcription and qPCR
Total RNA of HFF and GLCs was isolated using TRIzol Reagent (Invitrogen, USA) following the instructions of the manufacturer. The obtained RNA, precipitates were washed, dried and resuspended in ddH2O (RNAse-free). Samples were stored for further analysis at −80 °C. Concentration and purity of the isolated RNA were measured at 260 nm/280 nm using Epoch Microplate (BioTek Instruments, Inc., USA).
One microgram of total RNA was used for synthesis of cDNA. Reverse transcription was performed using Thermo Scientific RevertAid H Minus First Strand cDNA Synthesis Kit and Oligo(dT)18 primers according to the manufacturer’s instruction (Thermo Fisher Scientific Inc., USA). cDNAs were stored at −20 °C for further quantitative real-time PCR (RT-qPCR).
RT-qPCR experiments were performed on Stratagene MxPro 3000P using SYBR Green technique [Maxima SYBR Green qPCR Master Mix (Thermo Fisher Scientific Inc., USA)]. All primer pairs were designed with the help of PerlPrimer software (Marshall OJ, Australia). The primer sequences and the NCBI reference sequences are presented in . Amplification for RT-qPCR was performed for 40 cycles, each including 15 s at 95 °C, 30 s at 60 °C and 30 s at 72 °C, followed by dissociation curve analysis. The efficiency of the reactions for all primer pairs was between 97 and 118%. The gene expression level was normalized using β-actin as a reference gene. Experiments were performed in duplicates. All Ct values obtained were baseline and threshold value corrected and normalized to the reference dye ROX. Normalized gene expression ratio was assessed according to the 2−ΔΔCt-method. Experiments were repeated independently three times. Statistical differences were assessed using the Relative Expression Software Tool (REST, Qiagen, Germany) [Citation16].
Table 1. Primer sequences used for RT-qPCR and corresponding NCBI reference numbers.
Immunofluorescence
Indirect immunofluorescence was conducted on cells fixed in 4% PAF/PBS w/w/o 0.1% TX-100. MT1 melatonin receptors were visualized using primary anti-MEL-1A-R (goat, sc-13179, Santa Cruz), secondary donkey anti-goat IgG antibody conjugated with Cy3 (Abcam, ab6949, UK). Detection of P450 aromatase was performed with anti-P450arom primary antibody (rabbit, sc-30086, Santa Cruz Biotechnology, Inc., USA) and anti-mouse IgG antibody conjugated with Cy2. Cytoskeletal actin was visualized using Phalloidin-Atto 488 (Sigma-Aldrich, St. Louis, MO). Negative controls were incubated with 1.5% BSA/PBS instead of primary antibody and DAPI (10 μg/mL) was used to counterstain cell nuclei. The fluorescence signal was detected on Leica Confocal Microscope (Leica TCS SPE, Germany) and processed using Leica Application Suite Advanced Fluorescence software (LAS AF).
Statistics
Statistical analysis was performed using the Student’s t-test where applicable. The data are presented as mean values with standard deviation (x±SD). Statistically reliable difference was considered at p≤.05.
Results and discussion
Immunofluorescence
Specific immunofluorescence staining for MT1 melatonin receptor in cultured HFF and GLC revealed positive membrane cytoplasmic reaction in all cultures. In GLC, the signal was notably concentrated in the perinuclear area, whereas in HFF it appeared more filamentous. The reaction intensity in both cell types was significantly enhanced when cells were incubated in the presence of 10 nmol/L MEL for 24–48 h (). Actin filaments showed characteristic stress fibers () indicating intense spreading of HFF cells. Cultured GLC appeared with good adhesiveness, growth and intercellular contacts, vacuolated cytoplasm and numerous secretory granules labelled for P450arom, thus resembling typical luteinized granulosa cells ().
Figure 1. Immunofluorescence microscopy images of HFF cell line (A) and primary GLC culture isolated from human follicular fluid (B). Immunofluorescence signal for MT1 melatonin receptor in control (1) and cells incubated with 10 nmol/L melatonin for 24 h (2); visualization of actin filaments in HFF (3A); immunofluorescence staining of P450 aromatase in GLC (3B); detection of cell nuclei with DAPI (4). Note: Scale bar = 20 μm (63×, Leica CM).
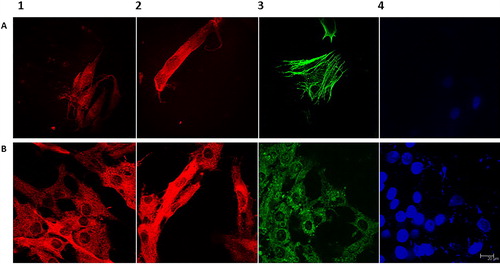
It is well-known that ligand-dependent activation of G-protein coupled receptors (GPCR) results in alteration of their sensitivity, which facilitates their ligands efficiency. Our data showing enhanced immunofluorescence signal after incubation with physiological dose of MEL in vitro would indicate intact MEL-dependent signalling mechanisms in both HFF and GLC.
Expression of KLF4, MYC and NANOG
To study the effect of MEL treatment on the gene expression of KLF4, MYC and NANOG in HFF and GLC, we used β-actin as a reference gene, which showed consistent expression in all samples. Data are presented in .
Figure 2. Influence of MEL on gene expression in HFF and GLC. Cells were treated for 24 h with 10 nmol/L MEL and the expression of the three genes was assessed by RT-qPCR. Control cells were cultured in medium without MEL. The normalized gene expression ratio was calculated according to the 2−ΔΔCt method using β-actin as a reference gene. Data are shown as median ± whiskers (three independent experiments, each in duplicate). Statistical differences between medians were assessed by using the ‘Relative Expression Software Tool’ (REST, Qiagen) [Citation19]. *Statistically significant differences versus control (p≤.05).
![Figure 2. Influence of MEL on gene expression in HFF and GLC. Cells were treated for 24 h with 10 nmol/L MEL and the expression of the three genes was assessed by RT-qPCR. Control cells were cultured in medium without MEL. The normalized gene expression ratio was calculated according to the 2−ΔΔCt method using β-actin as a reference gene. Data are shown as median ± whiskers (three independent experiments, each in duplicate). Statistical differences between medians were assessed by using the ‘Relative Expression Software Tool’ (REST, Qiagen) [Citation19]. *Statistically significant differences versus control (p≤.05).](/cms/asset/cd948b37-67ef-42d7-baca-9584e040ca52/tbeq_a_1571440_f0002_c.jpg)
The relative quantification of the data from the qRT-PCR analysis revealed amplification of transcripts for KLF4, MYC and NANOG. In the GLC samples, there was significant up-regulation of the expression of MYC (1.6-fold) and NANOG (2.5-fold) in the MEL-treated cultures compared to controls. No significant increase of the KLF4 expression was detected after treatment with MEL.
In HFF, the normalized results showed up-regulation of the MYC gene expression and down-regulation of KLF4 in the MEL-treated samples. Analysis showed statistically significant (p<.05) decrease of the NANOG expression in the MEL-treated samples compared to controls.
Fibroblasts showed higher expression of MYC after treatment with physiological concentrations of MEL for 24 h. Up-regulation of MYC was also observed in the MEL-treated GLC samples. In non-tumour cells, the transcription factor c-Myc is a mediator between growth factors and cell proliferation [Citation17–19]. As higher levels of c-Myc are typical for proliferating cells, we may hypothesize that MEL acts to stimulate normal cell growth and proliferation. This is supported by a recent study which shows that knockdown of MT1 promotes apoptosis and inhibits proliferation in mouse granulosa cells [Citation20]. Considering the circadian release of the pineal hormone under physiological conditions, it would be interesting to examine the expression of c-Myc after prolonged periods of in vitro stimulation with MEL to mimic cumulative alterations on cell cycle. It is known that higher levels of c-Myc are found in human carcinoma cells and are associated with tumour aggression and severe clinical prognosis. This transcription factor amplifies the expression of genes which are already active [Citation21]. The period of expression of c-Myc is also of significant importance. The prolonged c-Myc expression may block the cell arrest and differentiation [Citation22].
KLF4 gene expression was significantly down-regulated only in MEL-treated fibroblasts (HFF). It is known that KLF4 mRNA levels are higher in quiescent fibroblasts and almost undetectable in cells during exponential growth [Citation23]. Elevated levels of Klf4 after treatment with MEL has also been reported in embryonic stem-like cells from rabbit blastocysts [Citation24].
Together, these data indicate a stimulatory effect of in vitro MEL used at nanomolar dose on cell growth and proliferation. This can be indicative of an unknown regulatory effect of the pineal hormone on cell proliferation potential in non-differentiated cells. Yet, the expression of KLF4 in differentiated GLC was not different in the MEL-treated cells compared to vehicle controls.
We showed elevated levels of NANOG transcripts in GLC incubated with 10 nmol/L MEL, which is contrary to recent findings in ovarian cancer stem cells [Citation9], but in line with other reports showing enhanced expression of c-Myc and Nanog after MEL treatment [Citation24]. Up-regulation of NANOG expression by MEL in non-tumour ovarian GLC as demonstrated in the present study points out at the balancing role of the circadian hormone in a physiological context depending on cell type, period of exposure and dose applied. Considering the circadian nature of secretion of MEL and its role in mammalian reproduction, one can hypothesize that the hormone may be intimately involved in modulating the behaviour of follicular granulosa cells shaping the follicular development.
Protein expression of MT1, pERK1/2 and ERK1/2
The expression of MT1 receptor protein for MEL was confirmed by Western blot in lysates from GLC and HFF, both in control and experimental cell cultures treated with 10 nmol/L MEL. The densitometry analysis showed higher expression of MT1 in both cell types after 24 h of incubation with MEL compared to controls. The quantified higher receptor protein expression was especially higher in the HFF cultures where the increase was almost two fold after MEL treatment ().
Figure 3. Expression of MT1, pERK1 and ERK1 in HFF (A) and GLC (B). Cells were treated with 10 nmol/L MEL for 24 h and compared to vehicle controls. Representative Western blots and corresponding relative protein expression calculations were performed as described above. *Statistically significant differences versus control (p ≤ .05).
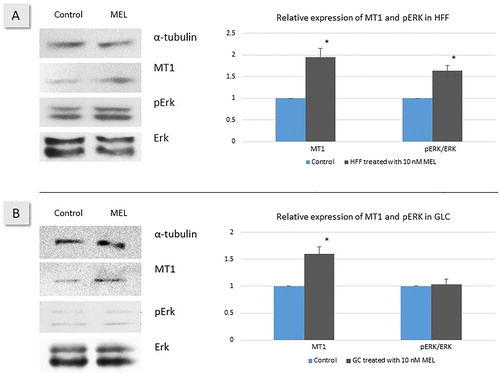
The expression of ERK1/2 was studied by Western blot in total cell lysates. The expression of pERK1/2 was very weak in human GLC but non-phosphorylated ERK1/2 showed strong expression. Western blots for ERK1/2 and pERK1/2 revealed no difference in GLC regardless of the MEL treatment ().
In contrast, the analysis of the signal obtained in HFF total cell lysates showed 1.6-fold higher level of the phosphorylated ERK1/2 at the account of the non-phosphorylated ERK1/2 in the MEL-treated cells compared to the vehicle group ().
It has been suggested that MEL may act on human GLC to regulate ovarian function via activation of the MAPK signalling pathway [Citation25]. Other authors also report that MEL may increase pERK1/2 levels in some cell lines, but not in others. Elevated expression of pERK1/2 after MEL stimulation has been observed in mt-CHO cell line, but not in neo-CHO or MT2-CHO [Citation11]. Our results also show different effect of MEL on pERK1/2 in HFF and GLC: MEL affected the levels of pERK1/2 in HFF cells. This is an indication that the MAPK signalling cascade is activated in the MEL-treated fibroblasts. The increase of pERK1/2 levels may trigger cell proliferation or differentiation, thus shaping cell growth according to the physiological context and the presence of other regulators [Citation26]. The different response of HFF and GLC to MEL in terms of ERK1/2 phosphorylation allows us to suggest that MEL may act differently according to cell type and cell differentiation status. GLC are presumably terminally differentiated cells, while fibroblasts are considered to possess a certain level of plasticity. Altogether, our data demonstrate the ability of in vitro MEL to influence the expression of transcription factors that are linked to cell cycle control in HFF fibroblasts and human GLCs. Activation of MT1, at least in fibroblasts, is probably related to phosphorylation of ERK1/2, which subsequently may act to alter gene expression and regulate cell proliferation and differentiation. The stimulation of pluripotency transcription factors like c-Myc and NANOG in GLC in our model deserves special attention and calls for further investigation of the role of the pineal hormone in the processes guiding cellular plasticity.
Conclusions
Our results showed that MEL applied at physiological dose in vitro was able to influence selectively the expression of transcription factor genes controlling cell proliferation and differentiation. The observed effect was related to modulation of the pERK1/2 levels at least in non-differentiated fibroblast cells. We identified possible MEL targets in the control of normal cell growth, proliferation and differentiation, which needs to be further investigated and clarified.
Disclosure statement
No potential conflict of interest was reported by the authors.
Funding
The work was supported by the Operational Programme “Science and Education for Smart Growth” 2014-2020, co-financed by the European Union through the European Structural and Investment Funds, Grant BG05M2OP001-2.009-0019-?01 from 02.06.2017.
Correction Statement
This article has been republished with minor changes. These changes do not impact the academic content of the article.
References
- Boyer LA, Lee TI, Cole MF, et al. Core transcriptional regulatory circuitry in human embryonic stem cells. Cell. 2005;122:947–956.
- Takahashi K, Yamanaka S. Induction of pluripotent stem cells from mouse embryonic and adult fibroblast cultures by defined factors. Cell. 2006;126:663–676.
- Huangfu D, Osafune K, Maehr R, et al. Induction of pluripotent stem cells from primary human fibroblasts with only Oct4 and Sox2. Nat Biotechnol. 2008;26:1269–1275.
- Zhang Y, Li W, Laurent T, et al. Small molecules, big roles - the chemical manipulation of stem cell fate and somatic cell reprogramming. J Cell Sci. 2012;125:5609–5620.
- Shuai Y, Liao L, Su X, et al. Melatonin treatment improves mesenchymal stem cells therapy by preserving stemness during long-term in vitro expansion. Theranostics. 2016;6:1899–1917.
- Kumar A, Kumar K, Singh R, et al. Effect of mitotic inducers and retinoic acid blocker on expression of pluripotent genes in ES cells derived from early stage in vitro-produced embryos in buffalo. In Vitro Cell Dev Biol Anim. 2012;48:625–632.
- Nakano M, Kato Y, Tsunoda Y. Effect of melatonin treatment on the developmental potential of parthenogenetic and somatic cell nuclear-transferred porcine oocytes in vitro. Zygote. 2012;20:199–207.
- Gao S, Wang Z-L, Di K-Q, et al. Melatonin improves the reprogramming efficiency of murine-induced pluripotent stem cells using a secondary inducible system. J Pineal Res. 2013;55:31–39.
- Akbarzadeh M, Movassaghpour AA, Ghanbari H, et al. The potential therapeutic effect of melatonin on human ovarian cancer by inhibition of invasion and migration of cancer stem cells. Sci Rep. 2017;7:17062.
- Dubocovich M, Markowska M. Functional MT1 and MT2 melatonin receptors in mammals. Endocrine. 2005;27:101–110.
- таushanova P, Georgiev G, Manchev S, et al. Effect of glucocorticoids on melatonin receptor expression under T-cell activated immune response. Compt Rend Acad Bulg Sci. 2007;60:899–902.
- Dimitrov R, Georgiev G, Todorov P, et al. Membrane melatonin receptor type MT1 expression in human ejaculated spermatozoa. Compt Rend Acad Bulg Sci. 2012;65:947–952.
- Tamura H, Takasaki A, Taketani T, et al. Melatonin as a free radical scavenger in the ovarian follicle. Endocr J. 2013;60:1–13.
- Witt-Enderby PA, MacKenzie RS, McKeon RM, et al. Melatonin induction of filamentous structures in non-neuronal cells that is dependent on expression of the human mt1 melatonin receptor. Cell Motil Cytoskeleton. 2000;46:28–42.
- Sethi S, Radio NM, Kotlarczyk MP, et al. Determination of the minimal melatonin exposure required to induce osteoblast differentiation from human mesenchymal stem cells and these effects on downstream signalling pathways. J Pineal Res. 2010;49:222–238.
- Pfaffl MW, Horgan GW, Dempfle L. Relative expression software tool (REST©) for group-wise comparison and statistical analysis of relative expression results in real-time PCR. Nucleic Acids Res. 2002;30:e36. [10 p.]
- Dang CV. MYC on the path to cancer. Cell. 2012;149:22–35.
- Eilers M, Eisenman RN. Myc’s broad reach. Genes Dev. 2008;22:2755–2766.
- Meyer N, Penn LZ. Reflecting on 25 years with MYC. Nat Rev Cancer. 2008;8:976–990.
- Talpur SH, Worku T, Rehman Z, et al. Knockdown of melatonin receptor 1 and induction of follicle-stimulating hormone on the regulation of mouse granulosa cell function. Reprod Biol. 2017;17:380–388.
- Lin CY, Lovén J, Rahl RB, et al. Transcriptional amplification in tumor cells with elevated c-Myc. Cell. 2012;151:56–67.
- Evan GI, Wyllie AH, Gilbert CS, et al. Induction of apoptosis in fibroblasts by c-myc protein. Cell. 1992;69:119–128.
- Shields JM, Christy RJ, Yang VW. Identification and characterization of a gene encoding a gut-enriched Krüppel-like factor expressed during growth arrest. J Biol Chem. 1996;271:20009–20017.
- Wei R, Zhao X, Hao H, et al. Embryonic stem-like cells from rabbit blastocysts cultured with melatonin could differentiate into three germ layers in vitro and in vivo. Mol Reprod Dev. 2016;83:1003–1014.
- Woo MMM, Tai CJ, Kang SK, et al. Direct action of melatonin in human granulosa-luteal cells. J Clin Endocrinol Metab. 2001;86:4789–4797.
- Qi M, Elion EA. MAP kinase pathways. J Cell Sci. 2005;118:3569–3572.