
 ?Mathematical formulae have been encoded as MathML and are displayed in this HTML version using MathJax in order to improve their display. Uncheck the box to turn MathJax off. This feature requires Javascript. Click on a formula to zoom.
Abstract
Although genome-wide association studies play an increasingly important role in identifying causes of complex diseases, detecting SNP epistasis in these studies is a computational challenge. The existing methods are usually based on a single-correlation model between SNP combinations and phenotype and their performance is often unsatisfactory. The highest average power of the existing methods is 0.58 on DME models and 0.97 on DNME models. The highest average F-measure of the existing methods is 0.44 on DME models and 0.90 on DNME models. The lowest average computation time (second) of the existing methods is 2.12 on DME models and 2.09 on DNME models. In this work, a novel multi-objective evolutionary algorithm named SEE is presented for identifying SNP epistasis. In SEE, eight evolution objectives are successfully integrated to measure the association between SNP combinations and phenotype. SEE uses a novel evolutionary strategy based on sort, exploration and exploitation. SEE was compared with other existing methods using 72 simulated datasets. The average power of SEE is 0.71 with DME models and 0.99 with DNME models. The average F-measure of SEE is 0.68 with DME models and 0.99 with DNME models. The average computation time of SEE is 0.21 with DME models and 0.40 with DNME models. It is indicated that SEE outperforms other algorithms in both F-measure and computation time. It was then utilized to analyze real data obtained from the Wellcome Trust Case Control Consortium. Availability and Implementation: SEE is freely available at https://github.com/sunliyan0000/SEE.
Introduction
Identifying genes responsible for Mendelian diseases has met great success, but it is still very challenging for non-Mendelian (complex) diseases [Citation1–3]. As the regulatory mechanism in the human genome is very complicated, complex diseases may be caused by multiple genetic variations instead of a single genetic variation. These multiple genetic variations may be not significantly associated with the complex diseases individually, but they may have strong association jointly. This phenomenon is referred to as epistasis [Citation4–8]. With the development of genome-wide single nucleotide polymorphism (SNP) genotyping technology, genome-wide association studies (GWAS) in which hundreds of thousands of SNPs of case samples and control samples are genotyped play an important role in identifying the causes of complex diseases[Citation9–14]. Recently, a number of methods have been proposed to identify multi-locus models (epistasis or SNP combinations) in GWAS As shown in , these approaches can generally be classified into five categories: exhaustive search, stochastic search, filter search, model search and evolution search.
Figure 1. Classification of algorithms for analyzing GWAS data.
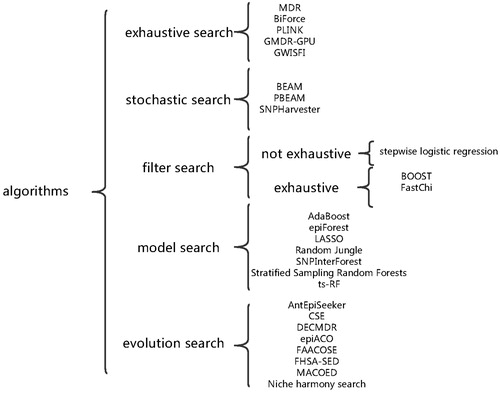
Exhaustive search [Citation15–17] enumerates all possible SNP combinations to identify significantly associated ones. It calculates a score for each SNP combination and then determines which SNP combinations are associated based on the threshold specified by the user. It requires tremendous computing resources while analyzing real GWAS data. For example, to detect two-locus models, it has to calculate 250 billion scores for a set of real GWAS data containing 500,000 SNPs. In order to analyze real GWAS data within an acceptable time, the exhaustive search method is always implemented on GPU or other parallel computing platforms [Citation18, Citation19].
Stochastic search [Citation20–22] detects associated SNP combinations via random sampling. Although the computation time is much shorter than that of exhaustive search, it depends heavily on the random seed. To improve the probability of identifying the associated SNP combination, it needs a large number of iterations, especially when there are millions of SNPs.
Filter search [Citation23–25] can be divided into two sub-categories: exhaustive and not exhaustive. The non-exhaustive search calculates a score for each SNP and then performs an exhaustive search on the SNPs whose scores are greater than a specified threshold. It performs poorly if the real associated SNPs have no marginal effects. The exhaustive filter search enumerates all possible SNP combinations as the exhaustive search does. Unlike the exhaustive search, the exhaustive filter search calculates a sample fast but not with a very accurate score for each combination. The complex and accurate analysis is then performed on the SNP combinations greater than the specified threshold. As the fast score greatly reduces the number of SNPs or SNP combinations on which the complex and accurate analysis has to be conducted, the computation time is lower. However, it is very difficult to design a reasonably fast score to remove SNPs or SNP combinations without mistakes. Filter search always performs poorly when the real associated SNPs do not affect the phenotype as expected by the author.
Model search [Citation26–32] builds a classification model based on GWAS data. The model utilizes SNPs to accurately classify samples to cases and controls. It assigns a score to each SNP according to its contribution in the classification. The SNPs which are greater than the specified threshold are returned as the significantly associated ones. However, the result of model search strongly depends on the construction process of building the model. While building the model, most of the classification algorithms tend to use variables with large marginal effects. Model search performs poorly in identifying SNPs without marginal effects.
Evolution search [Citation33–40] employs evolutionary algorithms, such as differential evolution (DE), harmony search (HS) and ant colony optimization (ACO), to find SNP combinations with higher scores (more associated with the phenotype). It always contains two parts: the evolutionary algorithm and the evaluation objective of the algorithm. The evolutionary algorithm reduces the time complexity of searching, and the objective determines which SNP combinations are better ones. How to design the two parts is the key of evolution search.
In this work, a novel evolution search algorithm is presented. Compared with previous algorithms, SEE mainly has the following advantages:
In order to better adapt to GWAS data, a novel evolutionary algorithm based on sort, exploration and exploitation is designed and implemented.
Exploration rate is introduced into the evolutionary algorithm to control the ways of generating a new individual.
Adjust operation is introduced into the evolutionary algorithm to improve the ability.
Eight evolution objectives are successfully integrated via the sort operation. The four of them are measures of the association between an SNP combination and the phenotype and the others are used to measure the epistasis.
To show the performance of SEE, we performed experiments on 72 simulated datasets. SEE was compared with BEAM [Citation20], DECMDR [Citation37], MACOED [Citation35], SNPHarvester [Citation22], SNPRuler [Citation41] and AntEpiSeeker [Citation33]. The results on simulated datasets indicate that SEE outperforms other existing algorithms in both F-measure and computation time. SEE was then utilized to analyze a real GWAS dataset which contains about 2000 individuals for each of seven major diseases and a shared set of about 3000 controls [Citation42]. Many genes and SNPs associated with the seven major diseases have been found.
Materials and methods
Hardware
All experiments were performed on a computation platform using a Windows system with 12G RAM and i3-3220 CPU.
Algorithm
In order to better adapt to detect epistatic interactions in GWAS, we designed a novel evolutionary algorithm called SEE. The algorithm is mainly composed of three parts: sort, exploration and exploitation. The pseudo code of the algorithm is shown below (Algorithm Citation1) and detailed descriptions are given in the subsequent subsections.++
Algorithm 1. SEE
1: initialize the tracing table.
2: //tracing is a hash table which records all calculated individuals.
3: initialize the population randomly.
4: calculate and sort the population.
5: insert individuals in the population into tracing.
6: calculate the exploration rate er.
7: the number of generation G = 0.
8: while termination criterion is not satisfied (e.g. G < maximum iterations) do
9: generate a random number ran [0, 1).
10: If ran < er then
11: generate a new individual using exploration.
12: else
13: generate a new individual using exploitation.
14: end if
15: adjust the new individual.
16: if adjust success then
17: calculate evaluation objectives for the adjusted individual.
18: insert the calculated individual into tracing
19: if the individual is useful then
20: replace the worst individual in the population with the adjusted individual.
21: sort the population.
22: update er.
23: end if
24: end if
25: G = G + 1
26: end while
27: generate the result.
Individual
In the SEE algorithm, an individual in the population is a vector. It is regarded as a feasible combination. Suppose n SNPs and l-way epistatic interaction detection in a case–control study. An individual in the population is represented by EquationEquation (1)(1)
(1) .
(1)
(1)
where I represents an individual; i represents the index of the individual in the population; G represents the generation number of the population; numPop represents the number of individuals in the population. The SEE algorithm starts with G = 0 and ends with G> =maxIter (a parameter specified by the user). f*,i,G represents a selected variable in the ith individual in the Gth generation. At initialization (i.e. G = 0), the elements in an individual are randomly selected from 0 to n, where n is the number of SNPs in the GWAS data.
Population
A population is made up of many (numPop) individuals. At initialization (i.e. G = 0), the population initializes all individuals randomly. As the algorithm runs and G increases, the individuals in the population are evolved towards better ones by exploration and exploitation.
Sort
In the SSE algorithm, sort operation is to sort the individuals in the population. Unlike other evolutionary algorithms, eight evaluation objectives are calculated simultaneously to measure an individual. They are ce, gini, k2, g, cec, ginic, k2c and gc. The first four objectives are used to measure the association between an individual and the phenotype. As four evaluation objectives from different fields are used while deciding the informative individuals, the population is more informative and the SSE algorithm has better performance [Citation35, Citation36, Citation38]. The latter four objectives are designed to measure the epistasis.
Conditional entropy (ce)
Mutual information (mi) is a measure of the mutual independence between two variables. It is widely used to measure the association between an SNP combination (I) and phenotype (Y). As shown in EquationEquation (2)(2)
(2) , since H(Y) (entropy of Y) remains unchanged in a set of GWAS data, ce is also appropriate to measure the association between I and Y. The smaller the value of ce, the more significant the association between I and Y is
(2)
(2)
where ce is one of the eight evaluation objectives used in SEE algorithm; mi is the mutual information of I and Y; I represents an individual (SNP combination); Y represents the phenotype; H represents the information entropy; C is the set of combinations of I with different values (the length of C is 3l as the possible value of an element in I is 0, 1 or 2 and l represents the length of I); S represents the set of phenotype values; p(s) represents the probability of samples where the SNP combination takes c and the phenotype takes s; p(c) represents the probability of samples where the SNP combination takes c; p(c,s) represents the probability of samples where the SNP combination takes c and the phenotype takes s.
Gini impurity (gini)
Gini impurity [Citation43] is used by the CART (classification and regression tree). It is a measure of how often a randomly chosen element from the set would be incorrectly labelled if it is randomly labelled according to the distribution of labels in the subset. It is often used in feature selection. As shown in EquationEquation (3)(3)
(3) , the difference between Gini(Y) and Gini(Y,I) is widely used to measure the association between Y and I. As Gini(Y) remains unchanged in a set of GWAS data, gini(Y|I) is also appropriate to be a measure of the association. The smaller the value of gini is, the more significant the association between I and Y is
(3)
(3)
where gini is one of the eight evaluation objectives used in SEE algorithm; I represents an individual (SNP combination); Y represents the phenotype; C is the set of combinations of I with different values; S represents the set of phenotype values; p(c) represents the probability of samples where the SNP combination takes c; p(s|c) represents the probability of samples where the phenotype takes s in samples where the SNP combination takes c.
Bayesian network scoring criterion (k2)
The Bayesian network scoring criterion is derived from the BN (the directed graphical model) [Citation44, Citation45]. In the GWAS BN, the genotypes and phenotypes are of nodes and their conditional dependences are edges. The k2 score is shown in EquationEquation (4)(4)
(4) . The smaller the value of k2, the more significant the association between I and Y is
(4)
(4)
where k2 is one of the eight evaluation objectives used in SEE algorithm; I represents an individual; Y represents the phenotype; C is the set of combinations of I with different values; S represents the set of phenotype values; SL represents the length of S; mc is the number of samples where the SNP combination takes c; mc,s is the number of samples where the SNP combination takes c and the phenotype takes s.
G-test p-value (g)
In statistics, G-tests are likelihood-ratio or maximum likelihood statistical significance tests that are increasingly being used in situations where chi-squared tests were previously recommended [Citation1, Citation46, Citation47]. The formula is shown in EquationEquation (5)(5)
(5) . Given the null hypothesis that I (SNP combination or individual) and Y (phenotype) are independent, the distribution of G-statistic is approximately a chi-squared distribution. The length of C minus 1 is the degrees of freedom. The p-value of the G-statistic is defined as g. The smaller the value of g, the more significant the association between I and Y is.
(5)
(5)
where g is one of the eight evaluation objectives used in the SEE algorithm, I represents an individual (SNP combination); Y represents the phenotype; C is the set of combinations of I with different values; S represents the set of phenotype values; mc is the number of samples where the SNP combination takes c; ms is the number of samples where the phenotype takes s; mc,s is the number of samples where the SNP combination takes c and the phenotype takes s; Ec,s is the expected number of samples where the SNP combination takes c and the phenotype takes s if the SNP combination and the phenotype are independent; pvalue_of represents the function to compute the p-value of the chi-square distribution.
Change of the evaluation objectives
In GWAS, an individual which has low ce, gini, k2 and g may not be an epistatic interaction, because it may contain an SNP which has a strong marginal effect. The strong SNP makes all its supersets (the SNP combinations which contain the strong SNP) strong. The phenomenon makes it difficult to find epistatic interactions if SNPs with strong margin effects are not removed. However, the epistatic interactions which contain a strong SNP will not be found, if the removal is performed.
To tackle this phenomenon, four objectives are designed. They are measures of the difference between an individual and its best element.
Change of ce (cec)
Change of ce is designed to measure the difference of ce between an individual and its best element which has the lowest ce in I. The formula is shown in EquationEquation (6)(6)
(6) . The smaller the value of cec, the more significant the epistatic interaction of I is
(6)
(6)
where cec is one of the eight evaluation objectives used in SEE algorithm; I represents an individual; Y represents the phenotype; E is the SNP which has the lowest ce in I.
Change of gini (ginic)
Change of gini is designed to measure the difference of gini between an individual and its best element which has the lowest gini in I. The formula is shown in EquationEquation (7)(7)
(7) . The smaller the value of ginic, the more significant the epistatic interaction of I is
(7)
(7)
where ginic is one of the eight evaluation objectives used in the SEE algorithm; I represents an individual; Y represents the phenotype; E is the SNP which has the lowest gini in I.
Change of k2 (k2c)
Change of k2 is designed to measure the difference of k2 between an individual and its best element which has the lowest k2 in I. The formula is shown in EquationEquation (8)(8)
(8) . The smaller the value of k2c, the more significant the epistatic interaction of I is
(8)
(8)
where k2c is one of the eight evaluation objectives used in the SEE algorithm; I represents an individual; Y represents the phenotype; E is the SNP which has the lowest k2 in I.
Change of g (gc)
Change of g is designed to measure the difference of g between an individual and its best element which has the lowest g in I. The formula is shown in EquationEquation (9)(9)
(9) . The smaller the value of gc, the more significant the epistatic interaction of I is
(9)
(9)
where gc is one of the eight evaluation objectives used in the SEE algorithm; I represents an individual; Y represents the phenotype; E is the SNP which has the lowest g in I.
Sort the population based on the eight evaluation objectives
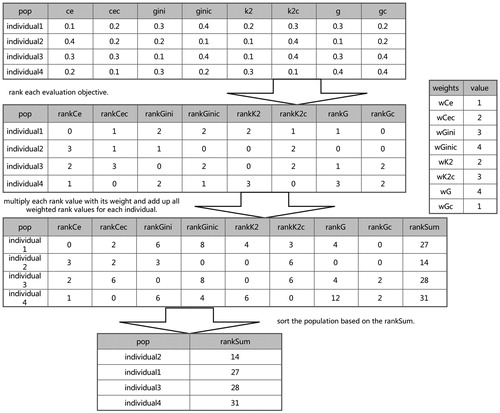
While multiple evaluation objectives are utilized, how to combine them is a common, difficult and interesting point. A number of methods have been tried [Citation35, Citation36, Citation38]. In this work, a novel approach to combine the objectives is designed. shows a description and an example of the sort operation. First, the values of the eight objectives for each individual in the population are calculated. Second, for each objective, the rank values are assigned for each individual. Third, each rank value is multiplied by its corresponding weight. The weights are the parameters which the SEE algorithm needs. The higher the weight is, the more important its corresponding objective is. Fourth, for each individual, eight weighted rank values are added up and each individual has a summed rank value as a combined objective. Fifth, the individuals in the population are sorted based on the sum of the weighted rank values from small to large. Individuals in the front are more associated with the phenotype than those in the back.
Figure 2. The description and an example of the sort operation. Suppose the objectives of the population are calculated and the values are shown as in the figure, the process of the sort operation is shown in the figure. The values of the eight objectives in the figure are not actual values, they are assigned for convenience of description. When the calculation of the eight objectives is completed, the rank value of each objective is calculated. The rank value of an individual is defined as the number of individuals which have a lower value of the objective than the individual. After that, each rank value is multiplied by its corresponding weight. Finally, the population is sorted based on the sum of the weighted rank values. This figure presents that individual2 is the most significant epistatic interaction in this population.
Exploration rate (er)
Any evolutionary algorithm should have two abilities. One is the ability to make the population converge, which can make the algorithm find the optimal solution. The other is the ability to make the population jump out of the local minimum, which can make the algorithm find the global optimal solution. In SEE, exploitation which has the first ability and exploration which has the second ability are designed. Exploitation is used when the population contains many species (SNPs). It tries to make full use of the information within the population to generate a better individual. Exploration is used when the population contains few species. It tries to introduce new species into the population. The exploration rate, shown in EquationEquation (10)(10)
(10) , is designed to determine the probability of calling the exploitation and exploration operations.
(10)
(10)
where er is the exploration rate SEE used; numSpecies is the number of SNPs (no duplication) in the population; numPop is the number of individuals in the population; pe is a parameter specified by the user.
Exploitation
The exploitation operation is used to make full use of the information within the population to generate a better individual. The pseudo code of exploitation is shown in Algorithm Citation2. Exploitation randomly selects two better individuals and does crossover on them (as the genetic algorithm does) to generate a new individual.
Algorithm 2. Exploitation
1: i1= min(rand(numPop), rand(numPop))
2: i2 = min(rand(numPop), rand(numPop))
3: //rand(num) is a function which returns a random integer in [0, num)
4: //min(a, b) is a function which returns the minimal number between a and b.
5: e = pop[i1]
6: i3 = rand(l)
7: i4 = rand(l)
8: e[i3] = pop[i2][i4]
9: return e as the new individual generated by exploitation.
Exploration
The exploration operation is used to introduce new species into the population. When few species are contained in the population, the population may be trapped in local minima and the probability of calling exploration should be increased. The pseudo code of exploration is shown in Algorithm Citation3. Exploration randomly selects a worse individual and generates a probability based on its position in the population. According to the probability, SEE randomly selects the way of introducing new species.
Algorithm 3. Exploration
1: i1 = max(rand(numPop), rand(numPop)).
2: //rand(num) is a function which returns a random integer in [0, num).
3: //max(a, b) is a function which returns the maximum between a and b.
4: generate a random number ran ∈ [0, 1)
5: if ran < i1/numPop then
6: randomly generate a new individual e.
7: else
8: e = pop[i1].
9: i2 = rand(l).
10: e[i2] = rand(n).
11: //n is the number of SNPs in the GWAS data and l is the number of SNPs in an individual.
12: end if
13: return e as the new individual generated by exploration.
Adjust
When exploitation or exploration is called, a new individual is generated. The elements in the individual are exchanged to satisfy the Inequality in EquationEquation (1)(1)
(1) . If the Inequality cannot be satisfied, because the individual contains two or more identical elements, the adjust operation is failed. When the Inequality is satisfied, SEE adjusts the new individual using the tracing table. If the individual has already been calculated, an adjust operation is performed to generate a new individual which is the nearest to it and has not been calculated. The adjust operation is shown in .
Figure 3. Description of the adjust operation. Suppose the length of the individual is 2 and the individual generated by exploitation or exploration is [3, 4]. In (b)–(d), F means that the individual is not feasible; x means that the individual has been calculated and o means the individual or individuals which the adjust operation may return. The adjust operation returns one individual marked as o. (a) The Manhattan distance between each feasible individual and [3, 4]. In (b), when [3, 4] has not been calculated, [3, 4] is the individual returned. In (c), when [3, 4] has been calculated, the individual which is nearest to [3, 4] and has not been calculated is [3, 5]. It is the individual returned. In (d), when [3, 4] has been calculated and its 1-near individuals have also been calculated, the individuals with a distance of 2 are nearest. One of them which has not been calculated is returned as the adjust individual. In the SEE algorithm and its software, stepInTable is the parameter which controls the maximum distance. If there is no individual for which the Manhattan distance is less than stepInTable and has not been calculated, the adjust operation will be failed.
![Figure 3. Description of the adjust operation. Suppose the length of the individual is 2 and the individual generated by exploitation or exploration is [3, 4]. In (b)–(d), F means that the individual is not feasible; x means that the individual has been calculated and o means the individual or individuals which the adjust operation may return. The adjust operation returns one individual marked as o. (a) The Manhattan distance between each feasible individual and [3, 4]. In (b), when [3, 4] has not been calculated, [3, 4] is the individual returned. In (c), when [3, 4] has been calculated, the individual which is nearest to [3, 4] and has not been calculated is [3, 5]. It is the individual returned. In (d), when [3, 4] has been calculated and its 1-near individuals have also been calculated, the individuals with a distance of 2 are nearest. One of them which has not been calculated is returned as the adjust individual. In the SEE algorithm and its software, stepInTable is the parameter which controls the maximum distance. If there is no individual for which the Manhattan distance is less than stepInTable and has not been calculated, the adjust operation will be failed.](/cms/asset/6f4a8e34-3550-4e37-aa7c-bb33032196f2/tbeq_a_1593052_f0003_b.jpg)
The description in is very well understood, but it needs too much memory. In order to run SEE on a common computation platform, the pseudo code shown in Algorithm Citation4 is the implementation of . It is more complex but requires much less memory.
Algorithm 4. Adjust
1: the input individual is x.
2: the length of x is l.
3: n is the number of SNPS.
4: stepInTable is the parameter specified by users.
5: tracing is a set containing all calculated individuals.
6: waiting1 and waiting0 are empty queues.
7: if x contains two or more identical elements then
8: return adjust failed.
9: else
10: if x is not in tracing then
11: return x as the adjusted individual.
12: else
13: insert x to waitingl.
14: insert x to waiting0.
15: for ii = 0 → stepInTable − 1 do
16: if waiting1 is not empty then
17: get an individual from waiting1 as x.
18: if x is not in tracing then
19: clear waiting1 and waiting0.
20: return x as the adjusted individual.
21: else
22: for i = 0 → l − 1) do
23: xx = x
24: xx[i] = xx[i] + 1
25: if xx[i] [0, n) then
26: if (i== 0 − 1 and xx[i] > xx[i − 1] ) or (i == 0 and xx[i] < xx[i + 1]) or (xx[i] > xx[i − 1] and xx[i] < xx[i + 1]) then
27: insert xx to waiting1.
28: end if
29: end if
30: end for
31: end if
32: end if
33: if waiting0 is not empty then
34: get an individual from waiting0 as x.
35: if x is not in tracing then
36: clear waitingl and waiting0.
37: return x as the adjusted individual.
38: else
39: for i = 0→l − 1) do
40: xx = x
41: xx[i] = xx[i] − 1
42: if xx[i] [0, n) then
43: if (i == 0 − 1 and xx[i] > xx[i − 1] ) or (i == 0 and xx[i] < xx[i + 1]) or (xx[i] > xx[i − 1] and xx[i] < xx[i + 1]) then
44: insert xx to waiting0.
45: end if
46: end if
47: end for
48: end if
49: end if
50: end for
51: return adjust failed.
52: end if
53: end if
Useful individual
When the adjusted individual is calculated, whether to update the population should be decided. In each generation, eight variables are maintained. They are maxCe, maxCec, maxGini, maxGinic, maxK2, maxK2c, maxG and maxGc. Each of them is the maximum value of the corresponding evaluation objective in the population. If anyone value of the adjusted individual’s eight objectives is less than its corresponding maximum value, the worst individual in the population should be replaced with the adjusted individual.
Generate result
In the SEE algorithm, eight parameters are provided to control the result. They are cCe, cCec, cGini, cGinic, cK2, cK2c, cG and cGc. They are the thresholds of ce, cec, gini, ginic, k2, k2c, g and gc. When the termination criterion is satisfied, the individuals in the population are checked by the thresholds. The generated results only contain individuals whose evolution objectives are all less than or equal to the corresponding thresholds. In addition, rn is the parameter that controls the number of individuals in the result. The pseudo code is shown in Algorithm Citation5.
Algorithm 5. Generate result
1: pop is the population when the termination criterion is satisfied.
2: numPop is the number of individuals in the pop.
3: cCe,cCec,cGini,cGinic,cK2,cK2c,cG,cGc are the thresholds of the eight evaluation objectives specified by user.
4: rn is the parameter that controls the number of individuals in the result.
5: j = 0
6: initialize r as an empty set.
7: for i = 0 → numPOP − 1 do
8: x = pop[i]
9: if x.ce < = cCe and x.cec < = cCec and x.gini < = cGinic and x.ginic < = cGinic and x.k2 < = cK2 and x.k2c < = cK2c and x.g < = cG and x.gc < = cGc and (rn < = 0 or j < rn) then
10: insert x into r.
11: j = j + 1
12: end if
13: end for
14: return r as the result.
Results and discussion
Experiments on simulated data
In the experiments on simulated data, the common goal was to detect the specific two-locus SNP combination (target) in each artefact epistasis model. The disease loci with and without marginal effects were used to test BEAM, DECMDR, MACOED, SNPHarvester, SNPRuler, AntEpiSeeker and SEE. The types of software used in this work are listed in .
Table 1. Software used in this study.
Simulated datasets
In this work, two different types of epistasis models commonly used in generating simulated datasets are presented: the DME model (disease loci with marginal effects) and the DNME model (disease loci without marginal effects).
Twelve DME models were obtained from MACOED [Citation35] and 60 DNME models from DECMDR [Citation37]. To study the effects of the algorithm, 100 datasets (files) were generated for each model (penetrance table), with each dataset containing 100 SNPs and 1600 samples (800 cases and 800 controls). All datasets were simulated by the software GAMETES_2.1. In each simulated dataset, the SNPs in the last two columns were the disease associated ones. In order to eliminate the effect of the location, two columns were randomly selected to swap places with the last two columns before a simulated dataset was analyzed. The detailed description of the simulated datasets is given in the Supplementary Appendix and the penetrance tables are provided in Supplemental Table S1.
Evaluation criteria
In order to evaluate the performance of the epistasis-learning algorithm, the power and F-measure were utilized as the evaluation criterion simultaneously. They are defined as EquationEquation (11)(11)
(11) . Power is a traditional evaluation criterion in GWAS. F-measure, recall and precision are commonly used in the pattern recognition field. F-measure is the harmonic mean of precision and recall. It is chosen as the second evaluation criteria. In this work, when a piece of software returns some SNP combinations as the result, true positive is the number of true disease-associated SNP combinations among them, and false positive is the number of false disease-associated SNP combinations among them. The true positive is always 1 or 0, because each dataset only contains one disease-associated SNP combination. In addition, the computation times of the seven types of software on the simulated datasets were compared.
(11)
(11)
where power and F-measure are two criteria used in this work. #(S) is the number of datasets in which the disease-specific two-locus SNP combination is successfully identified among all 100 datasets generated by the same parameters and penetrance table; TP represents the true positives; FP represents the false positives and FN represents the false negatives.
Comparison of SEE with existing methods on disease loci with marginal effects
In this experiment, we compared SEE with six other existing methods, including BEAM, DECMDR, MACOED, SNPHarvester, SNPRuler and AntEpiSeeker. The parameters were set as shown in . For each DME model and method, 100 data files were analyzed and the evaluation criteria were calculated as EquationEquation (11)(11)
(11) .
Table 2. Parameter settings in DME.
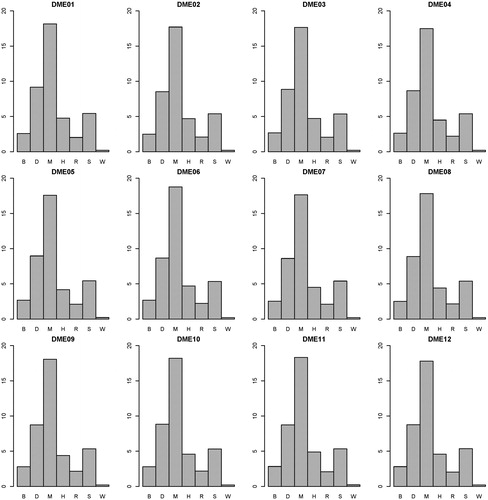
presents the power performance comparisons on the DME models. SEE outperforms the other methods on most of the DME models. On DME 01-04, because the genetic heritability is too low (0.005), distinguishing between the associated SNP combination and unassociated ones is very difficult. SNPRuler and AntEpiSeeker return many unassociated ones as a result, so they perform well on DME01-04. With the increase of the genetic heritability (0.02 on DME05-12), SEE performs better on power. With the DME models, the highest average power of the other six methods is 0.58 (generated by AntEpiSeeker). The average power of SEE is 0.71. presents the F-measure performance comparisons on the DME models. SEE outperforms the others with all DME models, except for DME04. The highest average F-measure of the other six methods is 0.44 (generated by DECMDR). The average F-measure of SEE is 0.68. presents the computation time comparisons on the DME models. SEE outperforms the others with all DME models. The lowest average computation time of the other six methods is 2.12 (generated by SNPRuler). The average computation time of SEE is 0.21. The detailed experiment results are shown in Supplemental Tables S2–S4. It is indicated that with DME models, SEE outperforms other existing methods on power, F-measure and computation time.
Figure 4. Power performance comparisons between BEAM (B), DECMDR (D), MACOED (M), SNPHarvester (H), SNPRuler (R), AntEpiSeeker (S) and SEE (W) with the 12 DME models. For each DME model, the power is calculated as shown in EquationEquation (11)(11)
(11) . The absence of bars indicates zero power.
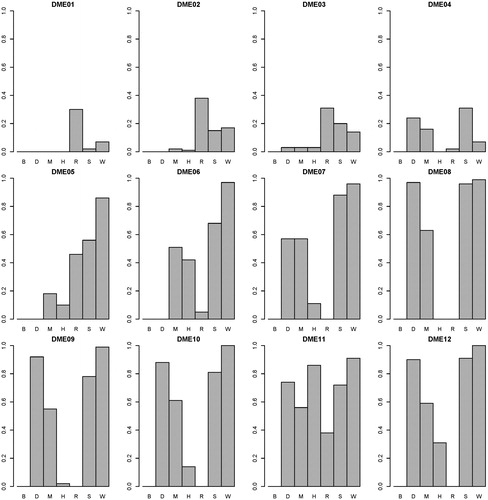
Figure 5. F-measure comparisons between BEAM (B), DECMDR (D), MACOED (M), SNPHarvester (H), SNPRuler (R), AntEpiSeeker (S) and SEE (W) with the 12 DME models. For each DME model, the F-measure is calculated as shown in EquationEquation (11)(11)
(11) . The absence of bars indicates zero F-measure.
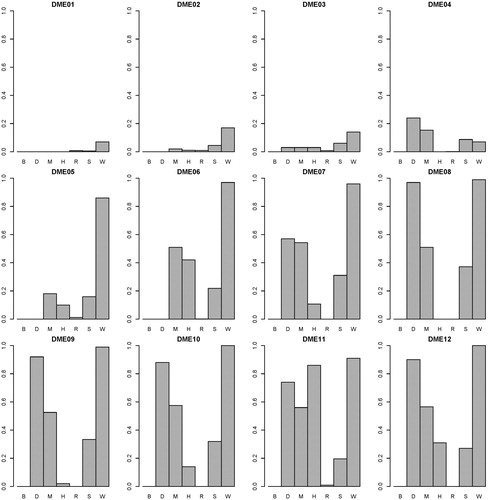
Figure 6. Computation time (second) comparisons between BEAM (B), DECMDR (D), MACOED (M), SNPHarvester (H), SNPRuler (R), AntEpiSeeker (S) and SEE (W) with the 12 DME models. For each DME model, the computation time is the average of that on the 100 datasets of the model.
Comparison of SEE with existing methods on disease loci without marginal effects
In this experiment, we compared SEE with six other existing methods, including BEAM, DECMDR, MACOED, SNPHarvester, SNPRuler and AntEpiSeeker. The parameters were set as shown in . As the DNME models belong to pure epistatic models and the population of any evolutionary algorithms has less information to utilize, the max iteration on these models was set higher than that on the DME models. For the same reason, the pe of SEE was set higher to increase the probability of calling exploration on the DNME models. For each DNME model and method, 100 data files were analyzed and the evaluation criteria were calculated as EquationEquation (11)(11)
(11) .
Table 3. Parameter settings in DNME.
Figure S1 in the Supplementary Appendix presents the power performance comparisons on the DNME models. SEE outperforms the other methods on all DNME models. The highest average power of the other six methods is 0.97 (generated by SNPRuler). The average power of SEE is 0.99. presents the F-measure performance comparisons on the DNME models. SEE outperforms the others on all DNME models. The highest average F-measure of the other six methods is 0.90 (generated by MACOED). The average F-measure of SEE is 0.99. Figure S2 in the Supplementary Appendix presents the computation time comparisons on the DNME models. SEE outperforms the others on all DNME models. The lowest average computation time of the other six methods is 2.09 (generated by SNPRuler). The average computation time of SEE is 0.40. The detailed experiment results are shown in Supplemental Tables S2–S4. It is indicated that on DNME models, SEE outperforms other existing methods on power, F-measure and computation time.
Figure 7. F-measure comparisons between BEAM (B), DECMDR (D), MACOED (M), SNPHarvester (H), SNPRuler (R), AntEpiSeeker (S), SEE (W) on the 60 DNME models. For each DNME model, the F-measure is calculated as shown in EquationEquation (11)(11)
(11) . The absence of bars indicates zero F-measure.
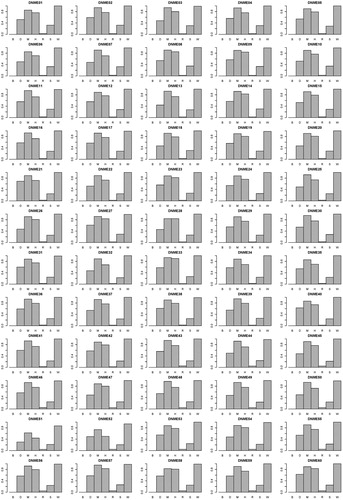
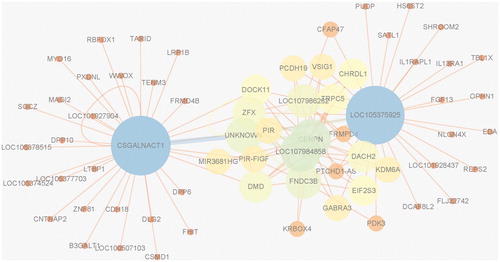
Figure 8. Gene network based on the result for bipolar disorder. Each vertex represents a gene which contains some SNPs. The vertex whose degree is larger is bigger. Each edge between two genes means that at least k SNP combinations of these two genes appear in the result for the bipolar disorder GWAS data. For the readability of the network, k is set to 4 in bipolar disorder. The network indicates that CSGALNACT1, LOC105375925, LOC107984858, CENPN etc. play a very important role in bipolar disorder. The other six networks are shown in Figures S4–S9 of the Supplementary Appendix.
Experiments on real data
As shown in the results on simulated data, SEE has good performance. SEE was then utilized to conduct experiments on a real dataset obtained from the Wellcome Trust Case Control Consortium (WTCCC) [Citation42] which had about 2000 individuals examined for each of seven major diseases and a shared set of about 3000 controls. After removing the SNPs and samples recommended by WTCCC and combining each dataset of diseases with the shared dataset of controls, seven GWAS datasets were generated. For each of them, SNPs which were unchanged in all samples were removed. Refer to Supplemental Tables S5–S7 for a more detailed description of the seven real GWAS datasets.
As shown in , the SNPs found by SEE were mapped to genes based on the NCBI database [Citation48]. The genes were then searched in the CTD database (Comparative Toxicogenomics Database) [Citation49]. A lot of genes which had DE (Direct Evidence) or NDE (Not Direct Evidence) association with the corresponding disease were found.
Table 4. PartTable Footnotea of the SEE results for seven diseases in the WTCCC dataset.
As shown in , in order to improve the readability of the results, after mapping SNPs to genes, CytoScape [Citation50] was utilized to make networks based on the gene combinations found by SEE. indicates that CSGALNACT1, LOC105375925, LOC107984858, CENPN etc. play a very important role in bipolar disorder. More details are shown in Figures S3–S9 of the Supplementary Appendix. It is indicated that CACNG1, CELF4, PNLIPRP3, CSGALNACT1 etc. play a key role in coronary artery disease. LDB2, LOC107986262, SMG1P5 and RRP15 etc. play an important role in Crohn's disease. LOC101929163, C6orf10, CACNG1, FRMPD4 etc. play an important role in rheumatoid arthritis. LOC101929163, C6orf10, GPSM3, NOTCH4 etc. have a key role in type 1 diabetes. HTR3B, KIAA1671, CSGALNACT1 and C4orf50 etc. are important role in type 2 diabetes.
Comparison of the methods
BEAM and SNPHaverster both belong to the category of stochastic search. As shown in the experiments on simulated data, SNPHavester is much better than BEAM.
SNPRuler is an exhaustive filter search method, it is claimed that SNPRuler cannot perform well on DNME models. However, in the experiments on DNME models, SNPRuler performs better than most of the others on power. On F-measure, SNPRuler performs poorly.
DECMDR, MACOED, AntEpiSeeker and SEE all belong to the category of evolution search. MACOED and AntEpiSeeker both utilize ACO (ant colony optimization) to search the SNP combinations. The optimization algorithm of DECMDR is DE (differential evolution). The optimization algorithm of SEE is designed by us for detecting SNP combinations. On real GWAS data, the table in ACO to record the pheromone of each SNP pair is too large to store in the memory of a common computation platform. DECMDR and SEE use less memory in optimization. In addition, SEE utilizes a boolean representation of genotype data to store the GWAS data as BOOST does, so the memory it needs is very small. While calculating the eight evaluation objectives, the contingency table is collected by the boolean operation. The computation time of SEE is the lowest among the algorithms. DECMDR utilizes only MDR as the evaluation objective. MDR is a traditional measure of the association of the SNP combination and the phenotype. However, MDR is highly dependent on the random seed (how to divide the samples into folds). The MDR value varies, sometimes very much, when the random seed is changed. AntEpiSeeker uses the chi-square test to measure the SNP combination. MACOED uses logistic regression and BN (similar to k2) as the objective in ACO, and then the chi-square test is conducted. As logistic regression is very time consuming, the computation time of MACOED is the highest among the algorithms. Although SEE calculates eight evaluation objectives for each SNP combination, because of the boolean operation, the calculation is very fast. As eight evaluation objectives are utilized to measure an SNP combination, the population in SEE is more informative and less generation is needed to detect the right SNP combination. The latter four evaluation objectives are designed by us to distinguish real epistasis SNP combinations from the combinations which contain a very associated SNP.
The advantages of SEE
SEE has higher power and F-measure. As eight evaluation objectives are utilized simultaneously, the power of SEE is higher. When generating a new SNP combination by SEE, there is more information to utilize in the population. The adjust operation in SEE also increases the power for detecting SNP combinations. SEE can distinguish real epistasis SNP combinations from the combinations which contain a very associated SNP.
SEE needs much less memory. As the GWAS data are stored by boolean representation, they take up much less memory than most other existing methods. SEE needs only about 1 GB memory while analyzing the GWAS data which contains about 4000 samples and 500,000 SNPs. Unlike most other methods, it can perform data analysis steadily on most computing platforms.
SEE is very fast. As SEE is written in C++ and takes advantage of boolean operation greatly, the computation time of SEE is very low.
The limitations of SEE
Although the code of SEE has been optimized again and again, the sort operation is still very time consuming. Another method should be designed to combine multiple evaluation objectives.
Conclusions
In this paper, we propose a novel algorithm called SEE for identifying SNP epistasis in genome-wide association studies. It is successfully designed to combine eight evolution objectives and a newly designed evolutionary algorithm. It was assessed through comparison with six other existing approaches on 72 simulated datasets. It is indicated that SEE is powerful to handle GWAS data both in terms of F-measure and computation time. We then utilized it to analyze real data obtained from the Wellcome Trust Case Control Consortium. A lot of disease-associated SNPs and genes (reported or not on CTD database) has been found. The results may be helpful to further explain the seven diseases. We believe that SEE will be widely used in GWAS.
Disclosure statement
No potential conflict of interest was reported by the authors.
Funding
This work was supported by the National Nature Science Foundation of China [grant numbers 61772226, 61373051, 61502343]; Science and Technology Development Program of Jilin Province [grant number 20140204004GX]; Science Research Funds for the Guangxi Universities [grant number KY2015ZD122]; Science Research Funds for the Wuzhou University [grant number 2014A002]; Project of Science and Technology Innovation Platform of Computing and Software Science (985 Engineering); Key Laboratory for Symbol Computation and Knowledge Engineering of the National Education Ministry of China; Fundamental Research Funds for the Central.
Related Research Data
References
- Collins A, Lonjou C, Morton N. Genetic epidemiology of single-nucleotide polymorphisms. Proc Natl Acad Sci USA. 1999;96:15173–15177.
- Schork NJ, Fallin D, Lanchbury JS. Single nucleotide polymorphisms and the future of genetic epidemiology. Clin Genet. 2001;58:250–264.
- Schork NJ, Murray SS, Frazer KA, et al. Common vs. rare allele hypotheses for complex diseases. Curr Opin Genet Dev. 2009;19:212–219.
- Cordell HJ. Epistasis: what it means, what it doesn't mean, and statistical methods to detect it in humans. Hum Mol Genet. 2002;11:2463–2468.
- Cordell HJ. Detecting gene–gene interactions that underlie human diseases. Nat Rev Genet. 2009;10:392–404.
- Shang J, Zhang J, Yan S, et al. Performance analysis of novel methods for detecting epistasis. BMC Bioinform. 2011;12:475.
- Wei WH, Hemani G, Haley CS. Detecting epistasis in human complex traits. Nat Rev Genet. 2014;15:722–733.
- Mackay TF, Moore JH. Why epistasis is important for tackling complex human disease genetics. Genome Med. 2014;6:42.
- Hirschhorn JN, Daly MJ. Genome-wide association studies for common diseases and complex traits. Nat Rev Genet. 2005;6:95–108.
- Pearson TA, Manolio TA. How to interpret a genome-wide association study. JAMA. 2008;299:1335–1344.
- Manolio TA. Genomewide association studies and assessment of the risk of disease. N Engl J Med. 2010;363:166–176.
- Li J, Humphreys K, Darabi H, et al. A genome-wide association scan on estrogen receptor-negative breast cancer. Breast Cancer Res. 2010;12:R93.
- Shan J, Mahfoudh W, Dsouza SP, et al. Genome-Wide Association Studies (GWAS) breast cancer susceptibility loci in Arabs: susceptibility and prognostic implications in Tunisians. Breast Cancer Res Treat. 2012;135:715–724.
- Chen F, Chen GK, Stram DO, et al. A genome-wide association study of breast cancer in women of African ancestry. Hum Genet. 2013;132:39–48.
- Ritchie MD, Hahn LW, Roodi N, et al. Multifactor-dimensionality reduction reveals high-order interactions among estrogen-metabolism genes in sporadic breast cancer. Am J Hum Genet. 2001;69:138–147.
- Purcell S, Neale B, Todd-Brown K, et al. PLINK: a tool set for whole-genome association and population-based linkage analyses. Am J Hum Genet. 2007;81:559–575.
- Gyenesei A, Moody J, Laiho A, et al. BiForce Toolbox: powerful high-throughput computational analysis of gene–gene interactions in genome-wide association studies. Nucleic Acids Res. 2012;40: 628–632.
- Zhu Z, Tong X, Zhu Z, et al. Development of GMDR-GPU for gene-gene interaction analysis and its application to WTCCC GWAS data for type 2 diabetes. PLoS One. 2013;8:e61943.
- Wang Q, Shi F, Kowalczyk A, et al., editors. GWISFI: a universal GPU interface for exhaustive search of pairwise interactions in case-control GWAS in minutes. In: IEEE International Conference on Bioinformatics and Biomedicine; 2014 Nov 2–5; Belfast, UK; 2014. p. 403–409.
- Zhang Y, Liu JS. Bayesian inference of epistatic interactions in case-control studies. Nat Genet. 2007;39:1167–1173.
- Peng T, Du P, Li Y. PBEAM: a parallel implementation of BEAM for genome-wide inference of epistatic interactions. Bioinformation. 2009;3:349–351.
- Yang C, He Z, Wan X, et al. SNPHarvester: a filtering-based approach for detecting epistatic interactions in genome-wide association studies. Bioinformatics. 2009;25:504–511.
- Marchini J, Donnelly P, Cardon LR. Genome-wide strategies for detecting multiple loci that influence complex diseases. Nat Genet. 2005;37:413–417.
- Zhang X, Zou F, Wang W, et al. FastChi: an efficient algorithm for analyzing gene-gene interactions. In: Altman RB, Dunker AK, Hunter L, editors. Pacific Symposium on Biocomputing 2009; 2009 Jan 5–9; Kohala Coast, Hawaii, USA. Stanford University; 2009. p. 528–539. Available from: http://psb.stanford.edu/psb-online/proceedings/psb09/.
- Wan X, Yang C, Yang Q, et al. BOOST: a fast approach to detecting gene-gene interactions in genome-wide case-control studies. Am J Hum Genet. 2010;87:325–340.
- Jiang R, Tang W, Wu X, et al. A random forest approach to the detection of epistatic interactions in case-control studies. BMC Bioinform. 2009;10:1–12.
- Wu TT, Chen YF, Hastie T, et al. Genome-wide association analysis by lasso penalized logistic regression. Bioinformatics. 2009;25:714–721.
- Schwarz DF, König IR, Ziegler A. On safari to Random Jungle: a fast implementation of random forests for high-dimensional data. Bioinformatics. 2010;26:1752–1758.
- Yoshida M, Koike A. SNPInterForest: a new method for detecting epistatic interactions. BMC Bioinform. 2011;12:469.
- Li J, Horstman B, Chen Y. Detecting epistatic effects in association studies at a genomic level based on an ensemble approach. Bioinformatics. 2011;27:i222–i229.
- Wu Q, Ye Y, Liu Y, et al. SNP selection and classification of genome-wide SNP data using stratified sampling random forests. IEEE Transon Nanobiosci. 2012;11:216–227.
- Nguyen TT, Huang JZ, Wu Q, et al. Genome-wide association data classification and SNPs selection using two-stage quality-based random forests. BMC Genomics. 2015;16:S5.
- Wang Y, Liu X, Robbins K, et al. AntEpiSeeker: detecting epistatic interactions for case-control studies using a two-stage ant colony optimization algorithm. BMC Res Notes. 2010;3:117.
- Aflakparast M, Salimi H, Gerami A, et al. Cuckoo search epistasis: a new method for exploring significant genetic interactions. Heredity. 2014;112:666–674.
- Jing P-J, Shen H-B. MACOED: a multi-objective ant colony optimization algorithm for SNP epistasis detection in genome-wide association studies. Bioinformatics. 2014;31:634–641.
- Tuo S, Zhang J, Yuan X, et al. FHSA-SED: two-locus model detection for genome-wide association study with harmony search algorithm. PLoS One. 2016;11:e0150669.
- Yang CH, Chuang LY, Lin YD. CMDR based differential evolution identify the epistatic interaction in genome-wide association studies. Bioinformatics. 2017;33:2354–2362.
- Sun Y, Shang J, Liu JX, et al. epiACO – a method for identifying epistasis based on ant colony optimization algorithm. Biodata Min. 2017;10:23.
- Yuan L, Yuan CA, Huang DS. FAACOSE: a fast adaptive ant colony optimization algorithm for detecting SNP epistasis. Complexity. 2017;2017:1–10.
- Tuo S, Zhang J, Yuan X, et al. Niche harmony search algorithm for detecting complex disease associated high-order SNP combinations. Sci Rep. 2017;7:11529.
- Wan X, Yang C, Yang Q, et al. Predictive rule inference for epistatic interaction detection in genome-wide association studies. Bioinformatics. 2010;26:30–37.
- Burton PR, Clayton DG, Cardon LR, et al. Genome-wide association study of 14,000 cases of seven common diseases and 3,000 shared controls. Nature. 2007;447:661–678.
- Breiman L. Classification and regression trees. New York (NY): Routledge; 1984.
- Visweswaran S, Wong AKI, Barmada MM. A Bayesian method for identifying genetic interactions. AMIA Annu Symp Proc/AMIA Symp AMIA Symp. 2009;2009:673–677.
- Cooper GF, Herskovits E. A Bayesian method for the induction of probabilistic networks from data. Mach Learn. 1992;9:309–347.
- Hoey J. The two-way likelihood ratio (G) test and comparison to two-way chi squared test; 2012. (arXiv preprint arXiv:12064881).
- Stamatis DH. Essential statistical concepts for the quality professional. Boca Raton (FL): CRC Press; 2012.
- Sherry ST, Ward MH, Kholodov M, et al. dbSNP: the NCBI database of genetic variation. Nucleic Acids Res. 2001;29:308–311.
- Peter DA, Grondin MC, Robin J, et al. The Comparative Toxicogenomics Database: update 2013. Nucleic Acids Res. 2011;41:D1104–D1114.
- Kohl M, Wiese S, Warscheid B. Cytoscape: software for visualization and analysis of biological networks. In: Hamacher M, Eisenacher M, Stephan C, editors. Data mining in proteomics: from standards to applications. Totowa (NJ): Humana Press; 2011. p. 291–303.