
Abstract
This study presents an automated, image-based cytometry method for determination of total counts and viability of yeast cells by using a newly synthesized DNA fluorescent dye PO-TEDM-1 and a new Easycounter YC instrument. The synthesized polycationic asymmetric monomethine cyanine dye PO-TEDM-1 penetrates only into dead cells. The new fluorescent dye has high nucleic acid sensitivity and rapid interaction kinetics. The optimal concentration of the fluorescent dye for staining dead cells was 1 µg mL−1. The Easycounter YC system was used to determine the total cell count and viability of Saccharomyces carlsbergensis. The actual viability measured using the proposed method significantly correlated with the theoretical viability (R2 of 0.9988). The optimal linear interval was from 1 × 10⁵ to 1 × 10⁷ cells mL−1. The coefficient of variation with Easycounter YC in the optimal range was 2.5–4%, whereas that of the manual hemocytometry method, in the same range was higher, 15–23%. We tested the procedure in a study of the total cell count and viability of yeast cells from the propagators in beer production as a function of the dilution. The proposed method can be used in assays involving simple cell counting and quality assurance in sample bioprocessing.
Introduction
Fermentation is the basis of beer production for breweries of all sizes. Essentially, it accounts for the conversion of fermentable carbohydrates in the wort into ethanol, carbon dioxide and specific flavours and aromas. The fermentation process depends on both environmental and microbiological components and their complex interactions. Some unfavourable conditions, e.g. starvation, the presence of ethanol, non-optimal temperature or aging, may damage the cell membrane, resulting in reduced yeast growth, loss of viability and a decrease in metabolic activity [Citation1–4]. Consequently, continuous tracking of cell viability is an important task.
The classical method for estimation of viability is based on plating a measured number of cells onto a solid medium and then counting the colonies formed after incubation to determine the viable cell counts [Citation5, Citation6]. This technique, however, is time consuming and generally gives larger errors than microscope recordings.
That is why viability is most commonly determined by bright-field microscopic observation using methylene blue staining [Citation7, Citation8], in which dead or nonviable cells are stained blue, whereas viable cells are able to exclude (or reduce) the dye and remain colourless. Finally the samples are analyzed by light microscopy (hemacytometer). This assay is relatively inexpensive and easy to perform, but generates inconsistent results. Also, errors associated with the microscope protocol are high (20–30% errors are typical) [Citation6, Citation9, Citation10].
The other stain-based methods of cell viability measurement use fluorescent dyes and fluorescent microscopy. Commonly used dyes from this group include DNA-binding fluorescent dyes such as propidium iodide or ethidium bromide [Citation11, Citation12]. In recent years, there has been growing interest in the synthesis and application of asymmetric monomethylcyanine fluorescent dyes with single positive charges (TO, YO, BO and PO) [Citation13, Citation14]. The reason for this is that they are characterized by high sensitivity, high rate of DNA binding, rapid interaction kinetics and without background fluorescence. The synthesis of dyes with a higher positive charge (two, three charges) is interesting, as these derivatives have greater affinity to DNA.
Currently, with the emergence of automated cell counters, researchers can analyze a large number of samples faster [Citation15, Citation16] and with less variability stemming from human-error. The development of computers, automation software, optics, fluorescent dyes and precision manufacturing techniques together with modern technologies such as flow cytometry and image cytometry, has helped to overcome many of the drawbacks associated with the hemacytometer [Citation17–25].
Image cytometry is widely used, as it gives the number of viable cells, size and morphology [Citation26–28]. An essential factor in these systems is not only the structure of the apparatus but also the type of fluorescent dye [Citation22, Citation24]. It is important that the dye is not toxic, has high fluorescence intensity and a low background. A few companies produce such image systems with different fluorescent dyes – NucleoCounter® YC-100™ with propidium iodide dye – PI (Chemometec, Allerod, Denmark), Cellometer® X2 Counter with bright field and fluorescent images of cells, stained with PI or acridine orange/propidium iodide – AO/PI (Nexcelom Bioscience LLC, Lawrence, MA, USA), LUNA-II YF™ with AO/PI (Logos Biosystems, South Korea).
In this work, we demonstrate an imaging cytometry method employing a new fluorescent DNA dye PO-TEDM-1 with high fluorescence quantum yield and a new fluorescence image cytometer, Easycounter YC (Milkotronic Ltd., Bulgaria) for determination of total cell count and viability of yeast cells in beer production. The procedure would be useful for research in beer production improvement, as well as for effective yeast quality control in the standard fermentation process.
Materials and methods
Chemicals and reagents
Lysis solution was prepared using the following components: cetylpyridinium chloride, Triton × 100 and Tween 80 purchased from Sigma Aldrich. Cell culture IBI. Strain 53 (Saccharomyces uvarum carlsbergensis) purchased from the collection of the National Bank for Industrial Microorganisms and Cell Cultures (NBIMCC, Bulgaria). Brewing wort and samples from the propagator of a local brewery were taken to estimate the method in a real-life sample. Bacto-peptone, yeast extract, phosphate buffered saline (PBS) pH 7.2, and methylene blue were purchased from Sigma Aldrich. All reagents for synthesis of monomethine cyanine dye PO-TEDM-1 were purchased from Sigma Aldrich.
Yeast growth conditions
Yeast IBI. Strain 53 (S. carlsbergensis) was grown in a standard liquid YPD medium (1% yeast extract, 1% yeast bacto-peptone, 2% glucose) on a rotary shaker at 150 rpm at a temperature of 28 °C for 48 h.
Synthesis and basic characteristics of monomethine cyanine dye PO-TEDM-1
2-Methylmercapto-3-methylbenzoxazolium methosulfate (7.7 g), 1-(3-iodopropyl)-4-methylpyridinium iodide (10.2 g) were put in a double-neck flask (250 mL). Then 57 mL acetic anhydride was added, while mixing with a magnetic stirrer at room temperature. N-ethyldiisopropylamine (4.6 mL) was added to the reaction mixture drop by drop with continuous stirring. The dropping was repeated after 30 min. The reaction mixture was stirred for another 2 h at room temperature and then diluted with 50 mL of diethyl ether. The precipitate (PO-Pri product) was filtered through a Büchner funnel. It was washed with 3 × 20 mL of diethyl ether and vacuum dried to constant weight. The raw PO-Pri product melting point was 186–188 °C. PO-Pri was recrystallized with methanol. Then PO-Pri 2.6 g and 3.9 g methyltriethylenediamine iodide (methyl TED iodide) were put in a three-necked flask, and 23 mL of methoxyethanol were added. The mixture was heated on the magnetic stirrer with gentle agitation at ∼120 °C until complete dissolution. Heating and stirring continued for 4 h. While heating, a precipitate began to form. After cooling down to 70–80 °C, the flack was put in an icebox for ∼1 h to achieve complete precipitation. After that, Büchner funnel vacuum filtration was made. At the end of the filtration, the precipitate was washed with 30 mL methanol. Finally, it was vacuum dried at 60 °C.
The absorption and emission characteristics of the obtained dye were examined. The DNA-binding kinetics were evaluated and compared with propidium iodide and YOYO-1. The experiment was carried out at optimal concentrations of the components. The PO-TEDM-1 and YOYO-1 dyes (50 µg mL−1) were mixed with DNA (50 µg mL−1) in a ratio of 1:12.5. Propidium iodide (50 µg mL−1) was mixed with DNA (500 µg mL−1) in a ratio of 1:1.
Automatic fluorescence imaging cytometer – Easycounter YC
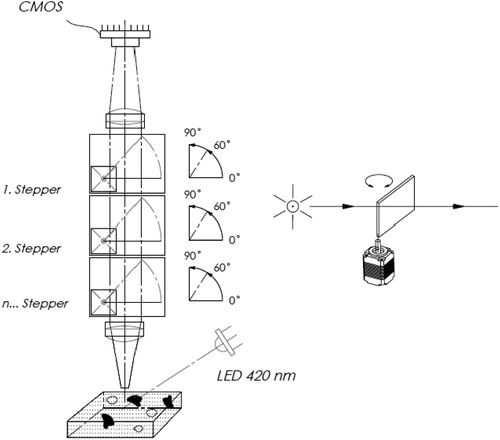
The fluorescence imaging cytometer has an innovative optical system based on tunable thin-film optical filters – Semrock’s VersaChrome filters. Unlike standard thin-film interference filters, the spectra of tunable thin-film optical filters can be angle-tuned – the filter spectrum changes as a function of angle of incidence – without exhibiting any appreciable change in the shape of the spectrum (https://autocellcount.com/shop/yeastcounter). Three filters of this type are placed one after the other in place of the conventional emission filter. The three filters can rotate from 0° to 90°. The special feature of this type of filter is that by varying the angle of incidence from 0° to 60°, the transmission is shifted to the blue spectrum, and at an angle of 60°, the transmission is 12% smaller than 0° (). Therefore, at 0°, the emission filter will pass green light above 505 nm and at 60° blue light after 442 nm. By rotation of the filter in the range of 0–60°, the trace path can be adjusted in steps of 2 nm. By using the three rotating filters, a controlled transmission in the range of 440–660 nm can be successively achieved in steps of 2 nm. Such discretionary regulation of the fluorescence emission allows precise adjustment of the signal-noise ratio in the image of the cells, which provides better contrast with the use of an unoptimal emission filter for the new PO-TEDM-1 dye. The 450 μm slit on the logpass filter was selected. The sample was loaded into the microfluidic camera (Cellchip). The Easycounter YC system automatically focuses on the cellchip and the stained cells are captured by a sensitive CMOS camera. The algorithm for the analysis of digital images determines the number and the size of fluorescent cells and calculates their total concentration and viability in per cents. The results are automatically presented on the display of the device. Unlike flow systems and hemacytometers, the image system requires no cleaning, maintenance or calibration. To ensure a more precise measurement, the cell counting area is essential. The EasyCounter YC microfluidic camera has four channels: A, B, C and D. Each channel has a recording area of 43 mm2, and this area is 43 times larger than the counting area of the standard haemocytometer (1 mm2) and about 12 times larger than the area of other analog devices such as Countess, LUNA II-YF. In this way, EasyCounter YC provides five times more accurate, reliable results compared to other devices.
Figure 1. Scheme of the Easycounter YC device.
Determination of optimal concentration of the fluorescent PO-TEDM-1 dye and incubation time of cell staining
The newly synthesized dye PO-TEDM-1 is a DNA dye; it is not permeable to viable cells. It can only penetrate through a compromised cell membrane (dead cells). For the purpose of the analysis the cell suspension was treated with lysis reagent which permeates the yeast cell wall and membranes, allowing the cellular DNA to be stained. A 24-h culture of IBI. Strain 53 grown in standard liquid YPD medium was diluted with PBS pH 7.2 to a concentration of 5 × 10⁶ cells mL−1. Lysis reagent (1% cetylpyridinium chloride, 0.5% Triton X-100 and 1% Tween 80 in PBS pH 7.2) was added to permeate the cell wall of the viable cells in the sample. One millilitre of the diluted cell culture was mixed with 100 µL of the lysis reagent and fluorescent dye to reach a final dye concentration of 0.1, 0.5, 1, 5 and 10 µg mL−1. The incubation time for cell staining varied from 1 to 15 min.
Stained yeast samples were vortexed and 10 µL of each sample were loaded into the Easycounter YC cellchip, then imaged and counted on the Easycounter YC. Images were acquired using a fluorescence optics module (excitation 434 nm and emission 456 nm). The results were automatically presented on the display of the device. The measured cell count at each concentration of the dye was presented as a diagram. Six-fold measurements were performed on the sample to determine the standard deviation.
Determination of cell count linearity and cell viability by Easycounter YC
The linearity of the total cell counts determined by the Easycounter YC imaging cytometer was evaluated using a 24-hour culture of S. carlsbergensis grown in standard liquid YPD medium. The cell suspensions were diluted in such a way so as to reach concentrations from 3 × 10³ to 1 × 10⁸ cells mL−1. One millilitre of the diluted cell culture was added to lyophilized mixture of 100 µL lysis reagent and 1 µg mL−1 fluorescent dye. The samples were incubated for 10 minutes. After that, the stained yeast samples were vortexed, loaded into the Easycounter YC counting chip, then imaged and counted on the Easycounter YC cytometer. The results for total cell count were collected and plotted by linear fit against the expected concentrations in the range from 3 × 10³ to 1 × 10⁸ cells mL−1. Repeated measurements (n = 6) were performed on each sample to determine the reliability of counting based on the coefficient of variation (CV, %) [Citation29].
The dead yeast cell count was determined by using only the fluorescent dye. The cell suspensions were diluted 10 times less than the cell suspensions for determination of total cell counts. Aliquots of 1 mL yeast suspension were stained with the dye at a final concentration of 1 μg mL−1. Stained yeast samples (n = 6) were incubated for 3 min at room temperature. Then 10 µL of each sample were loaded into the Easycounter YC counting chip, imaged and counted on the Easycounter YC. Viability was expressed as the ratio of the difference of the total and dead cells to the total cell counts in per cent.
Determination of cell viability linearity by Easycounter YC
A 24-h culture of S. carlsbergensis grown in standard liquid YPD medium was diluted to a final concentration of 5 × 10⁶ cells mL−1, split into two aliquots and each was placed in a 50 mL tube. The yeast suspension in the first tube was treated at 100 °C for 10 min to obtain dead cells. The other tube was left at room temperature (and used as source of live cells). Systematic mixing of heat-killed and live yeast cells was prepared ranging from low to high viability (0, 25, 50, 75, 100% viability). For each live/dead yeast mixture, aliquots of 1 mL yeast suspension were stained with the dye with a final concentration of 1 μg mL−1. Stained yeast samples (n = 6 for each level of viability) were incubated for 3 min at room temperature. Then 10 µL of each sample was loaded into the Easycounter YC counting chip, imaged and counted on the Easycounter YC. The sample that contained 0% live yeast cells was used for total cell count. The results for the total cell count and cell viability in per cent are shown.
Determination of total cell count and viability by hemocytometer
Total yeast cell count was determined according the protocol of the American Society of Brewing Chemists using a Thoma counting chamber [Citation8]. The cell culture was diluted in PBS to the appropriate concentration and placed in the counting chamber. At least six repetitions were performed at each experimental stage.
Viability of the yeast cells was determined by the methylene blue staining method [Citation11]. Cells were suspended in PBS, and a sample (100 µL) of the cell suspension was mixed with 100 µL of methylene blue (0.1 mg mL−1 stock solution, dissolved in 2% dihydrate sodium citrate) and incubated for 5 min at room temperature. Viable cells were colourless, and dead cells were blue. Analysis was performed by light microscopy, using an Olympus BX 51 microscope (40× objective, 15× eyepiece). Four hundred cells were counted, and viability was expressed as the percentage of cells which were not blue.
Determination of total cell count and viability of yeast cells during S. carlsbergensis cultivation and from propagators in beer production
Cell culture of S. carlsbergensis was grown in 100 mL brewing wort with initial wort gravity 16° Plato for 72 h at 28 °C. Twelve samples were taken during the cultivation. The first two samples were measured directly, while the rest of the samples were diluted to a concentration within the optimal linear range of the method. The total cell count and dead cell count were determined as described above. The results for the total cell count and cell viability in per cent were displayed on the Easycounter YC. Six-fold measurements were performed on each sample to determine the reliability of counting by calculating the coefficient of variation (CV).
A 10-mL cell suspension was taken from the propagator of a local brewery and serial dilutions from 50- to 1000-fold were made with distilled water. The samples were stained and analyzed by Easycounter YC following the cell count procedure described above.
Results and discussion
PO-TEDM-1 fluorescent dye synthesis and determination of its optimal concentration and incubation time for cell staining
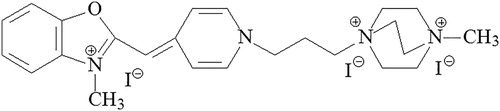
In this investigation, we describe the application of the newly synthesized PO-TEDM-1 fluorescent dye and an automated, image-based cytometer Easycounter YC for cell staining. PO-TEDM-1 is a blue fluorescence nuclear staining dye from the asymmetric monomethyncyanine group. This polycationic asymmetric monomethine cyanine dye has three positive charges. By additional coupling of methyltriethylenediamine iodide (TEDM) to the basic structure of the PO dye, a derivative with three positive charges was obtained. This derivative has much greater affinity to DNA than the PO dye containing one positive charge. The new dye PO-TEDM-1 has the chemical structure shown in . The basic characteristics of PO-TEDM-1 are as follows: staining temperature 22°С, excitation wavelength 434 nm, emission wavelength 456 nm, 52-fold emission amplification after binding to DNA. The obtained dye has a few advantages compared to other cyanine dyes such as YO, TO, PO, YOYO-1, TOTO-1: lower fluorescence background, higher fluorescence yield, higher nucleic acid affinity and rapid kinetics of binding to DNA. Compared to another monomethyne cyanine dye, Sofia Green, PO-TEDM-1 has faster DNA binding kinetics. Sofia Green is obtained by reacting benzothiazole derivatives with quinoline derivatives and PO-TEDM-1 by reacting benzoxazole derivatives with pyridine derivatives. Both dyes have a weak background and high fluorescence intensity after DNA binding.
Figure 2. Chemical structure of PO-TEDM-1 dye.
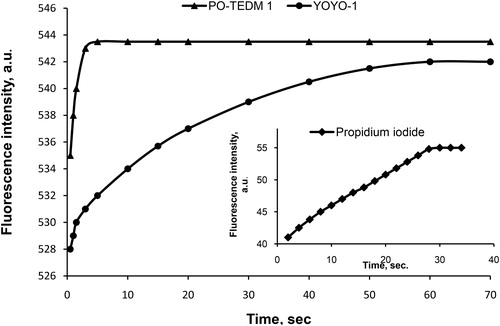
Compared to another cyanine dye, the commercial YOYO-1, the newly synthesized monomethine cyanine dye PO-TEDM-1 has similar fluorescent intensity, but 20 times more rapid DNA interaction kinetics (). When compared to the commonly used analog propidium iodide (PI), the dye has 10 times higher fluorescent intensity and 10 times more rapid interaction kinetics ().
Figure 3. Kinetics of interaction of PO-TEDM-1, YOYO-1 and propidium iodide with DNA at optimal concentration of the components.
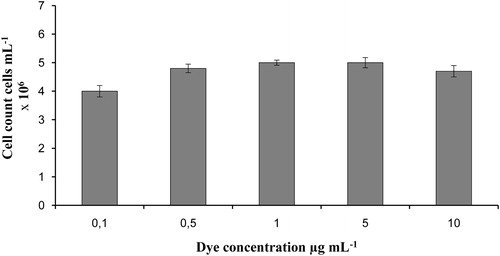
The optimal concentration of dye for cell staining was studied (). For the purpose of the analysis we first pretreated the cell suspension with lysis reagent to permeate the cell wall of viable yeast cells. Then we stained the permeated cells of S. carlsbergensis in a suspension with cell density of 5 × 10⁶ with PO-TEDM-1 in a final concentration of 0.1, 0.5, 1, 5 and 10 µg mL−1 in the sample. From 0.1 to 5 µg mL−1 of PO-TEDM-1, the number of stained cells increased, and at 1 and 5 µg mL−1 it levelled out to a plateau. With subsequent increase in concentration to 10 µg mL−1 PO-TEDM-1, the number of stained cells decreased. This is probably due to the excessive luminosity of the cells, which leads to their overlapping. Likewise, the standard error at 10 µg mL−1 was the highest, 11%. The standard error was the lowest, 3.6%, at a concentration of 1 µg mL−1. For the purpose of cell staining, cells were incubated for 1–15 min. Generally PO-TEDM-1 needs only 2 min to penetrate through the wall of dead cells and to bind to nuclear DNA. When we used a mixture of the dye and lysis reagent, the limitation factor of time was the incubation time necessary for the lysis reagent to permeate the cell wall. The results showed that 10 min were enough to permeate all cell walls and to obtain optimal staining.
Figure 4. Effect of optimal concentration of fluorescent dye on staining of yeast cells.
In parallel, another experiment was performed with untreated cell suspension to determine the optimal time for staining only the dead cells in the sample. Since PO-TEDM-1 is a DNA dye, and is not permeable to viable cells, it can be successfully used to detect dead cells in a population. The results showed that only two minutes were necessary for the dead cells to become stained.
Cell counts can be determined using different fluorescent dyes. Cell counters such as EASYCOUNTER YC usually use propidium iodide for dead cell staining. For example, the automated fluorescence cell counter NucleoCounter® YC-100™ (Chemometec) uses the DNA-binding dye propidium iodide to determine viability. The Cellometer Counter (Nexcelom Bioscience) uses propidium iodide for dead cells, and bright field image for total cell counts. Another automated fluorescence cell counter, LUNA-II YF™ (Logos Biosystem), uses propidium iodide staining in combination with acridine orange to assess cell viability.
Comparison of the properties of the newly synthesized dye and propidium iodide revealed that PO-TEDM-1 had lower background fluorescence, higher fluorescence intensity when binding to DNA, and rapid DNA binding kinetics. We suggest that the newly synthesized dye PO-TEDM-1 can be used successfully for determination of cell viability.
Cell count linearity and reliability
In order to determine the total number of yeast cells, the cells were treated with a lysis solution. This solution permeates the cell wall and this allowed the fluorescent dye PO-TEDM-1 to stain the cellular DNA of the viable cells.
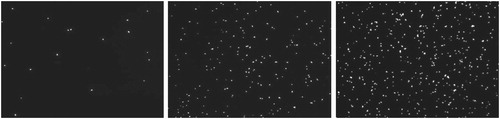
To determine the Easycounter YC Image Cytometry reliability, we prepared and observed samples with different cell concentration. The serial dilutions of yeast suspension (S. carlsbergensis) were treated with lysis reagent and stained with PO-TEDM-1, then counted on the Easycounter YC to determine the total cell count. Plotting the measured concentration versus the theoretical concentration resulted in a linear relationship with an R2 of 0.9968 (). The optimal linear interval was from 1 × 10⁵ to 1 × 10⁷ cells mL−1 and the measurement range was from 3 × 10³ to 5 × 10⁷ cells mL−1. In order to provide a statistically reliable result, it is recommended that the total number of cells in the diluted cell suspension be in the range of 1 × 10 5 to 1 × 10 7 cells mL−1. presents images of samples with increasing cell concentration within the optimal linear range (1 × 10⁵ to 1 × 10⁷ cells mL−1).
Figure 5. Cell count linearity measured by automated Easycounter YC.
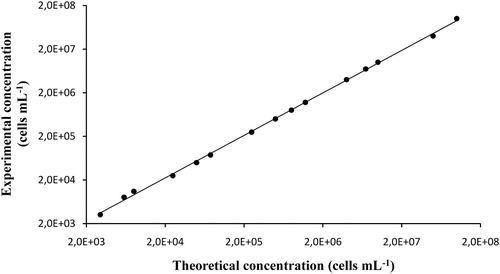
Figure 6. Images of samples with increasing cell concentration (1 × 10⁵, 1 × 10⁶, 1 × 10⁷ cells mL−1) captured using automated Easycounter YC.
Next we compared the coefficient of variation (CV) for each yeast suspension using the Easycounter YC instrument and the traditional hemocytometer method. Within the linear range of the yeast cell counts in the Easycounter YC, the CV was between 2.5% and 4% (). The manual method had a higher CV%, from 10% to 23%. The obtained results are in agreement with the results obtained by other authors using the manual method [Citation11, Citation17, Citation30, Citation31]. A comparison of the obtained linear interval and CV of Easycounter YC with other similar image cytometers showed that they have a similar CV, but the optimal interval is different for each different device: 1 × 10⁵ – 2 × 10⁶ cells/mL with CV 3–10% for NucleoCounter YC-100 (company ChemoMetec) and 4 × 10⁶–6.6 × 10⁷ cells/mL with CV 4–13% for Cellometer Auto X4 (10×) (Nexcelom Bioscence) [Citation11, Citation23, Citation28, Citation31].
Table 1. Coefficient of variation (CV, %) of measurements of different cell concentrations in the range from 3 × 10³ to 1 × 10⁸ by using automated Easycounter YC and manual hemocytometer.
Cell viability linearity
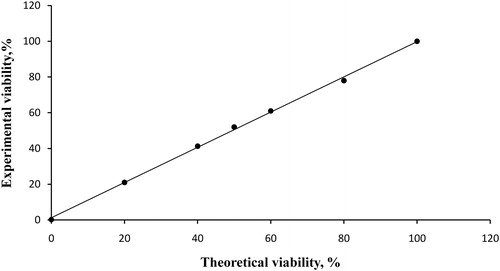
Aliquots of a live yeast cell suspension (S. carlsbergensis) were mixed with heat-killed yeast cells to generate five samples at various levels of viability. The cells were stained with PO-TEDM-1 following the protocol described above and counted on the Easycounter YC image cytometer. The measured viability of the initial yeast sample was 95% and, in the present experiment, this was considered as 100% viability. The sample that contained 0% live yeast cells was used for the total cell count. The values of the total cell count and cell viability in per cent are displayed on the Easycounter YC. The measured viability was plotted against the theoretical viability in the final mixture (). As a result, the actual viability measured with the proposed yeast-cell counting algorithm significantly correlated with the theoretical viability with a linear correlation (R2 = 0.9988). Such correlations between measured and theoretical viability have been reported using other similar image counters like NucleoCounter YC-100 (Chemometec) and Cellometer Auto X4 (10×) (Nexcelom Bioscience).
Figure 7. Viability linearity in cell samples measured by automated Easycounter YC.
Determination of total cell number and viability of yeast cells during cultivation
It is important to control the number of yeast cells and viability during a cultivation process. It is of particular interest to detect the time when the cell viability begins to decrease. Thus, we cultured IBI. Strain 53 (S. carlsbergensis) in brewing wort and determined the total number of yeast cells and their viability as a function of cultivation time by cytometry and the manual microscopic method (). Twelve samples were taken over a period of 72 h. The highest total cell concentration was measured at 48 h. The total concentration of yeast cells appeared to decrease after 48 h of cultivation. The viability increased up to 24 h; at 27 h it remained unchanged, and after 27 h it decreased, which may indicate cell death due to unfavourable growth conditions. Both methods showed a dramatic decrease in viability after 30 h of fermentation, which marked the end of the normal cultivation cycle in the process.
Figure 8. Total cell number and viability as a function of cultivation time. Results were obtained by both Easycounter YC image cytometer and manual hemocytometer.
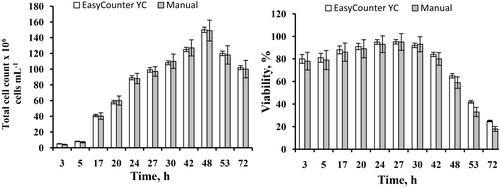
To compare the performance of the two methods, we calculated the standard deviations. When the cell concentration ranged from 10 to 160 × 106cells mL−1, the standard deviation in the microscopic method ranged from 0.45 to 13.26 × 10⁶, whereas in the image cytometry method it ranged from 0.23 to 3.37 × 10⁶ (). The same trend was observed in the viability assay. When the viability varied from 20% to 95% in the microscopic method, the standard deviation varied from 2.16 to 8.5, whereas in the image cytometry method it ranged from 0.72 to 3.97. Such measurements are important because they ensure an effective control of the cultivation process. The advantage of the novel cytometry method is that it reduces the time spent on manual cell counting and counts thousands of cells, which can improve the accuracy of the results. The consistency between the two methods confirmed that the imaging cytometric method could generate accurate results.
Determination of total cell count and viability of yeast cells from propagators in beer production
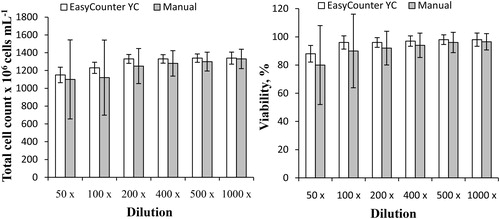
The proposed method can provide a useful tool for research and development in the brewery industry and may be incorporated into the manufacturing process to monitor the yeast cell concentration and viability efficiently during the fermentation process. Monitoring of brewing yeast fermentation and propagation is a very important task [Citation32]. After proving the high accuracy of the method for S. carlsbergensis viability, the obtained method was applied in real-life samples from an active propagator. A sample of S. carlsbergensis cells was taken from the propagator. The lager yeast cells S. carlsbergensis, were propagated in stainless steel conical vessels with 2–4 mg g−1 of oxygen and perpetual aeration for 48 hours in a 16°P wort. The initial cells concentration in the sample was very high (1360 × 106). To provide an accurate measurement using Easycounter YC, it was necessary to determine the optimal dilution of the sample. Six serial dilutions were made, from 50 to 1000 fold, to determine the total cell count. Another six serial dilutions were made from 5 to 100 fold to determine the dead cell count, because the concentration of dead cells was lower. The total cell count and viability were measured using Easycounter YC and the standard manual hemocytometric method and the results were compared. Six measurements at each dilution were made via both methods and the standard deviation was calculated. presents the total cell number and viability of yeast cells from the propagator as a function of the dilution. The plotted values are the final calculations from the software considering the used dilution. The lowest standard deviation values in the Easycounter YC method were obtained at dilutions from 200 to 500 fold, as the resulting concentrations were within the optimal linear range of the method. Although the obtained coefficients of variation for the other dilutions were higher, they were still within the acceptable limits. The results from the manual hemocytomteric method showed very large errors in most of the examined dilutions. This was due to the great amount of cells, leading to overlapping that makes the manual counting very difficult and time consuming, with low accuracy.
Figure 9. Total cell count and viability of yeast cells from a propagator as a function of dilution, measured by Easycounter YC and manual hemocytometer.
Conclusions
This study demonstrated a novel DNA-binding fluorescence dye PO-TEDM-1 and Easycounter YC image cytometer for total cell count and viability detection. The new dye has high nucleic acid sensitivity and rapid interaction kinetics. The fluorescence imaging cytometer has an innovative optical system based on tunable thin-film optical filters – Semrock’s VersaChrome filters. The Easycounter YC provides accurate, reliable results and lower coefficient of variation. The method was validated against the manual method using methylene blue. The proposed method can be used in assays involving simple cell counting and quality assurance for bioprocessing samples, minimizing the interfering factors from the wort. Being an image-based system, it provides some of the functions of the microscopic methods, such as visual inspection of the stained cells. It also reduces the assay time and facilitates the whole process through data management.
Disclosure statement
Dinko Dinev is an employee of Milkotronik Ltd. (Stara Zagora, Bulgaria), the company that produces and distributes Easycounter YC in Bulgaria.
Related Research Data
References
- Van Zandycke S, Siddique R, Smart KA. The role of the membrane in predicting yeast quality. Tech Q. 2003;3:169–173.
- Capece A, Romaniello R, Siesto G, et al. Conventional and non-conventional yeasts in beer production. Fermentation. 2018;4:1–11.
- Layfield J. Characterization of synchronous cultures of Saccharomyces cerevisiae for use in brewery fermentation [dissertation]. Raleigh (NC): North Carolina State University; 2016.
- Kregiel D, Berlovska J. Evaluation of yeast cell vitality using different fluorescent dyes. Food Chem Biotechnol. 2009;73:5–14.
- Boulton C, Quain D. Brewing yeast and fermentation. Oxford (UK): Blackwell Science; 2001.
- Thomson K, Bhat A, Carvell J. Comparison of a new digital imaging technique for yeast cell counting and viability assessments with traditional methods. J Inst Brew. 2015;121:231–237.
- Stoddart M. Cell viability assays: introduction. Methods Mol Biol. 2011;740:1–6.
- American Society of Brewing Chemists. Methods of analysis. 9th ed. St. Paul: ASBC; 2004. Yeast-3A yeast stains, -4 microscopic yeast cell counting, -6 yeast viability by slide culture.
- Chan LL, Kuksin D, Laverty DJ, et al. Morphological observation and analysis using automated image cytometry for the comparison of trypan blue and fluorescence-based viability detection method. Cytotechnology. 2015;67:461–473.
- Luarasi L, Troja R, Pinguli L. The relationship between yeast viability and concentration in the fermentation process of wort for beer production. Eur J Biotechnol Genet Eng. 2016;3:83–86.
- Kwolek-Mirek M, Zadrag-Tecza R. Comparison of methods used for assessing the viability and vitality of yeast cells. FEMS Yeast Res. 2014;14:1068–1079.
- Stewart GG. The yeast handbook: brewing and distilling yeasts. Cham: Springer International Publishing; 2017. Chapter 8, Yeast viability and vitality; p. 147–165.
- Menacher F, Rubner M, Berndl S, et al. Thiazole orange and Cy3: improvement of fluorecent DNA probes with use of short range electron transfer. J Org Chem. 2008;73:4263–4266.
- Sabnis RW. Handbook of biological dyes and stains. Hoboken (NJ): Wiley; 2010.
- Louis KS, Siegel AC. Cell viability analysis using trypan blue: manual and automated methods. Methods Mol Biol. 2011;740:7–12.
- Tholudur AL, Giron K, Alam T, et al. Comparing automated and manual cell counts for cell culture applications. BioProcess Int. 2006;4:28–34.
- Cadena-Harrera DC, De Lara JE, Ibanez N, et al. Validation of three viable-cell counting methods: Manual, semi-automated and automated. Biotechnol Rep. 2015;7:9–16.
- Boyd RA, Gunasekera ST, Attfield VP, et al. A flow-cytometric method for determination of yeast viability and cell number in a brewery. FEMS Yeast Res. 2003;3:11–16.
- Vanhauteghem D, Demeyere K, Callaert N, et al. Flow cytometry is a powerful tool for assessment of the viability of fungal conidia in metalworking fluids. Appl Environ Microbiol. 2017;83:e00938–e00917.
- Chan LL, Zhong X, Qiu J, et al. Cellometer vision as an alternative to flow cytometry for cell cycle analysis, mitochondrial potential, and immunophenotyping. Cytometry Part A. 2011;79A:507–517.
- Chan LL, Lai N, Wang E, et al. A rapid detection method for apoptosis and necrosis measurement using the Cellometer imaging cytometry. Apoptosis. 2011;16:1295–1303.
- Chan LL, Wilkinson AR, Paradis BD, et al. Rapid image-based cytometry for comparison of fluorescent viability staining methods. J Fluoresc. 2012;22:1301–1311.
- Chan LL, Kury A, Wilkinson A, et al. Novel image cytometric method for detection of physiological and metabolic changes in Saccharomyces cerevisiae. J Ind Microbiol Biotechnol. 2012;39:1615–1623.
- Hong D, Lee G, Jung NC, et al. Fast automated yeast cell counting algorithm using bright-field and fluorescence microscopic images. Biol Proced Online.. 2013;15:13.
- Chan L. Identify & resolve manual cell counting errors through automation [Internet]. Lawrence (MA): Nexcelom Bioscience; 2019 Jan 24 [cited 2019 Feb 16]. Available from: https://www.nexcelom.com/identify-resolve-manual-cell-counting-errors-through-automation/
- Layfield JB, Sheppard JD. What brewers should know about viability, vitality, and overall brewing fitness: a minireview. MBAA TQ. 2015;52:132–140.
- Laverty DJ, Kury AL, Kuksin D, et al. Automated quantification of budding Saccharomyces cerevisiae using a novel image cytometry method. J Ind Microbiol Biotechnol. 2013;40:581–588.
- Saldi S, Driscoll D, Kuksin D, et al. Image-based cytometric analysis of fluorescent viability and vitality staining methods for ale and lager fermentation yeast. J Am Soc Brew Chem. 2014;72:253–260.
- Panichkitkosolkul W. Confidence intervals for the coefficient of variation in a normal distribution with a known population mean. J Probab Stat. 2013;324940.
- Chan LL, Lyettefi EJ, Pirani A, et al. Direct concentration and viability measurement of yeast in corn mash using a novel imaging cytometry method. J Ind Microbiol Biotechnol. 2011;38:1109–1115.
- Chan LL, Smith T, Kuksin D, et al. A high-throughput AO/PI-based cell concentration and viability detection method using the Celigo image cytometry. Cytotechnology. 2016;68:2015–2025.
- Novak J, Basarova G, Teixeira JA, et al. Monitoring of brewing yeast propagation under aerobic and anaerobic conditions employing flow cytometry. J Inst Brew. 2007;113:249–255.