
 ?Mathematical formulae have been encoded as MathML and are displayed in this HTML version using MathJax in order to improve their display. Uncheck the box to turn MathJax off. This feature requires Javascript. Click on a formula to zoom.
Abstract
The conventional method for construction of stable expression cell lines is mainly based on random integration. However, one drawback of random integration is that the target gene might be integrated into a heterochromatin region or an unstable region of chromatin, thus requiring multiple rounds of selection to obtain desirable expressing cell lines. Rational cell line construction can overcome this shortcoming by integrating transgenes specifically into a stable hot spot within the genome. As such, the discovery of novel effective hot spots becomes critical for this new method of cell line construction. Here we report a practical method for discovery of new stable hot spots through random integration of lentivirus. We describe the thorough study of a hot spot located at NW_006880285.1. The expression stability of this hot spot was verified by detecting Zsgreen1 reporter gene expression for over 50 passages. When cells were adapted to suspension culture, they continuously expressed the Zsgreen1 reporter gene. In addition, this cell suspension was able to stably express the reporter gene for an additional 50 passages. Another finding was that cells with the NGGH gene inserted into the same hot spot were also able to stably express respective protein over 50 passages. In summary, this research offers an easy and new method for researchers to identify stable hot spots within the Chinese Hamster Ovary (CHO) genome on their own, thus contributing to the development of site-specific integration studies in the future.
Introduction
For over three decades, Chinese Hamster Ovary (CHO) cells have been the main workhorse in the biopharmaceutical industry [Citation1]. There are many reasons why CHO cells have been chosen as the dominant commercial protein manufacturer. These reasons include safety considerations, easy transfer of heterogeneous genes into CHO genomes, adaptation to serum-free media, fast and robust growth of cells, and the ability to express recombinant proteins with human-like post-translational modifications [Citation2–4]. It is time-consuming to establish a CHO expressing cell line through conventional methods mainly because of the unwanted phenotypic heterogeneity caused by the position effect [Citation5,Citation6]. The position effect, which refers to the influence of the chromosomal location of a gene on its activity, has been recognized for over 90 years [Citation7]. It has been influential on the field of genomic engineering [Citation5]: previous researches revealed that certain genomic domains could exert a general activating or attenuating influence on the embedded genes for protein expression level [Citation8]. Indeed, the position effect plays a key role in triggering the instability often observed in the conventional construction of cell lines [Citation6]. Site-specific integration (SSI) of transgenes into stable hot spots, however, was generally believed to be able to overcome the phenotypic heterogeneity caused by the position effect and maintain long-term expression stability [Citation1,Citation3,Citation6,Citation9,Citation10].
Although targeting a gene of interest (GOI) into a stable hot spot appears promising, it could be challenging to discover the hot spot. Considering the potential commercial value, information pertaining to stable hot spots has not been easily accessible to the general public. On the one hand, if researchers have access to highly expressing cell lines, targeted locus amplification (TLA) could be applied to identify new integration sites. The method of TLA could selectively amplify and sequence entire genes on the basis of the crosslinking of physically proximal sequences. As such, this method could be applied in discovering the transgenes’ insertion sites [Citation11]. After identifying hot spots, researchers would be required to further screen out the final hit by targeting GOI into different spots. On the other hand, if researchers have no access to stably expressing cell lines, then the random integration screening method might be applied. According to previous researches, lentivirus has been a good candidate in discovering new hot spots [Citation12].
In this study, we used a new method to identify potential targeting sites based on Zsgreen1 protein screening derived from lentivirus infection. We described one hot spot in details and passaged the corresponding model cell line extensively to test this insert’s stability. Finally, the model cell line was adapted to suspension culture. Its potential for industrial application was also carefully explored. The method described here provides a new way to discover stable hot spots of their own for SSI related studies.
Materials and methods
Lentivirus construction and titer calculation
The reporting lentivirus was constructed as follows: HEK-293T cells were seeded in T75 flasks (Corning, Corning, NY) one day before being transfected by 3 plasmids (Supplemental Table S1), pSPAX2 (10 μg), pMD2G (5 μg) and pHBLV-CMV-Zsgreen1 (10 μg), by using 75 μL Lipofiter (Hanbio, Shanghai, China). Supernatants were collected after 48–72 hours transfection and were centrifuged at 82700×g for 2 hours. The lentivirus was finally obtained and was stored at −80 °C.
The titer calculation method was as follows: HEK-293T cells were seeded in a 96-well plate and cells within each well were infected with serially diluted lentivirus. Three days later, we chose the well that had 10 ∼ 30% rate of green fluorescence cells to determine the lentiviral titer. The titer calculation function was as follows:
Cell culture, lentivirus infection and stable cell line construction
CHO-K1 cells were obtained from ATCC and were cultured in Ham’s F12K media (Thermo Fisher Scientific, Waltham, MA) supplemented with 10% FBS (Thermo Fisher Scientific) at 37 °C, 5% CO2 incubator. Cells were seeded on 6-well plates one day before lentivirus infection. The next day, lentivirus was thawed on ice and was mixed with 1 mL fresh medium. The old medium within each well was replaced by this lentivirus suspension. Cells were incubated with this lentivirus mix for 4 hours. Another 1 mL of medium was added to each plate after 4 hours. The following day, all media were replaced by fresh medium. After 72 hour’s infection, pools were single-cell-sorted and seeded onto a 96-well plate by FACS (fluorescence-activated cell sorter) based on fluorescence intensity.
Genome walking
Genomic DNA was isolated and purified by using NucleoSpin Tissue and NucleoSpin Gel and PCR Clean-Up (Clonetech, Mountain View, CA), respectively. The prepared genomic DNA samples were then separately digested by three different restriction endonucleases: DraI, SspI, and HpaI (Clonetech) at 37 °C overnight. The digested products were all purified by NucleoSpin Gel and PCR Clean-Up and were ligated to a genome walker adaptor (Clonetech) at 16 °C overnight to make libraries. All three libraries were amplified by using Advantage 2 PCR Kit (Clonetech). This primary PCR was carried out by using a two-step method (5X 94 °C for 25 s, 72 °C for 3 min; 20X 94 °C for 25 s, 67 °C for 3 min; 1X 67 °C for 7 min) with primer sets AP1 and LSP1 (Supplemental Table S2). The primary PCR products were used as template for the secondary PCR. The secondary PCR reaction condition was the same as the primary PCR except for using another primer set, AP2 and LSP2 (Supplemental Table S2). The secondary PCR products were all sequenced.
Adaption to suspension culture
The original 2C3 model cell line’s culture media were gradually replaced by serum free media M2 + M4 (1:1) (Kangju, Suzhou, China). Cells were transferred to a bottle on a rotatory shaker (100 r/min) when % FBS was 0 and were cultured for another 3–4 weeks at a speed of 100 rpm. If there were dead cells and the cell concentration was less than 106 cell/mL, adherent cells were added into the bottle to maintain a minimum concentration of 106 cell/mL.
Knock-in cell line construction and PCR verification
Cells were transfected with three expression plasmids (Supplemental Table S1): Cas9, sgRNA targeting the integration site and a corresponding donor plasmid (molar ratio of 1:1:1). The donor plasmid (Supplemental Figure S1A and Table S2) was designed to harbour 600 bp homology arms, which were exactly next to the 23 bp Cas9 cleavable sgRNA sequence (Supplemental Table S3). A puromycin resistant gene cassette together with glucagon-like peptide 1 (GLP-1) with human serum albumin fusion protein (NGGH) gene cassette were both placed within the homology arms. A cop-GFP gene cassette was placed outside the homology arm to detect any random integration event. Once the NGGH gene in the donor plasmid was precisely integrated into the hot spot locus, cells would lose green fluorescence expression and express the NGGH gene together with the puromycin resistance gene (Supplementary Figure S1A). Thus, only cells with no green fluorescence were single-cell-sorted by FACS and were seeded in the 96-well plates.
For each sample, 4 × 10⁵ cells were transfected with a total of 3 μg of DNA using Lipofectamine 3000 (Thermo Fisher Scientific). Stable cell pools were generated by adding 5 μg/mL puromycin as selection pressure to each well on day 3. After 14 days of selection, cells were detached by TrypLE (Thermo Fisher Scientific) and were resuspended in PBS. The cell pool was sorted by a MoFlo XDP FACS cell sorter (Beckman Coulter, Boulevard Brea, CA) and one cell was seeded per well in 200 μL medium in 96-well plates.
After 10 days of growth, monoclonal cell lines were passaged over to 12-well plates. When the confluence of cells within each well was close to 100%, they were detached by TrypLE. The genomic DNA of cells was extracted from pellets and was used as the templates for the subsequent PCR reactions. All PCR reactions were conducted by using Phantom Max Super-Fidelity DNA Polymerase (Vazyme, Nanjing, China). The specific reaction condition for 5′/3′ junction PCR was as follows: 95 °C for 3 min; 30X: 95 °C for 15 s, 66 °C for 15 s, 72 °C for 2 min; 72 °C for 5 min. Out-out PCR was carried out by using the following condition: 95 °C for 3 min; 30X: 95 °C for 15 s, 66 °C for 15 s, 72 °C for 6 min; 72 °C for 5 min. The 5′/3′ junction PCR were used to verify whether the target gene cassette was inserted site-specifically and the out-out PCR was used to test whether the cell line was homozygous or heterozygous. For the nested PCR, which used out-out PCR products as a template; the PCR reaction condition was 95 °C for 3 min; 30X: 95 °C for 15 s, 65 °C for 15 s, 72 °C for 2 min; 72 °C for 5 min. The 5′/3′ junction PCR products and nested PCR products were sequenced.
FACS sorting and flow cytometry analysis
The adherent 2C3 cell line was resuspended in PBS (GE Healthcare Life Sciences, Logan, UT) and cells were single-cell-sorted and collected (MoFlo XDP FACS; Beckman Coulter, Boulevard Brea, CA). Adherent fluorescent cells were further analyzed by a BD FACCcalibur flow cytometer (BD, Franklin Lakes, NJ) to verify the heterogenous gene expression stability of cell pools over passages. For the suspension cells, their fluorescence signal was detected and analyzed by MoFlo XDP FACS cell sorter again.
Latex-immunity turbidimetry assay
Supernatants of NGGH suspension cell samples were tested by urinary microalbumin assay kit (Midngdian, Shanghai, China) [Citation13], following the manufacturer’s instructions.
Results and discussion
Reporting lentivirus construction and titer detection
Normally, lentivirus expresses reporter gene when integrated into genome. Here we used Zsgreen1 as our reporter gene for further research. When lentivirus was successfully constructed, its titre value was estimated based on Supplementary Figure S2 where the fluorescence rate was approximately 20% and the titer was ∼108 TU/mL based on the formula given above.
Highly expressed model cell line construction and identification of insertion site
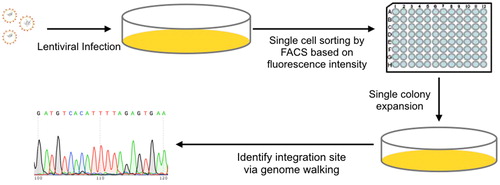
To identify potential hot spots within CHO-K1 cell line genomes, we set up a high-throughput screening method to achieve the goal. The CHO-K1 cells were infected with the lentiviral construct harbouring the Zsgreen1 gene driven by a ubiquitously expressed cytomegalovirus (CMV) promoter at a low multiplicity of infection (MOI = 0.3) to favour single integration. FACS was applied to isolate single Zsgreen1-positive cells with high fluorescence intensity. The rate of Zsgreen1-positive cells was 4.2% and only cells ranking within top 10% fluorescence intensity were single-cell-sorted and seeded in 96-well plates for further expansion. The monoclonal cells were monitored under a fluorescence microscope to eliminate non-stable positive cells and cells with a slow growth rate. The qualified colonies were expanded step by step. The genomic DNA from the viral constructs was extracted and further analyzed by genome walking to identify all potential viral integration sites within the genome [Citation14–16]. The flow diagram of the overall high-throughput screening process is illustrated in .
Figure 1. Flow diagram of hot spot discovery by using lentivirus. A lentivirus harbouring the Zsgreen1 reporter gene was used to infect CHO-K1 cells at low MOI (MOI = 0.3). The pool was single-cell-sorted based on green fluorescence intensity (top 10%). Cells were expanded for over 5 weeks and underwent further genome walking analysis.
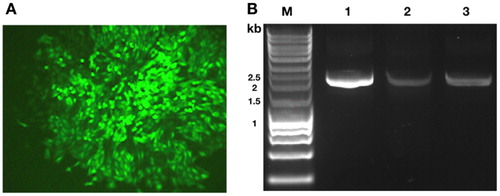
Here we describe the specific integration site of one monoclonal cell line (2C3). The 2C3 cell line’s colony image () was captured 6 days after FACS sorting: the colony was round shaped with a strong fluorescence signal. Massive cells were observed in the colony. Therefore, this cell line was chosen for further study to identify the specific viral integration site. The lentivirus integration site of the 2C3 cell line was identified by using genome walking. After conducting secondary PCR, three samples from different libraries were run in a 1% agarose gel (). There was only one band in all three different lanes, indicating that only one lentivirus copy was inserted in the genome of the 2C3 cell line. The PCR products were further sequenced by primer AP2 (Supplemental Table S2). The sequencing results from three different libraries matched with each other (Supplemental Table S4). The hot spot was located at 1235357 within the scaffold NW_006880285.1 analyzed by BLAST at NCBI.
Figure 2. Hot spot identifcation.
(A) Image of 2C3 cell line captured by fluorescence microscopy 6 days after seeding.
(B) Secondary PCR results: genomes cut by DraI (Lane 1), SspI (Lane 2), and HpaI (Lane 3). M, molecular size marker (1 kb Ladder, Sangon, Shanghai, China)
In addition, the hot spot we discovered was located in a copy number variance (CNV) stable region, where the CNV value was 2.0 according to the results of Kaas et al. [Citation17]. Hence, this hot spot could be considered as stable from a CNV point of view and was worth further investigation.
Identifying new stable hot spots by using lentivirus with a fluorescence tag has many advantages. First, the integrated form of HIV-1 DNA is traditionally considered to be responsible for viral gene expression [Citation18]. Thus, it provides a good way to link the chromatin position with the expression level of inserts. Plasmid-based screening, however, might potentially be interfered by transient expression and thus was not chosen here. Second, the Zsgreen1 reporter gene allows high-throughput screening by using FACS compared to other regular reporter genes such as β-galactosidase. Third, the hot spot identification method could be preferred by researchers compared to the TLA method, which is very complex and expensive. Finally, the fluorescent model cell line itself could be a good tool for other researches, such as media optimization or genetic screening based on CRISPR/Cas9 technology to further improve the expression level [Citation19–21].
By applying this lentivirus-based screening method, we successfully discovered a couple of integration sites which could authenticate its practicability. Moreover, we tested the stability of the selected 2C3 cell line in order to evaluate to its potential for prospective industrial application.
Stability assay of adherent model cell line
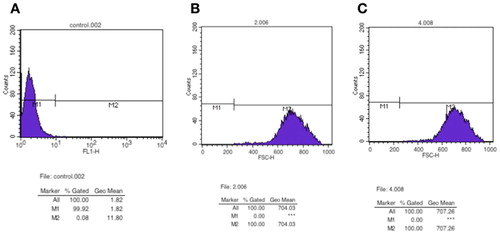
The stability issue is critical for the CHO industry. Based on previous research [Citation22], the unstable expression of CHO cells has been attributed to both genetic factors, such as gene copy loss in the proliferating CHO cell population, and epigenetic factors, such as promoter methylation. To further verify the potential of the site for industrial application, we tested the stability of the fluorescence signal in the model cell line over passages. The model cell line was cultured for over 50 passages and the fluorescence signal of different cell line passages was detected by flow cytometry. We found that the fluorescence rates of cells for both passage 1 and passage 50 were 100% compared to those in the parallel control sample (). Hence, the site identified in the model cell line could be considered as a stable integration site and it would be worth further exploring its potential for industrial application.
Figure 3. Fluorescence rate of adherent model cell line over passages.
(A) Parallel control sample, 0%; (B) 2C3 cell line at passage 1, 100%; (C) 2C3 cell line at passage 50, 100%.
The specific parallel control sample was obtained by integrating another non-Zsgreen1 gene into the same spot as 2C3 via CRISPR/Cas9 technology. Here we chose NGGH [Citation13] as the targeting gene. A total of three hits were obtained this time. All hits could be amplified by both 5’ junction and 3′ junction PCR (Supplementary Figure S1B). The molecular weight of all the 5′ junction amplicons was ∼1.7 kb, which could match the design (Supplementary Figure S1A). The molecular weight of all 3’ junction amplicons was ∼1.5 kb and could match the design as well (Supplementary Figure S1A). The 5′/3′ genome-donor boundaries were sequenced to verify the precise integration of the donor plasmid into the genome. Indeed, the sequencing result verified the precise integration of the targeting cassette into a hot spot locus (Supplementary Figure S1C). Out-out PCR revealed that all 3 cell lines were heterozygous and were correctly targeted with the intact target integration unit, generating an expected size of amplicons (wild-type amplicon: 1.2 kb + target integration unit: 4.7 kb ≈ 5.9 kb; Supplementary Figure S1D). The out-out PCR products (∼5.9 kb) were purified and were used as templates for a series of nested PCR, in order to verify that the correct NGGH sequence was targeted into the genome. Indeed, the sequencing result confirmed the complete and correct integration of the NGGH gene sequence into the hot spot within the genome (Supplemental Table S5). Cell line 2 was used as the parallel control sample mentioned in the last paragraph.
Adaption to suspension culture and stability assay for suspension cells
CHO cells were normally adapted to serum-free suspension culture for potential scale-up culture in industry. Hence we tested the model cell line’s expression performance after its adaption to serum-free suspension culture to further confirm its potential for industrial application. We first adapted cells to suspension. When the cell density could double the next day, the cells could be treated as successfully adapted to a suspension culture. In our experiments, the cell density reached 1.98 × 10⁶ cells/mL on Day 2, whereas the original cell density was 106 cells/mL by Day 1. Then we diluted the cell suspension back to 106 cells/mL, and its cell density reached 2.08 × 10⁶ cells/mL again by Day 3. Continuous observation over a longer period verified the successful adaption of the suspension culture (Supplementary Figure S3A). The parallel control sample also underwent the same adaptation process and its cell density doubled every day as well (Supplementary Figure S3B).
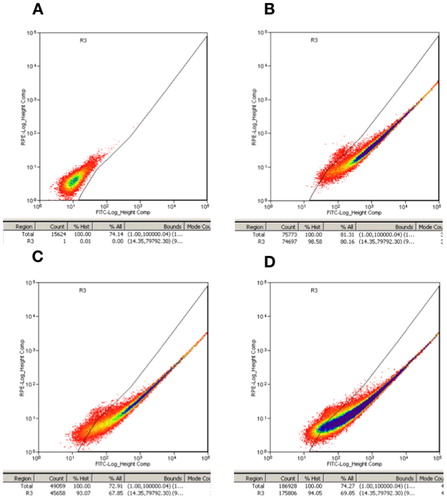
The fluorescence rates at 3 different passages of the suspension model cell line together with the parallel control were all detected by using the FACS cell sorter. The fluorescence rate of passage 1 was close to 98% after the adaptation process when compared to the parallel control sample (). In addition, the samples from passage 25 and passage 50 both maintained the fluorescence rate at around 93%∼94% (). Thus, the process of adaptation to suspension culture did not significantly impact the fluorescence rate of the model cell line. These results further verified the stability of this hot spot and revealed its potential for industrial application in the future.
Figure 4. Fluorescence rate of model cell line after adaptation to suspension culture over passages.
(A) Parallel control sample (used to set the threshold line); (B–D) model cell line at passage 1 (B), passage 25 (C), and passage 50 (D).
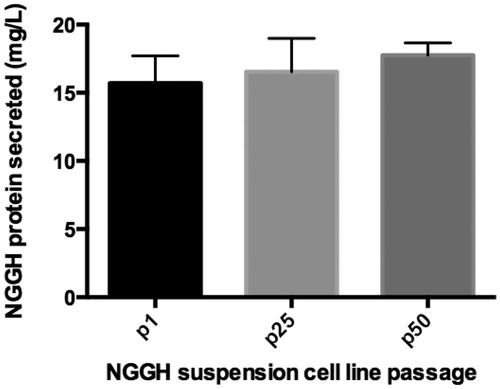
The NGGH expression level of the suspended parallel control was also detected. The NGGH protein concentrations within the supernatants were all stably around 15–17 mg/L over 50 passages (). This supported the aforementioned conclusion that the heterogenous gene can be stably expressed once integrated into this stable hot spot.
Figure 5. Expression level of suspended parallel control (cell line 2) over 50 passages.
Stability is critical in the biopharmaceutical industry. The conventional method for cell line construction based on random integration cannot guarantee stable cell lines every time [Citation22]. This is because some GOIs become inserted into unstable regions of the genome. The stability of the hot spot we discovered was proved from different aspects: first, the model cell line 2C3 displayed great stability for over 50 passages (); second, when the model cell line was adapted to suspension culture, which brought about significant changes to the extracellular environment, almost all cells maintained the green fluorescence signal (); third, these suspension cells did not lose any fluorescence for another 50 passages (). Finally, the heterogeneous gene (i.e. NGGH) integrated into the stable hot spot could also be stably expressed for over 50 passages (). Interestingly, all these lab data corresponded well with the stability predictions based on the CNV value [Citation17].
As mentioned above, the heterogeneous gene could be stably expressed when it was inserted into the hot spot, whether the cells were in an adherent or suspension cell culture. Therefore, as a next step, it is worth using CRISPR/Cas9-based technology to target more different transgenes into the hot spot to test whether corresponding stable expression cell lines can be obtained. Genes with different sizes, from the insulin gene to antibody light and heavy chain genes, should all be tested. After the expression stability is verified, other optimizations such as improving the gene expression levels should be considered in the future.
Conclusions
In summary, we established a simple and efficient screening method to identify a new hot spot within the CHO genome and further verified the stability of this hot spot. This method could serve as a guide for identification of more stable hot spots and application of SSI to construct new expression cell lines in the future.
Supplemental Material
Download MS Word (626.2 KB)Acknowledgements
This work was supported by the open lab platform at the School of Life Sciences in Fudan University and the School of Pharmaceutical Sciences in Jiangnan University. The authors thank Dr. Daru Lu at Fudan University and Dr. Helene F. Kildegaard at Novo Nordisk Foundation Center for Biosustainability, Technical University of Denmark for sharing their plasmid. The authors thank Suqin Shen and Longjiang Liu at the national key lab platform in Fudan University for the assistance in FACS.
Disclosure statement
The authors declare no conflict of interest.
Additional information
Funding
Related Research Data
References
- Wurm FM. Production of recombinant protein therapeutics in cultivated mammalian cells. Nat Biotechnol. 2004;22:1393–1398.
- Wurm FM, Hacker D. First CHO genome. Nat Biotechnol. 2011;29:718–720.
- Kim JY, Kim YG, Lee GM. CHO cells in biotechnology for production of recombinant proteins: current state and further potential. Appl Microbiol Biotechnol. 2012;93:917–930.
- Fischer S, Handrick R, Otte K. The art of CHO cell engineering: A comprehensive retrospect and future perspectives. Biotechnol Adv. 2015; 33:1878–1896.
- Wilson C, Bellen HJ, Gehring WJ. Position effects on eukaryotic gene expression. Annu Rev Cell Biol. 1990;6:679–714.
- Lee JS, Kallehauge TB, Pedersen LE. Site-specific integration in CHO cells mediated by CRISPR/Cas9 and homology-directed DNA repair pathway. Sci Rep. 2015 [cited 2019 Jan 07];5:8572.
- Sturtevant AH. The effects of unequal crossing over at the bar locus in Drosophila. Genetics. 1925;10:117–147.
- Gierman HJ, Indemans MH, Koster J. Domain-wide regulation of gene expression in the human genome. Genome Res. 2007;17:1286–1295.
- Jakočiūnas T, Jensen MK, Keasling JD. CRISPR/Cas9 advances engineering of microbial cell factories. Metab Eng. 2016;34:44–59.
- Lee JS, Grav LM, Pedersen LE. Accelerated homology-directed targeted integration of transgenes in Chinese hamster ovary cells via CRISPR/Cas9 and fluorescent enrichment. Biotechnol Bioeng. 2016;113:2513–2518.
- de Vree PJP, de Wit E, Yilmaz M, et al. Targeted sequencing by proximity ligation for comprehensive variant detection and local haplotyping. Nat Biotechnol. 2014;32:1019–1025.
- Gaidukov L, Wroblewska L, Teague B, et al. A multi-landing pad DNA integration platform for mammalian cell engineering. Nucleic Acids Res. 2018;46:4072–4086.
- Zhang JJ, Liu KD, Qian K, et al. Construction of CHO cell stably expressing GLP-1 analogue and study of its culture process. China Biotechnol. 2017;37:52–58.
- Laufs S, Gentner B, Nagy KZ, et al. Retroviral vector integration occurs in preferred genomic targets of human bone marrow-repopulating cells. Blood. 2003;101:2191–2198.
- Silvers RM, Schowalter M, Litwin S, et al. Modification of integration site preferences of an HIV-1-based vector by expression of a novel synthetic protein. Human Gene Ther. 2010;21:337–349.
- Zanatta DB, Tsujita M, Borelli P, et al. Genetic barcode sequencing for screening altered population dynamics of hematopoietic stem cells transduced with lentivirus. Mol Ther Methods Clin Dev. 2014;1:14052. [cited 2019 Jan 07];
- Kaas C, Kristensen C, Betenbaugh MJ, et al. Sequencing the CHO DXB11 genome reveals regional variations in genomic stability and haploidy. BMC Genomics. 2015 [cited 2019 Jan 07];16:1391.
- Nightingale SJ, Hollis RP, Pepper KA, et al. Transient gene expression by nonintegrating lentiviral vectors. Mol Ther. 2006;13:1121–1132.
- Gilbert LA, Horlbeck MA, Adamson B, et al. Genome-Scale CRISPR-Mediated Control of Gene Repression and Activation. Cell. 2014;159:647–661.
- Shalem O, Sanjana NE, Hartenian E, et al. Genome-scale CRISPR-Cas9 knockout screening in human cells. Science. 2014;343:84–87.
- Wang T, Wei JJ, Sabatini DM, et al. Genetic screens in human cells using the CRISPR-Cas9 system. Science. 2014 343:80–84.
- Kim M, O'Callaghan PM, Droms KA, et al. A mechanistic understanding of production instability in CHO cell lines expressing recombinant monoclonal antibodies. Biotechnol Bioeng. 2011;108:2346–2434.