
Abstract
Phosphate-induced-1 (PHI-1) and phosphate-induced-1-like family genes respond to plant hormones such as abscisic acid (ABA), BR (brassinosteroid) and ethylene. To date, very few researches have been done on abiotic stress for PHI-1 genes. In this work, we report 12 rice PHI-1 genes through genome-wide analysis. The 12 OsPHI-1 genes were tandemly arranged into two clusters and nine conserved motifs were found among their amino acid sequences. Microarray data indicated that all the OsPHI-1 genes exhibited identical expression level but different expression patterns: most OsPHI-1 genes were expressed intensively in panicle development and responded to IAA and BAP treatments; several OsPHI-1 genes responded to trans-zeatin (tZ) and dimethyl sulfoxide (DMSO) treatments; 11 OsPHI-1 genes showed response to abiotic stress. Furthermore, the promoter region analysis showed that all the OsPHI-1 genes contained cis-regulatory elements responding to abiotic stresses. Our study will be helpful to further investigate the biological functions of PHI-1 genes in rice.
Introduction
As one of the most important crops, rice (Oryza sativa L.) provides carbohydrates for a large part of the world’s population and is extensively cultivated around the world [Citation1]. Phosphorus (P) is one of the most important nutrients for plant growth and development. It is an integral component of many vital biomolecules, such as DNA, RNA, phospholipids, etc. Due to slow diffusion and high fixation, the majority of P is unavailable for plant uptake although the P content in soil is abundant [Citation2]. To cope with low-P stress conditions, plants have developed some strategies, including increasing phosphatase activity and secretion of organic acids, induction of phosphate transporters and modification of root architecture and morphology [Citation3–5]. These strategies are mediated by changes in the expression levels of numerous genes.
To date, plenty of phosphate-starvation-induced genes have been identified and widely studied. In Arabidopsis, AtPHR1 (Phosphate Starvation Response 1) plays a central role in regulating inorganic phosphate (Pi)-starvation signalling and Pi-homeostasis [Citation6]. Two PHR-like genes, AtPHL2 and AtPHL3 were reported to be involved in the regulation of Pi-starvation responses [Citation7]. Several Pi transport proteins such as PHT1;1, PHT1;4 and PHO1 play vital roles in Pi acquisition and transportation in Arabidopsis [Citation8–10]. BnSPX3 was significantly induced by Pi starvation but not by other nutrients starvation (N, K, S, Fe) or abiotic stresses in Brassica napus [Citation11]. A soybean Pi starvation-induced gene, GmEXPB2, could enhance plant growth and P uptake at both low and high P levels via altering the root system architecture [Citation12]. In rice, OsPTF1 overexpression in plants increased the total root length and root surface area and thus enhanced the instantaneous Pi uptake rate [Citation13]. OsPHR1, OsPHR2, OsPHR3 and OsPHR4 are reportedly involved in Pi-signalling and homeostasis [Citation14]. A WRKY transcription factor, OsWRKY74, increased the P uptake through regulating the root system architecture and Pi-responsive genes [Citation15]. Although the roles of phosphate starvation-induced genes in Pi homeostasis have been extensively investigated, little is known about Pi homeostasis in abiotic stress conditions.
The phosphate-induced-1 (PHI-1) family genes were first identified in tobacco phosphate-starved cell cultures after phosphate addition and were named phi-1 and phi-2 [Citation16, Citation17]. According to the online database Dicots PLAZA 3.0, the PHI-1 gene family (HOM03D000321) contains members in many crop plants, e.g. 19 in potato (Solanum tuberosum L.), 12 in rice (O. sativa L.) and 19 in maize (Zea mays) [Citation18]. The gene phi-1 has some similarity with plasma membrane ATPases, which suggests that it may be involved in some phosphorylation process [Citation16]. It was found that phi-2 shared prominent homology with many bZIP proteins involved in the ABA-signalling pathway [Citation17]. Additionally, phi-1 and phi-2 play a role in stabilising the intracellular pH changes altered by stress conditions in cells, and they also respond to ABA treatment [Citation16, Citation17]. In Arabidopsis, EXORDIUM and EXORDIUM-LIKE (EXO/EXL) genes are PHI-1-LIKE genes because their conserved region (Interpro entry IPR006766; PFAM entry PF04674) contains about 300 amino acids, which almost constitute the complete primary structure [Citation19, Citation20]. The EXO/EXL genes are reported to be involved in brassinosteroid (BR)-promoted plant growth, cell expansion and anoxia and C starvation stress responses [Citation19–21]. A PHI-1-LIKE gene in potato, erg-1, was rapidly induced by ethylene and salicylic acid [Citation22]. Overexpression of EgPHI-1, a PHI-1 gene from Eucalyptus, significantly improved NaCl, mannitol and polyethylene glycol (PEG) stress tolerance compared with WT plants in tobacco [Citation23]. So far very few researches have focused on PHI-1 genes, whose exact functions still remain unclear, particularly in Pi homeostasis and abiotic stress responses.
Microarray can provide preliminary understanding of the global gene response in a few time points and specific tissues under several stress conditions. In this work, the PHI-1 gene family from rice was analyzed based on their full genome sequences and annotations. Comprehensive analysis of expression in several aspects such as different development stages, hormone and abiotic stress treatments was carried out. The main objective of this work was to determine which members of the PHI-1 gene family showed responsiveness to different stress and phytohormone treatments, and finally the most appropriate candidate genes would be subjected into further functional analysis. In the present research, the aim was to characterize the putative and potential physiological and biochemical functions of the OsPHI-1 genes.
Materials and methods
Plant materials and growth conditions
Pei’ai 64S (O. sativa L.) was used as experimental material (provided by Rice Research Institute of Hunan Academy of Agricultural Sciences). Seeds were disinfected with 0.1% mercuric chloride for 10 min and then rinsed three times with distilled water. The seeds were soaked in water for 3 days at 25 °C. The water was changed every day. Afterwards, they were germinated in distilled water for 3 days at 37 °C. The germinated seeds were broadcasted in batches and placed in a net basin. In this study, seedlings were separated into three treatment groups and one control group. The control group was grown in normal physiologic conditions, whereas the treatment groups were subjected to heat, cold and drought stresses, respectively. A portion of seedlings at the five-leaf stage of the treatment groups were used as experimental materials of seedling stage, and the remaining part of the seedlings were used at flowering and booting stages. All experiments were performed in three biological and technical replicates.
Cold, heat and drought treatment
For cold treatment, five-leaf-stage seedlings were placed into a PGC15.5 (Percival, USA) climate incubator for 12 h under 4 °C, and seedlings at the booting and heading stages were incubated at 12 °C for 16 h. For heat treatment, the seedlings were put into a climate incubator for 2 h at 45 °C. The control group was placed in another climate incubator at 28 °C and both the treatment and control group were maintained in darkness. For drought treatment, the water of the treatment groups was removed and the seedlings were placed into a scaffold to dry out. At the same time, the control group was kept at the same water level. When the seedlings started curling after 16 h, the leaves were harvested for further experiments.
Sample preparation for RNA isolation
Second leaves (from the top) of treatment and control group were collected. The young panicle or the middle of the flowering spike was harvested. The leaves were cut into pieces and ground using liquid nitrogen. About 100 mg of sample was divided into 1.5 mL centrifuge tubes containing 1.0 mL Trizol reagent (Invitrogen). The reaction mixtures were homogenized by vortexing and the tubes were then sealed up. Finally, the samples were frozen at −70 °C until used.
RNA isolation
Total RNA isolation was performed using the Trizol RNA extraction Kit (Invitrogen) according to the manufacturer’s protocol. The samples stored at −70 °C were taken out of the freezer and were vortexed evenly. Then 200 μL chloroform was added and the mixture was shaken vigorously for about 20 s. The samples were centrifuged for 15 min at 4 °C and 12,000×g. Each supernatant was transferred to another 1.5 mL centrifuge tube and 500 μL isopropanol was added. The samples were precipitated at −40 °C for more than 1 h and finally centrifuged to isolate the RNA. The isolated RNA was rinsed twice using 75% ethanol, air-dried and then dissolved in RNase-free water. RNA purity was determined by an A260/280 nm absorbance ratio between 1.9 and 2.0. After testing the purity and integrity of 5S and 18S as well as 28S rRNA, the RNA samples were immediately stored at −70 °C in a freezer.
Microarray
Affymetrix expression microarray experiments were performed on the basis of the GeneTech manual (Biotechnology Limited Company, Shanghai, China). The experiment was performed as described in detail by Chen et al. [Citation24].
Microarray data analysis
Microarray data of reproductive development (GSE6893 and GSE7951), auxin and cytokinin response (GSE5167), cytokinin response (GSE6719) and stress treatment (GSE6901) were obtained using the GEO database. The expressions of OsPHI-1 genes under drought, heat and cold stress at the seedling, booting, heading and flowering stages were also analyzed. The Affymetrix CEL files of each gene were imported and analyzed with the Gene Chip Robust Multi-Array method. The IDs of the probe sets, which were present in the Affymetrix rice genome array, represented the PHI-1 genes identified using the Rice Multi-platform Microarray Search tool [Citation25]. Expression analysis was performed to explore whether the transcripts for some of the splice variants showed differential accumulation using the probe sets data of each PHI-1 gene. After normalising the data for all the rice genes presented on the chip, the log signal intensity values for rice probe IDs consistent with PHI-1 genes were extracted as a subset for subsequent analysis. Cluster analysis on rows was performed using log transformation by the Average Linkage rule of Hierarchical clustering.
Phylogenetic analysis
ClustalW (www.ebi.ac.uk/clustalw/) was used for amino acid alignments of all phosphate-induced-1 family genes. To construct the unrooted phylogenetic tree, the neighbour-joining method was used and the result was visualized with the MEGA software [Citation26]. For bootstrap analysis we used 1000 replicates, the p-distance method as well as pairwise gap deletion.
Conserved motifs identification, gene structure analysis and localisation prediction
To investigate the conserved motifs of PHI-1 members, the complete amino acid sequences of PHI-1 proteins were analyzed using MEME [Citation27]. The maximum number, minimum width and maximum width of motifs were defined as 10, 6 and 50, respectively. For gene structure analysis, the coding sequence (CDS) and corresponding genomic sequences of PHI-1 genes were downloaded from RGAP [Citation28], and the gene structure was analyzed using GSDS 2.0 [Citation29]. Subcellular localisation prediction was performed by the PSORT program [Citation30].
Promoter analysis
Sequences of the phosphate-induced-1 family genes were obtained from the GRAMENE database and 1500 bp upstream of the translation initiation codon (ATG) were analyzed with Plant-CARE. The results were validated by the PLACE databases.
Results and discussion
Phosphate-induced-1 genes identification and sequence analysis
The sequences of the phosphate-induced-1 genes were retrieved from RGAP and GREMENE database. All the analysis results are presented in . Overall, 12 non-redundant gene loci were predicted in rice. The protein lengths of phosphate-induced-1 genes ranged from 309 to 349 amino acid residues and the predicted molecular masses ranged from 32.2 to 37.2 kDa. Additionally, the predicted pI values ranged from 4.52 to 9.51. The gene sequence analysis showed that all the genes had no introns and all of them had only one exon (). The analysis of the results of SMART and PFAM database indicated that all the genes had phosphate-induced protein 1 conserved region phi-1(PF04674). Using MEME tool to predict the conserved motifs in the PHI-1 genes, a total of 9 conserved motifs were found in their complete primary structure (). It has been revealed that proteins belonging to the same subfamily show highly similar motif distribution, demonstrating that these proteins have close evolutionary relationships [Citation31]. The distributions of these motifs in the amino acid sequences may be conducive to further studies on the diversity of gene functions.
Figure 1. Exon-intron structure (a), sequence alignment and nine conserved characteristic motifs (I-IX) of PHI-1 proteins (b).
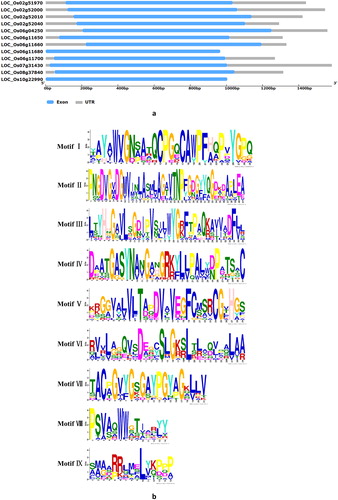
Table 1. Features of the PHI-1 family genes from rice and predicted localization of the PHI-1 proteins.
Furthermore, we predicted the final localisation of the proteins encoded by all OsPHI-1 genes and most of them were located outside the cell. Two ones (LOC_Os08g37840 and LOC_Os10g22990) were located in plasma membrane. LOC_Os06g11700 was located in the endoplasmic reticulum membrane. Pi transport proteins are classified into four families based on their cellular locations and they are all located in the membrane system [Citation32]. The predicted localisations of the proteins encoded by the 12 OsPHI-1 genes indicated that they might be Pi transport proteins involved in Pi uptake and redistribution.
Chromosomal localisation of PHI-1 genes in rice
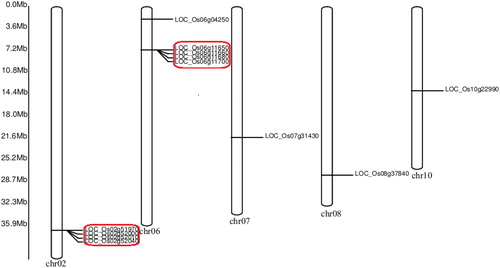
The information about the chromosomal locations of the PHI-1 genes was obtained from RGAP and GRAMENE database ( and ). The 12 PHI-1 genes had distributions in 5 chromosomes in rice. There were 5 genes on chromosome 6 and 4 genes on chromosome 2. There was only one gene presented on chromosome 7, 8 and 10, respectively. In a previous study, the density of tandem genes in rice and Arabidopsis had positive correlation with the recombination rate, for the processes mediated by recombination were involved in tandem duplication [Citation33–35]. The chromosome locations of the PHI-1 genes revealed the clustering of 8 genes on 2 chromosomes. Two clusters of tandemly arranged PHI-1 genes were detected on chromosome 2 and 6, respectively. It has been reported that tandem duplication significantly contributes to gene family expansion and genome evolution [Citation36, Citation37]. In summary, these data suggested that tandem duplication (8 of 12, 66%) played an essential role in the expansion of the rice PHI-1 gene family.
Figure 2. Chromosomal distribution of OsPHI-1 genes.
Note: Two clusters of tandemly arranged OsPHI-1 genes are indicated in red frames.
Phylogenetic analysis of the PHI-1 family in rice and Arabidopsis
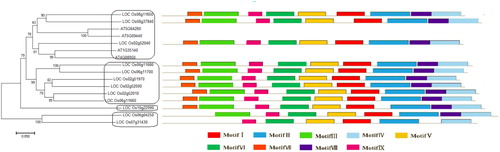
The phylogenetic tree of 12 rice PHI-1 genes and 4 homologous Arabidopsis genes was constructed based on their full length amino acid sequences, and then the evolutionary relationship was investigated. The results showed that all the genes could be divided into 4 subfamilies (). Three genes (LOC_Os02g52040, LOC_Os06g11650 and LOC_Os08g37840) and 4 genes from Arabidopsis belonged to the same subfamily. Three genes (LOC_Os02g51970, LOC_Os02g52000 and LOC_Os02g52010) of the first cluster and three genes (LOC_Os06g11660, LOC_Os06g11680 and LOC_Os06g11700) of the second cluster belonged to the same subfamily. Two genes (LOC_Os06g04250 and LOC_Os07g31430) belonged to the same subfamily. LOC_Os10g22990 was one independent clade. The 12 OsPHI-1 genes exhibited high homology with the Arabidopsis genes, which suggested that these genes shared a common ancestor and might function similarly in biological processes.
Figure 3. Phylogenetic tree of PHI-1 proteins and their classification in Arabidopsis and rice. Note: The unrooted tree was constructed based on multiple sequence alignment of full-length protein sequences using ClustaW by the neighbour-joining method with 1000 bootstrap replicates. The bar indicates 0.05 substitutions per site. Each coloured box with a number represents a specific motif in the protein identified using the MEME motif search tool.
The OsPHI-1 genes were differentially expressed in different tissues
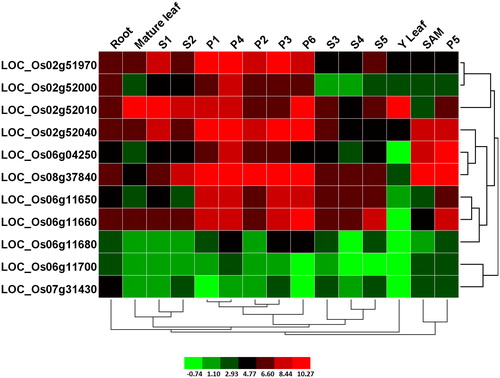
Microarray analysis for rice has been done using the CEL files publicly available in the GEO database [Citation38]. The expression of phosphate-induced-1 genes was studied via microarray data analysis available online and 11 genes were detected by the Affymetrix arrays (). All the 11 genes showed exclusive expressions in various tissues. Most of the genes showed low expressions in roots, leaves, shoot apical meristem (SAM) and seed development. For example, none of the genes was expressed highly in roots. Only 1 gene was expressed highly in mature leaves and young leaves and 3 genes were expressed highly in shoot apical meristem (SAM). Interestingly, most genes showed comparatively higher expressions in panicle development than in other tissues/organs or developmental stages. Furthermore, two genes (LOC_Os02g51970 and LOC_Os06g11660) were restricted to S1 and S5 in seed development respectively. It could be assumed that these genes might perform specific roles in panicle development. Additionally, the expression levels of three genes (LOC_Os06g11680, LOC_Os06g11700 and LOC_Os07g31430) were comparatively low in all tissues/organs or developmental stages. These genes exhibited a differential expression pattern in various tissues.
Figure 4. Expression patterns of rice PHI-1 in various tissues and developmental stages. M, mature leaf; Y, young leaf; SAM, shoot apical meristem; P1–P6, stages of panicle development; S1–S5, stages of seed development. Note: Hierarchical clustering analysis of 11 PHI-1 genes represented on Affymetrix Rice Genome Array is shown. Clustering was done based on average log2 signal values for three biological replicates of each sample after normalisation of the raw data. The colour scale for log signal values is shown at the bottom.
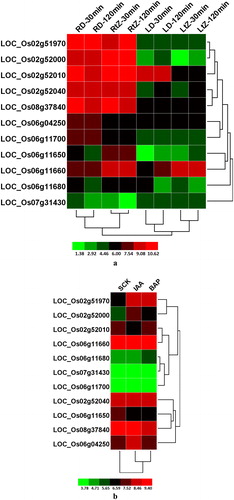
Responses of OsPHI-1 genes to phytohormone treatments
Phytohormones are biomolecules that function as critical regulators in growth and development, as well as stress tolerance in plants [Citation39]. To explore the effect of different kinds of hormones on the expression of OsPHI-1 genes, we performed microarray analysis. In the first dataset, their expression levels were analyzed in the leaves and roots of 15-day-old rice seedlings under DMSO (dimethyl sulfoxide) and tZ (trans-zeatin) treatments for 30 and 120 min (). In the second dataset, the expression levels in 7-day-old seedlings under BAP (benzyl aminopurine) and IAA (indole-3-acetic acid) treatments were investigated (). In total, 11 OsPHI-1 family genes passed the data filter in both the datasets. In the first dataset, the majority of the genes showed expression in roots, only 2 genes (LOC_Os02g52010 and LOC_Os06g11660) showed expression in leaves under tZ or DMSO treatments for 120 or 30 min. In addition, 2 genes (LOC_Os02g52000 and LOC_Os06g11660) were expressed significantly higher after tZ treatment than after DMSO treatment in roots. Notably, 4 genes (LOC_Os06g04250, LOC_Os06g11650, LOC_Os06g11680 and LOC_Os07g31430) had low expression in roots or leaves under tZ treatment or DMSO treatments. The data analysis suggested that more than half of the 11 genes were expressed differentially under one or two treatments. From the second dataset, three genes (LOC_Os06g11680, LOC_Os06g11700 and LOC_Os07g31430) were barely expressed before or after treatments. The expressions of most genes exhibited a differential pattern after treatments. For example, the expression level of LOC_Os02g51970 was up-regulated after BAP and IAA treatments, but LOC_Os06g11650 was down-regulated. Some genes showed high expression level but the level did not alter after BAP and IAA treatments.
Figure 5. Differential OsPHI-1 expression following hormone treatment. (a) Two-week-old seedlings treated with tZ and DMSO for 30 and 120 min; (b) 7-day-old rice seedlings treated with IAA and BAP. RD, root tissues following treatment with DMSO; Rt, root tissues following treatment with tZ; LD, leaf tissues following treatment with DMSO; Lt, leaf tissues following treatment with tZ; SCK, 7-day-old rice seedlings; S-IAA, 7-day-old rice seedlings treated with indole-3-acetic acid; S-BAP, 7-day-old rice seedlings treated with benzyl aminopurine. Note: Clustering was done based on log2 signal values for three biological replicates of each sample after normalisation of the raw data. The colour scale for log signal values is shown at the bottom.
Expression of OsPHI-1 gene family genes under abiotic stress treatments
According to the microarray dataset, the 11 OsPHI-1 family genes met the screening criteria and were also differentially expressed in different development stages under drought, heat and cold stress conditions (). To conduct differential expression analysis, we treated seven-day old rice seedlings with drought, salt and cold stress by comparison with mock-treated control seedlings. In total 11 OsPHI-1 family genes passed through data screening (). The microarray analysis of 11 genes after treatment with drought, heat and cold stress at the seedling, booting, heading and flowering stages showed that all the genes were down- or up-regulated at least 2-fold in at least one of the stress conditions (). LOC_Os02g51970 was up-regulated in the leaves and spikes at the seedling, booting, heading and flowering stages under all the stress treatments, and the maximum expression level was up to 774.48-fold in leaves under cold stress. All members of the first cluster were up-regulated in leaves at the seedling and booting stages under cold and drought stresses, and some of them were down-regulated under heat stress. For example, LOC_Os02g52000 was down-regulated in spikes at the heading and flowering stage under heat stress, whereas LOC_Os02g52010 was down-regulated in leaves and spikes at the booting, heading and flowering stages under heat stress. All members of the second cluster were up-regulated in spikes at the heading and flowering stages under heat stress, and additionally they were up- or down-regulated under cold and drought stresses. For example, LOC_Os06g11650 was up-regulated in leaves and spikes at the seedling and booting stages but down-regulated in spikes at the heading and flowering stage under cold stress. LOC_Os06g11700 was down-regulated in leaves but up-regulated in spikes at the booting stage under cold and drought stresses. In addition to the members of these two clusters, other genes also showed up- or down-regulated expression under drought, heat and cold stress conditions. In the microarray analysis performed on 7-day-old seedlings, LOC_Os02g51970 and LOC_Os02g52010 were up-regulated under all three stresses, LOC_Os02g52010 was up-regulated only under cold stress, LOC_Os06g11660 was up-regulated under drought and salt stresses, and LOC_Os08g37840 was up-regulated under drought and cold stresses. On the contrary, LOC_Os02g52040 was down-regulated under drought and cold stress.
Figure 6. Differential expression of rice PHI-1 genes in response to abiotic stresses. (a) Differential developmental stages under various abiotic conditions; (b) 7-day-old young seedlings under abiotic stresses; (c) the genes up-regulated or down-regulated by more than twofold in any of the three abiotic stresses as compared with CK. 1, seedling stage; 2, booting stage; 3, heading and flowering stage; L, leaf; S, spike; C, cold stress; D, dehydration stress; H, high temperature stress; CK, as compared with an untreated seedling. The colour bar representing log2 signal values is shown at the bottom.
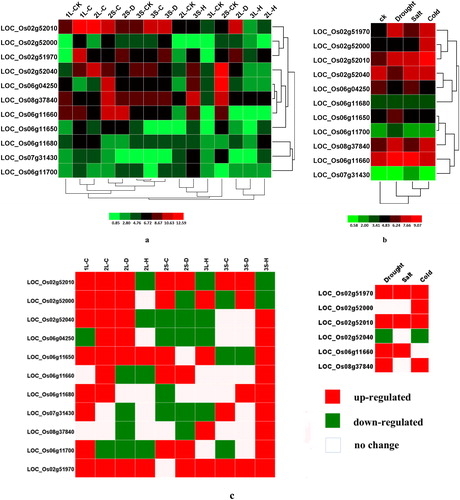
Abiotic stresses such as heat, cold, drought commonly exist in natural environment and they have adverse influences on plant growth, development and productivity [Citation40]. To cope with environmental constrains, plans have to make changes on the cellular and molecular level, but at the cost of yield reduction [Citation41]. However, gene engineering provides a way to improve the stress tolerance of plants with little yield reduction. In our study, most of the OsPHI-1 genes showed responses to at least one of the abiotic stresses, indicating that they could potentially play important roles in the abiotic stress response in rice.
Promoter region analysis of OsPHI-1 genes
In order to investigate the mechanisms of regulation of the phosphate-induced-1 family genes involved in abiotic stress response, 1500 bp sequences upstream of ATG were analyzed for stress-related promoter elements. The analysis revealed 19 kinds of cis-regulatory elements (CREs) related to abiotic stress (). Moreover, their abundance obtained from the Plant-CARE database is shown in . ABRE was found in all the 12 phosphate-induced-1 family genes, and 11 members (except for LOC_Os08g37840) of them contained the CGTCA-motif and TGACG-motif. Seven CREs (ARE, MBS, HSE, TC-rich repeats, GARE-motif, TCA-element and O2-site) were distributed in 6 to 9 genes, followed by seven CREs (LTR, GC-motif, P-box, Motif IIb, TGA-element, CCAAT-box and AuxRR-core), which were distributed in 2 to 5 genes. ERE and MRE were only present in one gene (LOC_Os08g37840). ABA (abscisic acid) plays a central role in abiotic stress response and ABRE is involved in ABA-dependent signal transduction in plants [Citation42]. All the OsPHI-1 genes may be involved in abiotic stress response in an ABA-dependent way. The existence of other stress-related CREs also suggests that these genes may be involved in the adaptation to abiotic stress in an ABA-independent way in rice.
Figure 7. Putative regulatory cis-elements in 5′-upstream regions of the PHI-1 gene promoter in rice. Note: The colour bars represent each cis-element on the Z axis; the gene names are on the X axis; the Y axis represents the abundance of the cis-elements.
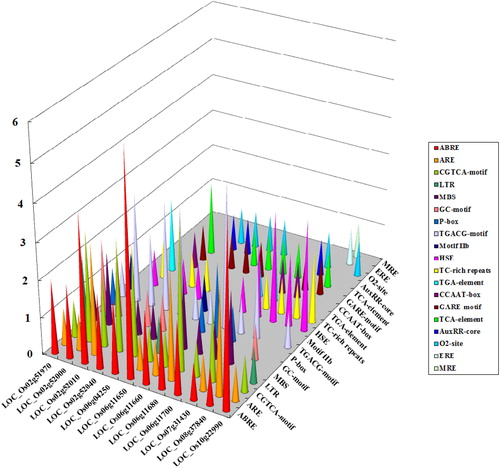
Table 2. Putative regulatory cis-elements in the 5′-upstream regions of PHI-1 genes in rice.
Conclusions
In our study, a comprehensive analysis of 12 OsPHI-1 genes was performed, including chromosomal location, gene duplication, gene structure, functional domains, conserved motifs, cis-regulatory elements and online microarray data, etc. Affymetrix expression microarray experiments for OsPHI-1 genes treated with drought, salt, heat and cold stress at the seedling, booting, heading and flowering stages revealed that most of the OsPHI-1 genes responded to all these stresses. Our study provides valuable information about rice phosphate-induced-1 family genes in response to environmental stress, which is conducive to further characterisation of their biological roles in stress responsiveness.
Disclosure statement
No potential conflict of interest was reported by the authors.
Additional information
Funding
Related Research Data
References
- Cao X, Liao Y, Rong S, et al. Identification and characterization of a novel abiotic stress responsive sulphotransferase gene (OsSOT9) from rice. Biotechnol Biotechnol Equip. 2016;30:227–235.
- Shen J, Yuan L, Zhang J, et al. Phosphorus dynamics: from soil to plant. Plant Physiol. 2011;156:997–1005.
- Wasaki J, Yamamura T, Shinano T, et al. Secreted acid phosphatase is expressed in cluster roots of lupin in response to phosphorus deficiency. Plant Soil. 2003;248:129–136.
- Devaiah BN, Nagarajan VK, Raghothama KG. Phosphate homeostasis and root development in Arabidopsis are synchronized by the zinc finger transcription factor ZAT6. Plant Physiol. 2007;145:147–159.
- Ai P, Sun SJ, Fan X, et al. Two rice phosphate transporters, OsPht1;2 and OsPht1;6, have different functions and kinetic properties in uptake and translocation. Plant J. 2009;57:798–809.
- Rubio V, Linhares F, Solano R, et al. A conserved MYB transcription factor involved in phosphate starvation signaling both in vascular plants and in unicellular algae. Genes Dev. 2001;15:2122–2133.
- Sun L, Song L, Zhang Y, et al. Arabidopsis PHL2 and PHR1 act redundantly as the key components of the central regulatory system controlling transcriptional responses to phosphate starvation. Plant Physiol. 2016;170:499–514.
- Shin H, Shin H-S, Dewbre GR, et al. Phosphate transport in Arabidopsis: Pht1;1 and Pht1;4 play a major role in phosphate acquisition from both low- and high-phosphate environments. Plant J. 2004;39:629–642.
- Stefanovic A, Arpat AB, Bligny R, et al. Over-expression of PHO1 in Arabidopsis leaves reveals its role in mediating phosphate efflux. Plant J. 2011;66:689–699.
- Wege S, Khan GA, Jung JY, et al. The EXS domain of PHO1 participates in the response of shoots to phosphate deficiency via a root-to-shoot signal. Plant Physiol. 2016;170:385–400.
- Yang G, Ding G, Shi L, et al. Characterization of phosphorus starvation-induced gene BnSPX3 in Brassica napus. Plant Soil. 2012;350:339–351.
- Guo W, Zhao J, Li X, et al. A soybean β-expansin gene GmEXPB2 intrinsically involved in root system architecture responses to abiotic stresses. Plant J. 2011;66:541–552.
- Yi K, Wu Z, Zhou J, et al. OsPTF1, a novel transcription factor involved in tolerance to phosphate starvation in rice. Plant Physiol. 2005;138:2087–2096.
- Ruan W, Guo M, Wu P, et al. Phosphate starvation induced OsPHR4 mediates Pi-signaling and homeostasis in rice. Plant Mol Biol. 2016;93:1–14.
- Dai X, Wang Y, Zhang WH. OsWRKY74, a WRKY transcription factor, modulates tolerance to phosphate starvation in rice. J Exp Bot. 2016;67:947–960.
- Sano T, Kuraya Y, Amino S, et al. Phosphate as a limiting factor for the cell division of tobacco BY-2 cells. Plant Cell Physiol. 1999;40:1–8.
- Sano T, Nagata T. The possible involvement of a phosphate-induced transcription factor encoded by Phi-2 gene from tobacco in ABA-signaling pathways. Plant Cell Physiol. 2002;43:12–20.
- Sebastian P, Michiel VB, Dries V, et al. PLAZA 3.0: an access point for plant comparative genomics. Nucleic Acids Res. 2015;43:974–981.
- Farrar K, Evans IM, Topping JF, et al. EXORDIUM – a gene expressed in proliferating cells and with a role in meristem function, identified by promoter trapping in Arabidopsis. Plant J. 2003;33:61–73.
- Schröder F, Lisso J, Müssig C. Expression pattern and putative function of EXL1 and homologous genes in Arabidopsis. Plant Signal Behav. 2012;7:22–27.
- Schröder F, Lisso J, Lange P, et al. The extracellular EXO protein mediates cell expansion in Arabidopsis leaves. BMC Plant Biol. 2009;9:20.
- Dellagi A, Birch PRJ, Heilbronn J, et al. A potato gene, erg-1, is rapidly induced by Erwinia carotovora ssp. atroseptica, Phytophthora infestans, ethylene and salicylic acid. J Plant Physiol. 2000;157:201–205.
- Sousa AO, Assis ET, Pirovani CP, et al. Phosphate-induced-1 gene from Eucalyptus (EgPHI-1) enhances osmotic stress tolerance in transgenic tobacco. Genet Mol Res. 2014;13:1579–1588.
- Chen R, Jiang Y, Dong J, et al. Genome-wide analysis and environmental response profiling of SOT family genes in rice (Oryza sativa). Genes Genom. 2012;34:549–560.
- Saeed AI, Sharov V, White J, et al. TM4: a free, open-source system for microarray data management and analysis. BioTechniques. 2003;34:374–378.
- Kumar S, Stecher G, Tamura K. MEGA7: molecular evolutionary genetics analysis version 7.0 for bigger datasets. Mol Biol Evol. 2016;33:1870–1874.
- Bailey TL, Boden M, Buske FA, et al. MEME Suite: tools for motif discovery and searching. Nucleic Acids Res. 2009;37:202–208.
- Kawahara Y. Improvement of the Oryza sativa Nipponbare reference genome using next generation sequence and optical map data. Rice. 2013;6:1–10.
- Hu B, Jin J, Guo A-Y, et al. GSDS 2.0: an upgraded gene feature visualization server. Bioinformatics. 2015;31:1296–1297.
- Nakai K, Horton P. PSORT: a program for detecting sorting signals in proteins and predicting their subcellular localization. Trends Biochem Sci. 1999;24:34–36.
- Wang YX, Liu ZW, Wu ZJ, et al. Transcriptome-wide identification and expression analysis of the NAC gene family in tea plant [Camellia sinensis (L.) O. Kuntze]. PLoS One. 2016;11:e0166727.
- Andrzej P, Maria BP, Aleksandra SB, et al. Heat stress affects Pi-related genes expression and inorganic phosphate deposition/accumulation in barley. Front Plant Sci. 2016;7:926.
- Force A, Lynch M, Pickett FB, et al. Preservation of duplicate genes by complementary, degenerative mutations. Genetics. 1999;151:1531–1545.
- Carene R, Loic P, Gaut BS. Striking similarities in the genomic distribution of tandemly arrayed genes in Arabidopsis and rice. PLoS Comput Biol. 2006;2:e115.
- Freeling M. Bias in plant gene content following different sorts of duplication: tandem, whole-genome, segmental, or by transposition. Annu Rev Plant Biol. 2009;60:433–453.
- Jiang SY, González JM, Ramachandran S. Comparative genomic and transcriptomic analysis of tandemly and segmentally duplicated genes in rice. PLoS One. 2013;8:e63551.
- Qiao X, Yin H, Li L, et al. Different modes of gene duplication show divergent evolutionary patterns and contribute differently to the expansion of gene families involved in important fruit traits in pear (Pyrus bretschneideri). Front Plant Sci. 2018;9:161.
- Kumar S, Asif MH, Chakrabarty D, et al. Differential expression of rice lambda class GST gene family members during plant growth, development, and in response to stress conditions. Plant Mol Biol Rep. 2013;31:569–580.
- Fahad S, Hussain S, Bano A, et al. Potential role of phytohormones and plant growth-promoting rhizobacteria in abiotic stresses: consequences for changing environment. Environ Sci Pollut Res. 2015;22:4907–4921.
- Liu S, Cao X, Liao Y, et al. Identification and characterization of a novel abiotic stress responsive ATPase gene from rice. Plant Omics. 2015;8:169–177.
- Herms DA, Mattson WJ. The Dilemma of plants: to grow or defend. Q Rev Biol. 1992;67:283–335.
- Narusaka Y, Nakashima K, Shinwari ZK, et al. Interaction between two cis-acting elements, ABRE and DRE, in ABA-dependent expression of Arabidopsis rd29A gene in response to dehydration and high-salinity stresses. Plant J. 2003;34:137–148.