
 ?Mathematical formulae have been encoded as MathML and are displayed in this HTML version using MathJax in order to improve their display. Uncheck the box to turn MathJax off. This feature requires Javascript. Click on a formula to zoom.
Abstract
RNA-binding proteins (RBPs) play a significant role in many cellular processes and regulation of gene expression, therefore, accurately identifying the RNA-interacting residues in protein sequences is crucial to detect the structure of RBPs and infer their function for new drug design. The protein sequence as basic information has been widely used in many protein researches with the combination of machine learning techniques. Here, we propose a sequence-based method to predict the RNA-protein interacting residues in protein sequences. The prediction method is composed of two predictors including a feature-based predictor and a sequence template-based predictor. The feature-based predictor applies the random forest (RF) classifier with the protein sequence information. After getting the classification probability, an adjustment procedure is used in consideration of neighbouring correlation between RNA interacting residues. The sequence template-based predictor selects the optimal template of the query sequence by multiple sequence alignment and matches the interacting residues in template sequence into the query sequence. With the combination of two predictors, the coverage and prediction performance of our method have been greatly improved, the MCC value increases from 0.467 and 0.352 to 0.499 in our validation set. In order to evaluate our proposed method, an independent testing set is utilized to compare with other two hybrid methods. As a result, our method achieves better performance than the other two methods with an overall accuracy of 0.817, an MCC value of 0.511 and an F-score of 0.605, which demonstrates that our method can reliably predict the RNA interacting residues in protein sequences. Moreover, the effectiveness of our newly proposed adjustment procedure in the feature-based predictor is examined and analyzed in detail.
Introduction
RNA-interacting protein residues have been proved significant to a number of biological processes, such as gene expression regulation [Citation1,Citation2], viral replication [Citation3,Citation4], RNA transport [Citation5,Citation6] and regulation of RNA levels in cells [Citation7]. More and more evidence has shown that RNA is involved with many human diseases [Citation8–11] such as Alzheimer [Citation12,Citation13] and cancers [Citation14–17]. With the development of experimental techniques such as X-ray crystallography and nuclear magnetic resonance (NMR), many RNA-binding proteins (RBPs) with known structures have been detected. However, there is still a huge gap between the experimentally solved RBPs and existing RBPs in nature. The experimental methods are usually accompanied with high cost of money and time, which limits the experimental speed and wide application. Consequently, the computational method which combines the biological information and machine learning technique has been proposed to complement the drawbacks of experimental techniques.
Machine learning is an interdisciplinary field which utilizes the computer to simulate the learning activity of human beings and solve actual problems. Based on static input information and algorithms, machine learning constructs models with dynamic identifying ability to realize prediction for new data. By acquiring new information and reorganizing the structure of known knowledge, the machine learning constantly improves its performance. With the development of computational performance, machine learning has been successfully applied in many fields such as filter of E-mail, detection of network invasion and medical image identification. According to the category of input data, the computational methods to predict RNA interacting residues based on machine learning can be divided into two kinds [Citation18,Citation19]: (1) sequence-based method, which applies the protein amino acid sequence as the input and extracts all features from the sequence information and (2) structure-based method, which uses the structure-derived features of the query residue to make the prediction. However, the number of proteins with known structural information is relatively smaller than the number of proteins with known sequence information, because the amino acid sequence of a protein is one of the most fundamental types of information to collect, thus it is vastly available in databases. For example, the Protein Data Bank (PDB) [Citation20], which is one of the most widely used protein structure databases, has the record number of about 145,690 sequences (as of October 2018), whereas Swiss-Prot [Citation21], which is a manually curated protein sequence database, has the record number of about 558,590 sequences (as of October 2018). Therefore, the accurate prediction of RNA-interacting protein residues based on sequence information has easier availability and huge potential for wide application.
With the development of knowledge about protein sequences, many sequence-based prediction methods of RNA-interacting protein residues have been proposed in recent years. In 2006, Wang and Brown [Citation22] developed BindN, which uses support vector machines (SVMs) combined with the chemical biological properties such as the side chain pKa value, hydrophobicity index and molecular mass. After using the sliding window technique, BindN achieved a maximum accuracy of 69.32%. In 2008, Kumar et al. [Citation23] developed Pprint, which involves the position-specific scoring matrices (PSSMs) generated by PSI-BLAST, and improved the accuracy from 76.87% to 81.16% on their main dataset. Cheng et al. [Citation24] proposed RNAProB by smoothing the PSSM profiles with the correlation of the evolutionary conservation score between neighbouring residues in the profile. In 2014, Walia et al. [Citation25] proposed a hybrid predictor named RNABindRPlus. It contains two predictors: a homology-based predictor named HomPRIP and a feature-based predictor called SVMopt. HomPRIP firstly runs a BLAST search against the Protein-RNA Interface Database (PRIDB) [Citation26] for the query sequence to obtain the homologous sequences with known RNA interacting residues. Then, for each homologous sequence, a weight is given by a regression algorithm based on the conservation score between the query sequence and the homologous sequence. Finally, a weighted nearest neighbour classifier is applied to infer the RNA interacting residues of the query sequence based on its closest homologous sequence with known RNA interacting residues. The feature-based predictor SVMopt uses a trained SVM classifier to make prediction for each residue in the query sequence. The final prediction result is generated by optimally combining the outputs of the two predictors with a logistic regression model. Similarly, Yang et al. [Citation27] developed another hybrid predictor called SNBRFinder, which includes a template-based predictor called and a feature-based predictor
The
predictor transfers the query sequence and the template sequences into hidden Markov models (HMMs) by searching against Uniprot20. Then the HMM of the query sequence is compared with all the template HMMs to select the most homologous template and accomplish the template-based prediction by matching the known RNA interacting residues in the template sequence into the query sequence. The difference between HomPRIP and
is that HomPRIP applies the sequence homology alignment which is generated by BLAST search, while
applies the profile–profile alignment which is generated by HHblits [Citation28].
is also an SVM-based classifier based on a variety of features such as residue conservation scores, predicted structural features and physicochemical properties. The final prediction result of SNBRFinder is the linear combination of the two predictors. The hybrid or ensemble idea implemented in these two methods has given insights when developing new approaches of predicting RNA-interacting protein residues. Despite these pioneering works, the prediction performance of RNA interacting residues can still be improved. After carefully observing the known structure and sequence data of RNA–protein complexes, we find that the RNA-interacting residues in protein sequences tend to form many small sequence segments. Each sequence segment is often constructed by a list of interacting resides which are continuous in protein sequences. In other words, for an RNA-interacting residue, its neighbouring residues also have higher possibility to be interacting residues. This can be explained by the fact that an interacting residue is defined as such if the distance between any of its atoms and the bound RNA is closer than a cut-off value [Citation29]. In the three-dimensional structure of a protein complex, the distance between the neighbouring residues is usually not far away because of the secondary structure such as α-helix and β-barrel. Therefore, the distance between neighbouring residues and the bound RNA is probably close to the distance between the interacting residue and the bound RNA. This neighbouring correlation between residues should be carefully considered in the prediction process, whereas previous studies have not taken this into consideration.
Based on this background, we develop a sequence-based method which can effectively identify the RNA-interacting residues in protein sequences. The prediction results are combinations of two predictors including a feature-based predictor and a complementary sequence template-based predictor. The feature-based predictor extracts three types of features including biochemical features, evolutionary information and evolutionary co-variation score from protein sequences. After getting the classification probability from the random forest (RF) classifier, an adjustment procedure is applied in consideration of the neighbouring correlation between the interacting residue and its adjacent residues. The sequence template-based predictor searches for the homologous sequences for the query sequence from the training set. The residue that matches the interacting residue in the template is labelled as interacting. On the independent testing set, our proposed method achieves better performance than the other two recently developed hybrid prediction methods, with an overall accuracy of 0.817, an MCC value of 0.511 and an F-score of 0.605, which indicates that our method is efficient to provide assistance in site-directed researches for functional RBPs.
Materials and methods
Dataset
The datasets we use include RB344, RB86 and RB44. The RB344 is used as a training set in our feature-based predictor and a template database in the sequence template-based predictor. Then, RB86 is used as the validation set to adjust the parameters during the training process. Finally, RB44 is considered as the independent testing set to evaluate the prediction performance of our proposed method and make comparison with other existing methods.
RB344
The RB344 is a non-redundant dataset which contains 344 proteins used in a previous study [Citation30]. The categories of proteins contain RNAse, SRP, aptamer, dsRNA, exosome, mRNA, ribosomal, small, snRNP, splicing, tRNA, viral and others, which leads to the advantage of quantity and variety. The sequence identities in RB344 are below 30%. The RNA interacting residues are defined in two aspects: (1) a residue any atom of whose is at a 5 Å distance from any atom in a nucleotide, and (2) residues involved in van-der-Waals, hydrogen-bonding, hydrophobic or electrostatic interactions with nucleotides. The RB344 dataset is used as the training set to construct our prediction model and the template database for homology search.
RB86
The RB86 dataset was developed by Ahmad et al. [Citation31] and was used in Kumar’s study [Citation23] and Cheng’s study [Citation24]. The chains are extracted from protein-RNA complexes with a resolution better than 3.5 Å. The sequence redundancy is firstly removed among the dataset to make the sequence identity less than 70%. Then, the cd-hit-2d [Citation32] is applied to remove the sequences in RB86 which have a sequence identity greater than 40% with the sequences in the template database RB344. The purpose of doing that is to keep RB86 independent from RB344. The RB86 dataset can be seen as the validation set which is used to adjust the parameters and demonstrate the effectiveness of our proposed method. The interacting residues are defined according to the original criterion in the references.
RB44
The RB44 dataset was created by Puton et al. [Citation18] in their study to evaluate the prediction performance of various methods. Therefore, it is independent and not sequence-similar to proteins which are used to train other existing prediction methods. The cd-hit-2d is applied to make sure the sequence identities between the RB44 and RB344, the RB44 and RB86 are under 40%. The RB44 dataset can be seen as the testing set which is used to compare our prediction performance with other existing methods.
Feature-based predictor
Feature representation
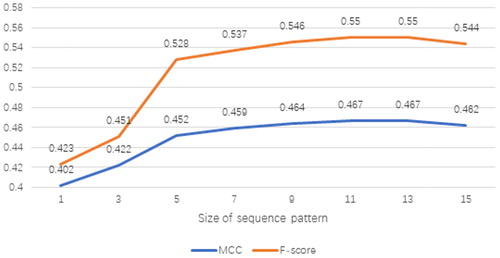
For each protein sequence, we create overlapping patterns by using the sliding window technique. The sequence pattern with length L consists of the target residue and its (L − 1)/2 neighbouring residues on its left and right side respectively. The sequence pattern is applied because apart from the target residue, its neighbouring residues also have impact on its biological function. In this study, we set L = 11 by experimental attempts. We also tried different sizes for sequence patterns other than 11; however, they did not achieve performance as significant as sequence pattern L on the validation set. The prediction performance for different sizes of the sequence pattern on validation set RB86 is shown in .
Figure 1. Prediction performance for different sizes of sequence pattern on validation set RB86.
Sequence representation and biochemical features. The protein sequence representation can be reflected by the amino acid composition. For each query residue in the protein sequence, the binary code is used to construct a 20-dimensional vector which represents the type of query residue. The 20 types of amino acids are encoded as shown in .
Table 1. The one-hot binary encoding for 20 types of amino acids.
The biochemical features include the side chain pKa value and the hydrophobicity. The side chain pKa value is an important factor in defining the pH-dependent characteristics of the residue. The side chain pKa value is collected from Nelson and Cox’s work [Citation33]. For the amino acid with no side chain pKa value, the feature value is set to 7. The hydrophobicity is a key factor for residue side chain packing. The hydrophobic residues are often found inside globular proteins, while under-represented at the protein–RNA interacting interface. The hydrophobicity of each kind of amino acid is described by the hydrophobic index created by Sweet and Eisenberg [Citation34]. The pKa value and hydrophobicity index are one-dimensional vectors for each amino acid.
Therefore, for each sequence pattern with length = 11, the sequence representation and biochemical features are 11*(20 + 1 + 1) = 242 dimensional vectors.
The evolutionary information feature. The evolutionary information has been proved effective in RNA-interacting protein residues prediction and other bioinformatics problems [Citation35]. PSSM is a common representation for evolutionary information and Kumar et al. [Citation23] have shown its effectiveness to improve the prediction performance. The PSSM for a query protein in this study is generated from multiple sequence alignment by running PSI-BLAST [Citation36] against the Swiss-Prot database. For a query protein with the sequence length N, the PSSM is represented by a matrix with N*20 dimensions. The 20 columns strand for the 20 amino acids. Before extracting features from PSSM, all the values in PSSM should be normalized between 0 and 1 by applying EquationEquation (1)(1)
(1) : Where
is the normalized value and
is the original value in PSSM.
(1)
(1)
Inspired by Zhou’s study [Citation37] in DNA-interacting protein residues prediction, we extract three categories of evolutionary information from PSSM including the residue conservation, pair-relationship and multi-relationship. For a target residue Ri, its sequence pattern PSSM can be represented as follows:
Where represents the value of residue type r at sequence position i in PSSM.
The residue conservation is calculated by collecting the conservation value of the target residue and its adjacent residues in the sequence pattern. For a sequence pattern with length = 11, the dimension of residue conservation is 20*11 = 220.
The pair-relationship stands for the pair-wise relationship between the target residue and its adjacent residues. For the target residue Ri and its adjacent residue Ri + 1, the pair-wise relationship is calculated by
(2)
(2)
Where r1,r2 represent different types of residues among the 20 standard residue types. Therefore, for each pair-wise relationship between two residues, the has 400 dimensions. For a sequence pattern, the pair-relationship is defined as the sum of pair-wise relationships between the target residue and all its adjacent residues in the sequence pattern, which makes the dimension of the vector still 400.
The multi-relationship represents the evolutionary information among multiple residues. We extract two kinds of multi-relationship, including the left multi-relationship, which contains the target residue Ri and its left adjacent residues such as Ri − 1, Ri − 2, …, Ri − 5 in the sequence pattern, and the right multi-relationship, which contains the target residue Ri and its right adjacent residues such as Ri + 2, Ri + 2, …, Ri + 5 in the sequence pattern. The left and right multi-relationship can be calculated as follows:
(3)
(3)
(4)
(4)
Where r represents different types of residues among the 20 standard residue types. Therefore, for a sequence pattern with length = 11, the dimension of the multi-relationships is 20*2 = 40.
In conclusion, three types of evolutionary information extract total dimension of 220 + 400 + 40 = 660 feature vectors.
The evolutionary co-variation score. In 2004, Dekker and Fodor [Citation38] developed an algorithm that calculates the evolutionary correlation in multiple sequence alignment between two residues in protein sequence called Explicit Likelihood of Subset Co-variation (ELSC). Some evidence has shown that the evolutionary correlated residues in a protein can work together to define its structure and facilitate its function [Citation39–41]. The ELSC seeks a co-variation score for a pair of residues in protein sequence at the positions i and j by constraining the type of amino acid at the position i and then examine the effect on the other position j. With a higher co-variation score, the two amino acids are supposed to occur simultaneously in the evolutionary history, which means they may cooperate with each other to fulfil certain functions.
For a sequence pattern in this study, the ELSC algorithm is used to calculate the pair-wise evolutionary co-variation scores between the target residue and its adjacent residues in the sequence pattern. If the target residue has a higher evolutionary co-variation score, it should have a greater potential to be a functional site. With the pattern length = 11, we extract a 10-dimensional vector to reveal the co-variation feature.
Model construction
After extracting features for each sequence pattern, the feature matrix is sent into the classifier. In this study, RF, a novel assembly classifier, is applied. The RF has been successfully used in many fields such as data mining, visual identification and bioinformatics [Citation42]. An RF classifier is constructed by a number of decision trees. The prediction result is collected from the largest number of votes from decision trees. Based on this characteristic, the RF can handle the imbalanced input data which is the situation in RNA-protein interacting residue prediction. The RF algorithm is implemented by the scikit-learn package [Citation43] and default parameters are used during the training process.
When we observe the known sequence of an RNA–protein complex, we find that the interacting residues tend to occur continuously in the protein sequence. Therefore, in order to consider this neighbouring correlation, an adjusting procedure is done as follows: first, we get the probability for each residue to be classified as interacting from the RF model. Then we recheck the protein sequence, for each non-interacting residue which is classified by the RF model. We set an adjustment window including the target residue and its neighbouring residues on the left and right sides, which is similar to the sliding window in the feature extraction process. The size of the adjustment window also needs to be set by experimental attempts. In the adjustment window, the probability of the target residue will be adjusted as follows:
(5)
(5)
Where P(i)original is the original prediction probability of residue i provided by the RF classifier, j is the nearest distance between the target residue and the residue classified as interacting in the adjustment window. If the residue on the left side and the residue
on the right side are both classified as interacting, we will take the larger probability of them. Since the RNA-interacting residue prediction is a binary classification problem, D is set to 2. However, if there is no residue classified as interacting in the adjustment window, the procedure will not be applied.
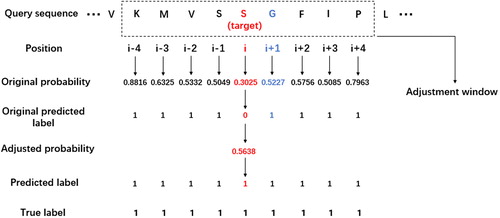
An example of the adjustment procedure is shown in : the size of the adjustment window is set to 9, which means that the adjustment window contains the target residue and 4 adjacent residues on the left and right sides of the target residue. The original probability is given by the RF classifier, and the default threshold is set to 0.5. When the adjustment procedure begins, we first search for the nearest residue which is classified as interacting or whose original probability is larger than 0.5 in other words. In this example, the residues at position i + 1 and i − 1 both meet the requirement. We select the residue at position i + 1 because it has a larger original probability and send it into EquationEquation (5)(5)
(5) to get the adjusted probability of the target residue. The adjusted probability of the target residue
= 0.3025 + 0.5227*
= 0.5638, which is larger than the threshold 0.5; therefore, the predicted label should be changed from 0 to 1 because it is affected by its neighbouring residues. Notably, different weights should be given based on the distance between the target residue and its nearest predicted interacting residue, which means that if the target residue is closer to the predicted interacting residue, it will be more affected by the neighbouring correlation. The determination of the adjustment window’s size will be described in the Results and Discussion section.
Figure 2. An example of adjustment procedure.
Sequence template-based predictor
Besides the feature-based predictor, we also develop a sequence template-based predictor as a complement to our feature-based predictor. The sequence template-based predictor utilizes the sequence homology between the query sequence and sequences in the training set. If two sequences are homologous, the similar segments in the sequence probably have similar functions. In the sequence template-based predictor, the query sequence first searches for the homologous sequences in the training set using the bit-score provided by PSI-BLAST program. If the similarity between the two sequences is larger than a threshold, the predictor will check the similar segments in the training data to figure out whether it contains the RNA-interacting residues or not. If the RNA-interacting residue is included in the similar segment, the corresponding residue in the query sequence will be labelled as interacting. Otherwise, the residues in the query sequence will be labelled as non-interacting. In this study, the bit-score threshold is set to 50.
The flowchart of our prediction method
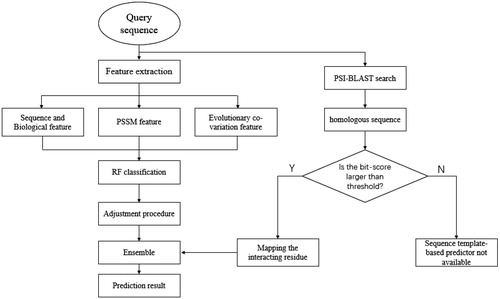
As shown in , the query sequence is sent to the feature-based predictor and the sequence template-based predictor at the same time. For the feature-based predictor, three categories of features are extracted from the query sequence to construct the feature matrix. Then, the feature matrix is taken as input for the RF classifier, and the output of the RF classifier is applied with the adjustment procedure to obtain the prediction result of the feature-based predictor. For the sequence template-based predictor, the PSI-BLAST search is applied for the homologous sequences of the query sequence. If the bit-score between the query sequence and its homologous sequence is larger than the threshold, the residues in the query sequence which are matched to the RNA-interacting residues in the homologous sequence are labelled as interacting, others are labelled as non-interacting. However, if the bit-score is smaller than the threshold, which means we cannot find the homologous sequences in the training set, the sequence template-based predictor will not be available. Finally, an ensemble strategy is used to merge the prediction results from two kinds of predictors to form the final prediction.
Figure 3. The flowchart of our proposed prediction method.
Results and discussion
Performance evaluation
To assess the prediction performance of our proposed method, several evaluation criterions are applied in this work, including the overall accuracy (ACC), the precision which indicates the proportion of true interacting residues in predicted interacting residues, the recall which indicates the proportion that the predicted interacting residues have taken in all the true interacting residues, the F-score which is used to balance the Precision and Recall and Matthews Correlation Coefficient (MCC) which is a comprehensive evaluation index to reflect the performance for the binary classifier. These evaluation indexes can be calculated as follows:
(6)
(6)
(7)
(7)
(8)
(8)
(9)
(9)
(10)
(10)
Where TP, TN, FP, FN represent the number of true positive samples, true negative samples, false positive samples and false negative samples, respectively, in the prediction result.
Effectiveness of adjustment procedure and selection of adjustment window
The previous feature-based classifier does not fully consider the neighbouring correlation between samples, which means that the classification result of each residue is independent. However, in RNA-interacting protein residues prediction, the positive samples tend to occur continuously in the protein sequence. In the training set RB344, more than 83% of RNA-interacting residues appear with neighbouring interacting residues. According to this observation, for each predicted non-interacting residue, we develop an adjustment procedure which may change the classification probability of the non-interacting residue based on the distance between it and its nearest predicted interacting residue in an adjustment window.
We examine the effectiveness of our adjustment procedure on the validation set RB86. With different sizes of the adjustment window, the prediction performance is shown in .
Figure 4. MCC and F-score with respect to different sizes of adjustment windows on validation set RB86.
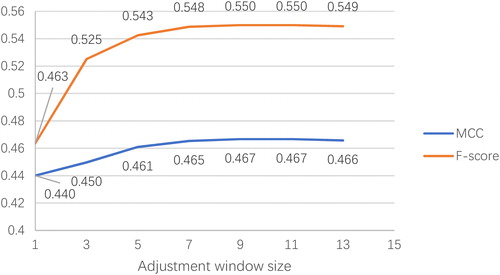
When the size of the adjustment window is 1, which means the adjustment procedure is not applied, the MCC value and F-score are only 0.440 and 0.463, respectively. However, when the size of the adjustment window increases to 3, that is, when we consider the neighbouring correlation between the query residue and its adjacent residues next to it, the F-score improves rapidly to 0.525 and the MCC value also rises to 0.450. With the increase of the adjustment window size, the MCC value and F-score continue to grow until they reach their peak value when the size of the adjustment window is 9. After that, these two values remain stable, even if the adjustment window size continues to grow. illustrates that our adjustment procedure with consideration of neighbouring correlation can effectively improve the prediction performance of RNA-interacting residues compared with the original method which treats every query residue as independent. The optimal size of the adjustment window is 9 as the predictor reaches its best performance.
Performance of feature-based and sequence template-based predictors and ensemble strategy
In this section, we will examine the prediction performance of feature-based and sequence template-based predictors on the validation set RB86, and select an ensemble strategy based on their characteristics.
The upper 2 lines in show the prediction performance of feature-based and sequence template-based predictors on the validation set RB86. We can find that two predictors share the similar characteristic that they both have a relatively higher precision and lower recall, which means their predicted interacting residues are probably true interacting residues, whereas their predicted non-interacting residues may contain true interacting residues. The imbalance between the precision and recall is more severe for the complementary sequence template-based predictor with the precision of 0.744 and the recall of 0.238. This can be explained by the fact that the template database we used in multiple sequence alignment is the training set which has a limitation of quantity and coverage.
Table 2. Prediction performance of single and ensemble predictors on validation set RB86.
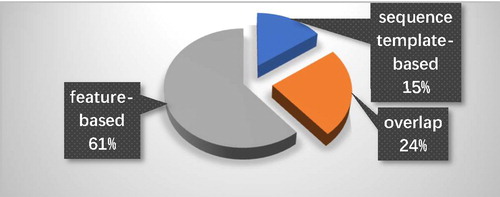
In order to merge the prediction results efficiently and improve the prediction performance, we need to select an ensemble strategy to combine two predictors. describes the proportions of predicted interacting residues provided by different prediction methods. We can find that the feature-based predictor can obtain most of the predicted interacting residues. About 61% of predicted interacting residues can be only provided by the feature-based predictor and about 24% of predicted interacting residues can be provided from both feature-based and sequence template-based predictor, whereas only about 15% are provided by sequence template-based predictor alone and not included in the feature-based predictor’s result. Furthermore, the F-score as a comprehensive evaluation index can reveal the prediction performance when the precision and recall are imbalanced. The F-score of the feature-based predictor and the sequence template-based predictor are 0.5499 and 0.3604, respectively. Therefore, the feature-based predictor has an overall better performance than the sequence template-based predictor. The prediction result of the sequence template-based predictor is regarded as a complement to the final prediction. The higher precision indicates that the two predictors have a satisfying overall accuracy in predicting interacting residues but the coverage of the predicted interacting residues still needs to be improved. Based on this background, we set the ensemble strategy that a query residue will be labelled as interacting if the query residue is classified as interacting by any of the predictors. This ensemble strategy makes the final prediction contain as many predicted interacting residues as possible which efficiently improves the coverage of predicted interacting residues and the overall prediction performance.
Figure 5. The proportion of predicted interacting residues by different prediction methods.
According to , after applying the ensemble strategy in the validation set, the MCC value and F-score grow to 0.499 and 0.591, respectively, which have improved 0.031/0.041 from the feature-based predictor and 0.147/0.231 from the sequence template-based predictor. These improvements have demonstrated that the ensemble strategy we selected can effectively amend the defect of a single predictor and obtain a better performance in the final prediction result.
Performance comparison on independent dataset
RNABindRPlus [Citation25] and SNBRFinder [Citation27] are two methods for prediction of RNA-interacting protein residues which utilize the ensemble idea and combine the outputs from base predictors to construct the final prediction. The RNABindRPlus contains two predictors: the HomPRIP, a homology-based predictor that uses multiple sequence alignment to find the homologous sequences to the query sequence and infer the interacting residues by calculating an interface conservation score, and SVMopt, an optimized SVM classifier using features extracted from protein sequences. The SNBRFinder also has two predicting approaches, including the which is a template-based predictor that first converts the query sequence into HMM and uses HMM-HMM alignment to identify the optimal template of the query sequence, and the
which is a feature-based predictor constructed by sequential information such as Shannon entropy, relative entropy and physicochemical properties.
The testing set RB44 developed by Puton et al. [Citation18] has been widely used to evaluate the prediction performance in various studies because the protein sequences in RB44 have sequence identities of less than 40% with sequences used in previous studies. RNABindRPlus and SNBRFinder both utilized RB44 as the testing set to evaluate their prediction performance. In order to fairly compare with them, we also perform our proposed method on RB44 and list the prediction result in . It can be easily observed that our feature-based predictor outperforms the other two methods in statistical performance with the overall ACC, MCC and F-score of 0.815, 0.502 and 0.593, respectively, which leads 0.063 and 0.077 in MCC and 0.033 and 0.048 in F-score. This can be explained by two possible reasons: (1) Our feature-based method extracts three types of features from PSSM with different aspects, which reflects more evolutionary conservation information. Besides, the ELSC algorithm is used to detect the evolutionary correlation between the residue pairs. (2) An adjustment procedure is applied in our feature-based predictor. The adjustment procedure has shown its effectiveness in improving the prediction performance on the validation set. However, the MCC value of our sequence template-based predictor is slightly lower than and HomPRIP, which can be caused by using different reference databases when searching for homologous sequences. In comparison among hybrid predictors, our proposed method achieves superior performance in four evaluation indexes including precision, ACC, MCC and F-score among all the five evaluation indexes. The overall ACC of our method is 0.817 and those of the other two methods are 0.816 and 0.802 respectively. The MCC value of our method is 0.511, which is higher than 0.492 of RNABindRPlus and 0.479 of SNBRFinder. For the F-score, our method achieves 0.605 compared with 0.600 of RNABindRPlus and 0.591 of SNBRFinder. These results indicate that our proposed prediction method not only can effectively predict the RNA-protein interacting residues but also has a relatively better performance than the other two previous state-of-art hybrid methods.
Table 3. Prediction performance comparison on testing set RB44.
Case study
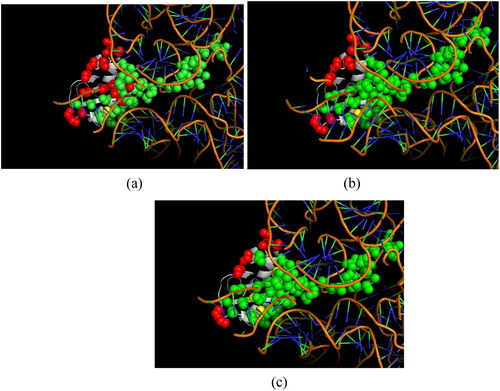
In order to further examine the prediction performance of our proposed method, the prediction result is displayed in the context of a three-dimensional structure. shows a representative example of prediction for protein chain M of 3izv and RNA chain A, which is extracted from our independent testing set. The figure is drawn by software PyMol [Citation44]. The true positive samples, false negative samples and false positive samples are represented in spheres coloured in green, red and yellow, respectively. shows the result predicted by the feature-based predictor without the adjustment procedure. In this condition, 47 of 65 true interacting residues are correctly predicted. shows the result by feature-based predictor with the adjustment procedure, which correctly predicts 55 of 65 true interacting residues. shows the result by the combination of the feature-based predictor and the sequence template-based predictor. In this condition, the prediction achieves satisfying performance: 57 of 65 true interacting residues are correctly predicted. It is easily observed that with the application of the adjustment procedure and the sequence template-based predictor, the number of green spheres increases, whereas the number of red spheres declines. The MCC values of the three conditions are 0.733, 0.821 and 0.833, respectively. The increasing performance in predicting the same protein provides a visual indication for the effectiveness of the adjustment procedure and ensemble strategy. With these approaches, our proposed method can reach a relatively satisfying prediction performance.
Figure 6. A representative example result of RNA-interacting residue prediction on 3izv by feature-based predictor without the adjustment procedure (a), feature-based predictor with the adjustment procedure (b) and a combination of feature-based and sequence template-based predictors (c).
RNA-binding proteins (RBPs) play an important role in many cellular processes. One of the main challenges in understanding the mechanisms of RBPs is identifying the interacting residues in protein sequences. As many biochemical experimental methods are notoriously difficult and costly, a number of computational methods based on the machine learning technique have been developed. Most of them apply two aspects of features including the protein sequence information and structure information. However, the number of known protein structures is much less than the number of proteins with known sequences, which makes the protein sequence easily available and widely used information in RNA-interacting residue prediction. Based on this background, our method can efficiently identify the RNA-interacting residues in protein sequences and would facilitate future site-directed mutagenesis studies in wet-lab experiments.
Conclusions
In this study, we propose a novel prediction method for RNA interacting residues based on the protein sequence information. The prediction method is composed of two predictors including a feature-based predictor and a complementary sequence template-based predictor. For the feature-based predictor, RF classifier is utilized to make prediction for each residue in the query sequence based on a variety of sequential features. After that, an adjustment algorithm will be applied to recheck the residues which are originally classified as non-interacting but close to an interacting residue. We also develop a sequence template-based predictor to further improve the coverage in the final prediction result. Finally, the results from the two predictors will be combined to accomplish the final prediction. On an independent testing set, our proposed method yields superior performance against two other state-of-art hybrid methods with better MCC, F-score and overall accuracy, which demonstrates that our method is able to efficiently identify the RNA-interacting residues in protein sequences and help biologists in site-directed mutagenesis studies in wet-lab experiments.
Funding
This work was supported by the National Nature Science Foundation of China [grant number 61772226,61373051,61862056]; Science and Technology Development Program of Jilin Province [grant number 20140204004GX]; Key Laboratory for Symbol Computation and Knowledge Engineering of the National Education Ministry of China.
References
- Turner M, Díaz-Muñoz MD. RNA-binding proteins control gene expression and cell fate in the immune system. Nat Immunol. 2018;19:120–129.
- Lin B, Pang Z. Stability of methods for differential expression analysis of RNA-seq data. BMC Genomics. 2019; 20:35.
- Pattnaik A, Palermo N, Sahoo BR, et al. Discovery of a non-nucleoside RNA polymerase inhibitor for blocking Zika virus replication through in silico screening. Antiviral Res. 2018;151:78–86.
- Haldipur B, Bhukya PL, Arankalle V, et al. Positive regulation of hepatitis E virus replication by microRNA-122. J Virol. 2018;92:01999–01917.
- Payne JL, Khalid F, Wagner A. RNA-mediated gene regulation is less evolvable than transcriptional regulation. Proc Natl Acad Sci USA. 2018; 115:E3481–E3490.
- Standart N, Jackson RJ. Regulation of translation by specific protein/mRNA interactions. Biochimie. 1994;76:867–879.
- Gangloff S, Soustelle C, Fabre F. Homologous recombination is responsible for cell death in the absence of the Sgs1 and Srs2 helicases. Nat Genet. 2000; 25:192–194.
- Oak N, Ghosh R, Huang K, et al. Framework for microRNA variant annotation and prioritization using human population and disease datasets. Hum Mutat. 2019;40:73–89.
- Carey KT, Wickramasinghe VO. Regulatory potential of the RNA processing machinery: implications for human disease. Trends Genet. 2018; 34:279–290.
- Tsai MC, Spitale RC, Chang HY. Long intergenic noncoding RNAs: new links in cancer progression. Cancer Res. 2011;71:3–7.
- Roosbroeck KV. miRNAs and long noncoding RNAs as biomarkers in human diseases. Expert Rev Mol Diagn. 2013; 13:183–204.
- Idda ML, Munk R, Abdelmohsen K, et al. Noncoding RNAs in Alzheimer's disease. Wiley Interdiscip Revi RNA. 2018;9.
- Zhou M, Zhao H, Wang X, et al. Analysis of long noncoding RNAs highlights region-specific altered expression patterns and diagnostic roles in Alzheimer's disease. Brief Bioinform. 2018;20:598–608.
- Liu H, Luo J, Luan S, et al. Long non-coding RNAs involved in cancer metabolic reprogramming. Cell Mol Life Sci. 2019;76:495–504.
- Mitra SA, Mitra AP, Triche TJ. A central role for long non-coding RNA in cancer. Front Genet. 2012;3:17.
- Cheetham SW, Gruhl F, Mattick JS, et al. Long noncoding RNAs and the genetics of cancer. Br J Cancer. 2013; 108:2419–2425.
- Kechavarzi B, Janga SC. Dissecting the expression landscape of RNA-binding proteins in human cancers. Genome Biol. 2014;15:R14–16.
- Puton T, Kozlowski L, Tuszynska I, et al. Computational methods for prediction of protein-RNA interactions. J Struct Biol. 2012;179:261–268.
- Walia RR, Caragea C, Lewis BA, et al. Protein-RNA interface residue prediction using machine learning: an assessment of the state of the art. BMC Bioinf. 2012;13:89.
- Berman HM, Westbrook J, Feng Z, et al. The Protein Data Bank. Genetica. 2000;106:149–158.
- Consortium UP. The Universal Protein Resource (UniProt.). Nucleic Acids Res. 2005;33:D154–D159.
- Wang L, Brown SJ. BindN: a web-based tool for efficient prediction of DNA and RNA binding sites in amino acid sequences. Nucleic Acids Res. 2006;34:W243–W248.
- Kumar M, Gromiha MM, Raghava GPS. Prediction of RNA binding sites in a protein using SVM and PSSM profile. Proteins. 2010; 71:189–194.
- Cheng C-W, Su E, Hwang J-K, et al. Predicting RNA-binding sites of proteins using support vector machines and evolutionary information. BMC Bioinformatics. 2008;9:S6.
- Walia RR, Xue LC, Wilkins K, et al. RNABindRPlus: a predictor that combines machine learning and sequence homology-based methods to improve the reliability of predicted RNA-binding residues in proteins. PLoS One. 2014; 9:e97725.
- Lewis BA, Walia RR, Terribilini M, et al. PRIDB: a protein-RNA interface database. Nucleic Acids Res. 2011; 39:D277–D282.
- Yang X, Wang J, Sun J, et al. SNBRFinder: a sequence-based hybrid algorithm for enhanced prediction of nucleic acid-binding residues. PLoS ONE. 2015; 10:e0133260
- Remmert M, Biegert A, Hauser A, et al. HHblits: lightning-fast iterative protein sequence searching by HMM-HMM alignment. Nat Methods. 2012;9:173–175.
- Si J, Cui J, Cheng J, et al. Computational prediction of RNA-binding proteins and binding sites. Int J Mol Sci. 2015;16:26303–26317.
- Ren H, Shen Y. RNA-binding residues prediction using structural features. BMC Bioinformatics. 2015;16:249–259. 2015-08-09
- Ahmad S, Sarai A. Analysis of electric moments of RNA-binding proteins: implications for mechanism and prediction. BMC Struct Biol. 2011; 11:8–21.
- Li W, Godzik A. Cd-hit: a fast program for clustering and comparing large sets of protein or nucleotide sequences. Bioinformatics. 2006;22:1658–1659.
- Lehninger AL. Lehninger principles of biochemistry. New York: W. H. Freeman. 2013.
- Sweet RM, Eisenberg D. Correlation of sequence hydrophobicities measures similarity in three-dimensional protein structure. J Mol Biol. 1983;171:479–488.
- Stojanov D, Madevska Bogdanova A, Orzechowski TM. TMO: time and memory optimized algorithm applicable for more accurate alignment of trinucleotide repeat disorders associated genes. Biotechnol Biotechnol Equip. 2016;30:388–403.
- Altschul SF, Madden TL, Shaffer A, et al. Gapped blast and psi-blast: A new generation of protein database search programs. Nucleic Acids Res. 1997;25:3389–3402.
- Zhou J, Lu Q, Xu R, et al. EL_PSSM-RT: DNA-binding residue prediction by integrating ensemble learning with PSSM relation transformation. BMC Bioinformatics. 2017;18:379–395.
- Dekker JP, Fodor A, Aldrich RW, et al. A perturbation-based method for calculating explicit likelihood of evolutionary co-variance in multiple sequence alignments. Bioinformatics. 2004;20:1565–1572.
- Göbel U, Sander C, Schneider R, et al. Correlated mutations and residue contacts in proteins. Proteins. 2010;18:309–317.
- Thomas DJ, Casari G, Sander C. The prediction of protein contacts from multiple sequence alignments. Protein Eng Des Sel. 1996;9:941–948.
- Olmea O, Rost B, Valencia A. Effective use of sequence correlation and conservation in fold recognition. J Mol Biol. 1999;293:1221–1239.
- Ma X, Guo J, Wu J, et al. Prediction of RNA-binding residues in proteins from primary sequence using an enriched random forest model with a novel hybrid feature. Proteins. 2015;79:1230–1239.
- Pedregosa F, Gramfort A, Michel V, et al. Scikit-learn: machine learning in Python. J Mach Learn Res.. 2013;12:2825–2830.
- Shringi RP. PyMol Software for 3D visualization of aligned molecules. Biomaterials. 2005; 26:63–72.