
Abstract
Drought is one of the most severe abiotic stresses, the damage due to which, various plant species mitigate by activating mechanisms that are not yet well understood. Caragana korshinskii is a xerophytic shrub found in the semi-arid regions of northwest China with high tolerance to several abiotic stresses, including drought. Based on the de novo transcriptome data from C. korshinskii leaflets collected along a precipitation gradient on the Loess Plateau (China), most of the differentially expressed genes were explored using trend analysis along the precipitation gradient. Gene ontological analysis showed that “phenylpropanoid biosynthesis process → secondary metabolite biosynthetic process” terms were the most significant gene ontologies, whereas Kyoto Encyclopedia of Genes and Genomes-based analysis indicated that the biosynthesis of secondary metabolites was a significant metabolic pathway. Real-time polymerase chain reaction and enzyme activity analyses confirmed the increased transcription of the phenylalanine ammonialyase (PAL) gene in C. korshinskii under drought stress in field and laboratory conditions. These results suggested that C. korshinskii adjusts its secondary metabolism to water-deficit environments and activates PAL by drought stress. Therefore, further studies on the obtained data can expand the current understanding of the molecular and genetic mechanisms responsible for the drought endurance in C. korshinskii.
Introduction
In nature, the stresses such as drought, salinity, freezing and heat are the major limitations to plant growth [Citation1]. Drought refers to the deficiency of water in the soil and is one of the major widespread abiotic determinants of many plant species [Citation2] that have devastating impacts on the environment and water resources [Citation3]. Severe drought has led to the widespread death of the trees in many forest biomes [Citation4]. Due to global warming, a future massive drought-induced die-off of trees may be severe and extensive [Citation5], and regional-scale droughts are expected to intensify [Citation4]. In China, the frequency of severe droughts increased, especially on the Loess Plateau, with extreme climatic conditions [Citation6]. In this area, the apparent drying and warming processes occurred from 1971 to 2010, and the majority of the regions exhibited spatially increasing trends of drought frequency and severity [Citation7,Citation8]. The level of available water will reduce further, thereby increasing the need for plants that are highly drought-tolerant [Citation2,Citation9]. Plants respond to drought stress by complex adjustments including the induction of drought-responsive genes and adaptations based on the modifications in protein synthesis and metabolites [Citation10–12]. Hence, drought tolerance in plants is a physiologically complex trait that is regulated by diverse metabolic and genetic mechanisms [Citation13], and the identification of these underlying mechanisms might provide key insights into the adaptive responses of plants to water deficiency.
Caragana korshinskii is a perennial xerophytic flowering plant of the family Fabaceae, with small, pinnate leaflets, widely distributed in the arid and semi-arid regions of northwest China [Citation14,Citation15]. It is a vital forage bush with high drought resistance, and hence, used as a model species in abiotic stress studies [Citation16]. Owing to its tolerance to abiotic stresses, C. korshinskii has been used for dune stabilization and water conservation in north China [Citation17,Citation18]. In addition, this species restores degraded land by fixing atmospheric nitrogen, serves as supplemental livestock forage and plays a key role in vegetation succession from shifting dunes to sandy grasslands [Citation19]. Previous studies have focused on the taxonomy, community distribution, and biological and ecological characteristics of C. korshinskii, as well as the changes in several abiotic stress-related genes [Citation14,Citation17,Citation20,Citation21]. However, molecular response mechanisms to water deficiency remain unknown, especially in natural habitats because of the significant selective pressure imposed by the precipitation gradient.
In order to better understand the drought tolerance mechanisms in C. korshinskii under different water conditions, we conducted a de novo transcriptome analysis, analyzed the cluster of multiple drought-related genes and reported the expression profiling of transcriptomes in the leaflets. The results allowed us to identify the stress-related candidate genes and reveal the essential pathways mediated by regulatory gene networks. The phenylalanine ammonialyase (PAL) gene was identified as an up-regulated response in phenylpropanoid biosynthesis pathway in a C. korshinskii population along a precipitation gradient. The obtained data might extend the current knowledge regarding the strong drought resistance of C. korshinskii at the molecular level.
Materials and methods
Sampling sites, conditions and plant material
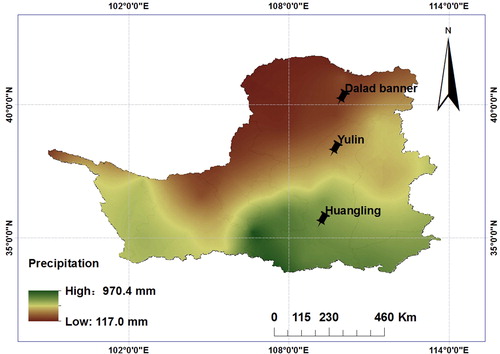
The sites for collecting the samples were selected as the Loess Plateau in Shaanxi Province and Inner Mongolia, Northwest China (), where the annual precipitation (from 150 mm in the northwest to 800 mm in the southeast) and the annual evaporation (from 1400 mm in the southeast to 2000 mm in the northwest) show a gradient distribution and 55%–78% of the precipitation occurs from June to September [Citation22–24]. The annual precipitation, annual evaporation, soil moisture content (SMC) and plant leaf water potential were reported previously [Citation25]. However, no significant difference was detected in the annual average temperature from the northwest to the southeast, soil pH and altitude along the precipitation gradient [Citation26]. The collection and freezing of plant materials and soil samples with respect to C. korshinskii were described previously [Citation27].
Figure 1. Sampling sites (Huangling, Yulin and Dalad Banner) of Caragana korshinskii along a precipitation gradient of Loess Plateau. Source: Authors.
RNA isolation and library construction
The three total RNA samples, each one from three individuals in a site, were isolated using TRIzol (Invitrogen, Carlsbad, CA, USA), according to the manufacturer’s instructions, and treated with RNase-free DNase I (Takara Bio, Shiga, Japan) for 30 min at 37 °C to remove residual DNA. RNA quality was verified using a 2100 Bio-analyser (Agilent Technologies, Santa Clara, CA, USA) and by RNase-free agarose gel electrophoresis. Poly (A) mRNA was isolated using oligo-dT beads (Qiagen, Venlo, the Netherlands). All mRNA was broken into short fragments by the addition of fragmentation buffer. First-strand cDNA was generated by reverse transcription using random hexamer-primers, followed by the synthesis of second-strand cDNA using RNase H and DNA polymerase I. The cDNA fragments were purified using the QIAquick PCR Purification Kit (Qiagen, Venlo, the Netherlands), washed with EB buffer for end reparation and poly (A) addition, and ligated to sequencing adapters. Following agarose gel electrophoresis and extraction, cDNA fragments were purified and enriched by polymerase chain reaction (PCR) to construct the final cDNA library, which was sequenced by Illumina Hi-Seq™ 2000 (Illumina, San Diego, CA, USA) using the paired-end technology of Gene Denovo Co. (Guangzhou, China). Clean reads were selected by removing low-quality sequences (Q value ≤10), reads with more than 5% of unknown nucleotides and reads containing adapter sequences.
Sequence, assembly and annotation of reference transcriptome
To obtain a reference transcriptome for the leaflets of C. korshinskii, RNA-Seq data were generated using RNA from all leaf samples. Raw reads were filtered to remove low-quality sequences (Q value ≤10), reads with more than 5% of unknown nucleotides and reads containing adapter sequences. Unigene annotation was performed using BLASTX (ftp://ftp.ncbi.nlm.nih.gov/blast/executables/blast+/2.2.29/) with a threshold E-value of 1e-5 against the National Centre for Biotechnology Information (NCBI) non-redundant (NR) database (https://www.ncbi.nlm.nih.gov/), the Swiss-Prot protein database (https://www.expasy.ch/sprot), the Kyoto Encyclopedia of Genes and Genomes (KEGG) database (https://www.genome.jp/kegg/) and the Clusters of Orthologous Groups (COG) database (https://www.ncbi.nlm.nih.gov/COG/). The sequence direction of unigenes was determined according to the best alignment. When results differed between the databases, the direction was determined consecutively by the NR, Swiss-Prot, KEGG and COG databases. When a unigene was not aligned, sequence direction was confirmed using ESTscan. GO annotation was analyzed using Blast2GO (BioBam Bioinformatics S.L., Valencia, Spain). The functional classification of unigenes was performed using WEGO [Citation28]. KEGG pathway annotation was performed by Blastall (ftp.ncbi.nlm.nih.gov/blast/executables/blast+/2.2.29/) against the KEGG database.
Alignment of reads and normalization of gene expression levels
Sequence reads were mapped to reference sequences using SOAPaligner/soap2 [Citation29], a tool designed for short sequence alignment. The coverage of reads in a gene was used to calculate gene expression levels. Using this method, we determined the expression levels of all detected genes. Reads uniquely mapped to a gene were used to calculate the expression level. The gene expression level was measured by the number of uniquely mapped reads per kilobase pair of transcript per million reads mapped (RPKM) [Citation30]. For DEGs between Huangling and Yulin or Yulin and Dalad Banner populations, the effect of drought stress was restricted to a false discovery rate (FDR) of ≤ 0.001 and an absolute value of log2 ratio of ≥1 [Citation31].
Drought treatment of C. korshinskii in laboratory
The weighing method was adopted to set three gradients to ensure that the water content of the soil was maintained at 75%, 55% and 35% of the maximum, which were termed as suitable water availability (CK), mild drought stress (MD) and severe drought stress (SD), respectively [Citation32]. C. korshinskii seeds obtained from Huangling of the Loess Plateau of China were germinated under humid conditions at 28 °C in darkness for two days. Then, germinated seeds were selected for sowing in pots with a diameter of 11 cm and a height of 30 cm; each pot was filled with 4 kg of sand and soil (sand/soil = 1:1). The cultivars were grown in a glasshouse under natural light conditions (16 h light/8 h dark photoperiod and the temperature was 25 ± 2 °C during the day and 18 ± 2 °C during the night) [Citation14]. The drought treatment was started by controlling the soil moisture levels when the seedlings grew to a height of about 25 cm after 3 months for 20 days as described previously [Citation33]. Subsequently, the leaf samples were collected, frozen in liquid nitrogen and stored at –80 °C until further use.
RNA extraction and real-time PCR confirmation of RNA-Seq data
Total RNA was extracted from C. korshinskii leaflets using RNAiso Plus (TaKaRa Bio, Shiga, Japan), according to the manufacturer’s instructions. The purified RNA was dissolved in RNase-free water, and RNA quantity measured using a NanoDrop ND-2000 Spectrophotometer (Thermo Fisher Scientific, Waltham, MA, USA). Messenger RNA (mRNA) was transcribed using PrimeScript RT reagent Kit with gDNA Eraser (TaKaRa Bio, Shiga, Japan).
The PAL sequence published in the GenBank database (DQ652565.1) was used to select a 214-bp region with high homology as a target for real-time PCR amplification. Primers for quantitative reverse transcription PCR (qRT-PCR) were designed using Primer Premier 5.0 (Premier Biosoft International, Palo Alto, CA, USA) and synthesized by Invitrogen (Shanghai, China). The PAL-specific primers PAL-F (Supplementary Table S1) were used to amplify the 214-bp region.
Real-time PCR reactions were carried out using a Bio-Rad iQ5 Multicolor Real-Time Detection System (Bio-Rad, Hercules, CA, USA) using a SYBR Green-based PCR assay. Each reaction mixture (20 μL) contained 2 μL diluted first-strand cDNA, 250 nmol/L of each primer, 10 μL TransStart Tip Green qPCR SuperMix (TransGen Biotech, Beijing, China) and 7 μL water. Real-time PCR conditions were as follows: 94 °C for 30 s, followed by 40 cycles at 94 °C for 5 s, 60 °C for 30 s, and a final extension step at 72 °C for 5 min. Real-time PCR analysis was performed in triplicate. The expression levels of reference genes were determined using CT values and calculated using the 2–ΔΔCt method [Citation34].
Determination of enzyme activity of PAL in C. korshinskii from three sampling sites
PAL activity was measured as described by Lynda et al. [Citation35] with some modifications. Leaflets were pooled (0.1 g) and ground in ice with 1 mL 0.05 mol/L Tris-H2SO4 buffer (pH 8.4) containing 15 mmol/L β-mercaptoethanol, 1 mmol/L ethylenediaminetetraacetic acid and 1% polyvinylpyrrolidone. The homogenate was subjected to centrifugation at 12,000 ×g for 20 min at 4 °C, and the supernatant was used in the subsequent enzyme assays. A 1 mL reaction mixture consisted of 0.05 μmol Tris-H2SO4 buffer (pH 8.4), 6 μmol L-phenylalanine and 10 μL enzyme extract. The control group included the reaction liquid except for L-phenylalanine. After 70 min at 37 °C, the reaction was stopped by the addition of 0.1 mL of 5 mol/L HCl. The relative absorbance was measured at 290 nm using a spectrophotometer. A molar extinction coefficient of 10,900 L/(mol cm) was used to calculate the enzyme activity [Citation36]. The PAL activity was expressed in μmol transcinnamic acid per milligram protein per minute.
Statistical analysis
The laboratory data were expressed as the average of three independent experiments, and statistical analyses were performed using SPSS 16.0 (SPSS Inc., Chicago, IL, USA); P-value < 0.05 is considered as statistically significant.
Results and discussion
Analysis of three libraries and comparison of differentially expressed genes (DEGs)
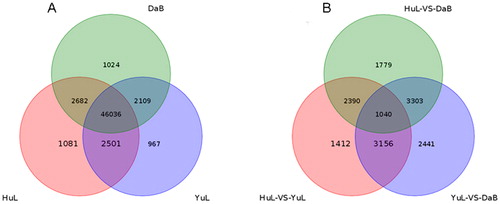
Solexa sequencing was used to generate a de novo library per sampling site. Tags were mapped against the reference genes in each of the three libraries, and the statistical difference was determined in the classification of raw reads and the distribution of gene coverage (Supplementary Figure S1). The saturation of sequencing data refers to the point at which new unique tags could not be detected [Citation37]. Next, the saturation analysis was performed to assess whether the sequencing depth and transcriptome coverage were sufficient, and the results showed that the three libraries were saturated with transcripts (Supplementary Figure S2). A Venn diagram () was constructed to illustrate the distribution of genes with common expression that might be unique to the Huangling, Yulin and Dalad Banner libraries. shows the distribution of genes expressed in all three libraries; 46,036 non-DEG genes were co-expressed in the three libraries. We also analyzed the distribution of DEGs () to illustrate the genes that were differentially expressed between the three libraries. A total of 2,441 specific DEGs were found in the Yulin library as compared to the Dalad Banner library, and 1,040 common DEGs were found in both libraries. Similarly, 3,156 DEGs were found in both Huangling and Yulin libraries and Yulin and Dalad Banner libraries.
Figure 2. Distribution of expressed mRNAs in the leaflets of Caragana korshinskii collected from three sampling sites (Huangling, Yulin and Dalad Banner) along a precipitation gradient of Loess Plateau. Venn diagram of genes (A) and unique expressed genes (B) in Huangling, Yulin and Dalad Banner populations obtained by pairwise comparisons.
Furthermore, we compared the de novo profiles of the three libraries (Huangling vs. Yulin, Yulin vs. Dalad Banner, and Huangling vs. Dalad Banner) to identify the up- or down-regulated DEGs in response to the precipitation gradient. The results (Supplementary Figure S3) showed that 4,437 DEGs were significantly up-regulated in Dalad Banner as compared to Huangling; 4,075 DEGs were down-regulated in Yulin as compared to Huangling; 5,699 DEGs were up-regulated and 4,241 DEGs were down-regulated in Dalad Banner as compared to Yulin; 4,338 DEGs were up-regulated and 3,660 DEGs were down-regulated in Yulin as compared to Huangling. The distribution and characteristics of DEGs revealed similar expression patterns in each pair of libraries, indicating that several key genes were involved in the response processes of C. korshinskii when subjected to abiotic stress.
Drought stress can significantly alter the gene expression in plants. The identification of genes related to drought tolerance aids in better understanding the plant survival mechanisms under water deficiency [Citation38]. In this study, we evaluated the gene expression patterns in C. korshinskii leaflets collected from the three sites (Huangling, Yulin and Dalad Banner) along the precipitation gradient on the Loess Plateau. As shown in , 46,036 genes, commonly expressed in the three generated libraries, might be responsible for gene activation and suppression in C. korshinskii. Several genes were differentially expressed when drought stress occurred, while unique DEGs were evenly distributed in all libraries (). Thus, a gradual increase in drought levels resulted in gradual changes in the transcriptomes of C. korshinskii, indicating the stability of genomic changes that provided the molecular basis for drought adaptation in C. korshinskii populations along a precipitation gradient on Loess Plateau.
Cluster analysis of gene ontology (GO) terms in DEGs
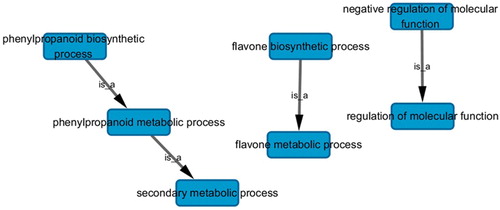
Considering the gradual strengthening of the drought stress from Huangling to Yulin to Dalad Banner, a total of 5,623 DEGs were grouped into eight clusters using short time-series expression miner (). Among the eight major clusters, clusters 2–4 were enriched in the up-regulated transcripts and clusters 5–7 in the down-regulated transcripts. Next, we performed the GO term analysis within the up-regulated and down-regulated cluster groups, excluding clusters 1 and 8, in order to identify the genes that are involved in the metabolic processes. All clusters were classified into three main categories: biological processes, cellular components and molecular functions. The biological process category was comprised of four major sub-categories, including cellular process, metabolic process, response to stimulus, and biological regulation. The cellular component category consisted of three major sub-categories, including cell, cell part and organelle, while the molecular function category included three major sub-categories: catalytic activity, binding and transporter activity (). As indicated by the GO analysis of interactions and relationships (Supplementary Figure S4), “phenylpropanoid biosynthesis process → secondary metabolism process” terms () were identified as the major drought-related GO terms (FDR ≤ 0.25).
Figure 3. Cluster analysis of gene ontology (GO) terms on differentially expressed genes in the leaflets of Caragana korshinskii collected from three sampling sites (Huangling, Yulin and Dalad Banner) along a precipitation gradient of Loess Plateau. Profiles 2–4 indicate differentially expressed genes with an up-regulated trend; profiles 5–7 indicate differentially expressed genes with a down-regulated trend. P, C and F indicate biological process category, cellular component category and molecular function category, respectively.
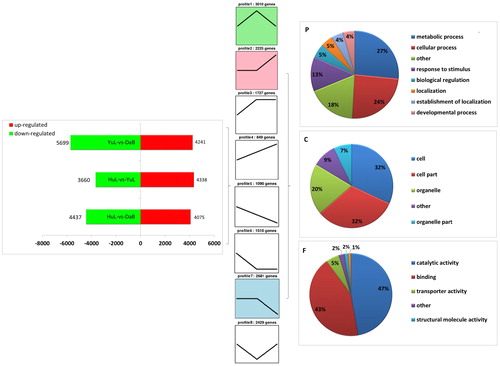
Figure 4. Key drought-related gene ontology (GO) terms (false discovery rate ≤0.25) of interactions and relationships in different trend profiles.
Cluster analysis was carried out to interpret the transcriptional levels of C. korshinskii and identify any underlying molecular mechanisms. Of the eight trend profiles, we primarily focused on the up- and down-regulation trends. The GO term analysis of these trends revealed a series of metabolic processes affected by drought stress that were classified into three categories: biological process, molecular function and cellular component. The identification of these major GO terms indicated that the transcriptome recovery of the genome balance occurred after the occurrence of the precipitation gradient. For example, metabolic and cellular processes included in the GO term “biological process” () were highly annotated, suggesting that alterations in the comprehensive gene expression occurred during the adaptation to drought stress. “Response to stimulus” and “biological regulation,” both accounted for 18% of the total GOs and were relevant to the precipitation gradient.
KEGG pathway enrichment analysis of up- and down-regulated DEGs
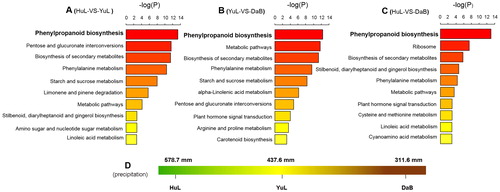
The up-regulated DEGs from profiles 2-4 and the down-regulated DEGs from profiles 5-7 () were subjected to the KEGG pathway enrichment analysis ( and ). The up-regulated DEGs were enriched for phenylpropanoid biosynthesis (ko00940), phenylalanine metabolism (ko00360), biosynthesis of secondary metabolites (ko01110), stilbenoid, diarylheptanoid, and gingerol biosynthesis (ko00945), flavone and flavonol biosynthesis (ko00944), starch and sucrose metabolism (ko00500), flavonoid biosynthesis (ko00941), and nitrogen metabolism (ko00910), whereas the down-regulated DEGs were significantly enriched for linoleic acid metabolism (ko00591), alpha-linoleic acid metabolism (ko00592), zeatin biosynthesis (ko00908), porphyrin and chlorophyll metabolism (ko00860), biosynthesis of secondary metabolites (ko01110), and plant hormone signal transduction (ko04075) pathways.
Table 1. List of pathways in up-regulated differentially expressed genes (DEGs).
Table 2. List of pathways in down-regulated differentially expressed genes (DEGs).
To further characterize the functional roles of DEGs responsible for the precipitation gradient in C. korshinskii, the pathway analysis of DEGs was performed. Significant differences were identified in the signalling pathways in C. korshinskii by pairwise comparison between the samples (Huangling vs. Yulin, Yulin vs. Dalad Banner and Huangling vs. Dalad Banner, respectively). Moreover, in these samples, the phenylpropanoid biosynthesis was considered the distinct pathway that contributed to precipitation gradient ().
Figure 5. Pathway analyses of DEGs by pairwise comparison between the samples of Caragana korshinskii. The comparative analysis of pathway in Huangling vs. Yulin (A), Yulin vs. Dalad Banner (B) and Huangling vs. Dalad Banner (C). The precipitation profile (D) of three sampling sites of Caragana korshinskii. Note: The vertical axis denotes the gene ontology (GO) category, and the horizontal axis denotes negative log values (p-values) of the enriched terms
Previous studies demonstrated that plant responses to stress rely on the function of complex gene networks. Plant secondary metabolism, generally related to plant defence responses, has evolved based on the interactions between plants and the environment [Citation39]. Moreover, plant secondary metabolites have been found to play a major role in several aspects of plant life, some of which are essential for survival [Citation40]. In this study, the biosynthesis of secondary metabolites in C. korshinskii was identified as a highly significant KEGG pathway that underwent fundamental changes at the transcriptome level and was enriched by both up- and down-regulated genes. Therefore, water-deficit conditions favour a shift in the balance between the production and elimination of secondary metabolites.
The secondary metabolism of plants, especially the vital physiological role of phenylpropanoid biosynthesis in plant development [Citation41], is demonstrated in several ways. All phenylpropanoid substances are generated directly or indirectly through this pathway, whereas active components play crucial roles in the growth and development of plants [Citation42]. Phenylpropanoids serve as essential chemical regulators of plant communication with insects and microbes [Citation43]. The phenylpropanoid metabolism in plants contributes to the defensive response against pathogens [Citation44]. Interestingly, phenylpropanoids exert a significant effect on plant responses to abiotic stresses [Citation45]; however, their effect on drought response is yet unknown. The results from the present study showed that phenylpropanoid biosynthesis is the first significant KEGG pathway to participate in drought stress response ( and ), followed by phenylalanine metabolism ().
Real-time PCR and enzymatic activity of PAL confirmation by RNA-seq data in field and laboratory C. korshinskii
The first step of phenylpropanoid biosynthesis is catalysed by the PAL enzyme (EC 4.3.1.5) [Citation46]. The sequence of PAL in C. korshinskii has orthologs in leguminous plants as further supported by the phylogenetic analysis (). In addition, clear orthologous correlations were found in the PAL gene of C. korshinskii among drought-tolerant plants, such as Robinia pseudoacacia [Citation47], which might be attributed to the evolution as a result of living in water-deficit environments. The transcriptome analysis results for PAL were compared to those obtained from qPCR of C. korshinskii in field and laboratory (). The comparison revealed that the expression of this gene increased significantly along the precipitation gradient from Huangling to Yulin to Dalad Banner. Also, the enzymatic activity of PAL was detected from C. korshinskii of Loess Plateau, which showed a significant difference in the up-regulated expression along the precipitation gradient, corresponding to the analysis on the laboratory sample under drought stress. These results indicated that changes in the enzymatic activity of PAL () were consistent with increasing PAL expression and the up-regulation of the phenylpropanoid biosynthesis pathway.
Figure 6. Transcriptome analysis of phenylalanine ammonialyase (PAL) in comparison with detection and quantitation by real-time PCR and PAL activity analysis in the leaflets of Caragana korshinskii collected from three sampling sites (Huangling, Yulin and Dalad Banner) along a precipitation gradient of Loess Plateau and laboratory samples under drought stress. Phylogenetic (A) and transcriptome (B) analysis of PAL gene. Real-time PCR detection of PAL in field (C) and laboratory (D) samples. PAL activity analysis in field (E) and laboratory (F) samples. Note: RPKM: Reads Per Kb per Million reads. a,b,c: Statistically significant differences
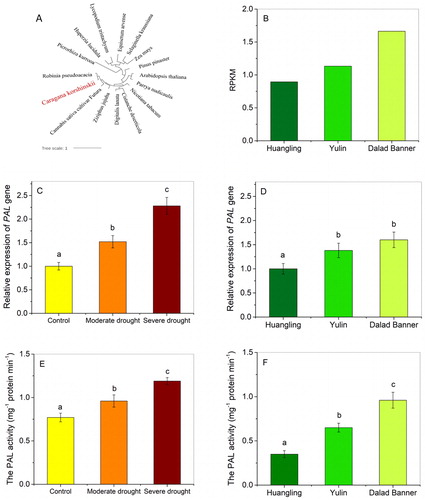
Based on the phenylpropanoid biosynthesis or phenylalanine metabolism, PAL (EC 4.3.1.5) is a major enzyme that connects primary metabolism with metabolic phenylpropanoids [Citation48] and is responsible for the initiation of the biosynthesis of several secondary metabolites from phenylalanine. The phenylpropanoid pathway produces diversified intermediate metabolites and converts them into secondary metabolites, such as lignin, flavonoids, isoflavones and alkaloids [Citation49]. These products play a critical role in the growth and development of plants, and their content was closely related to the enzymatic activity of PAL; hence, PAL is a vital component of the physiological processes in plants. In this study, PAL expression showed the same trend as the enzymatic activity of PAL under drought stress in field and laboratory samples. The involvement of PAL in the core reactions of phenylpropanoid metabolism in C. korshinskii suggested its critical role in phenylpropanoid biosynthesis and the crosstalk between phenylpropanoid and secondary metabolites.
After the PAL enzyme is activated, the phenylpropanoid pathway branches into two primary pathways: lignin biosynthetic pathway and flavonoid metabolic pathway [Citation50]. The resulting products act as plant anti-toxins, cell wall components and signal transduction molecules [Citation51]. Another primary pathway that branches off the phenylpropanoid pathway is the flavonoid metabolic pathway after the activation of the PAL enzyme [Citation50]. The flavonoid metabolic pathway plays a crucial role in multiple processes, such as defence against pathogens and pests, pollination, light screening and seed development, which are involved in environmental stress protection [Citation52]. In this study, the expression of PAL was up-regulated in C. korshinskii, suggesting a protective role of the phenylpropanoid pathway against drought stress.
Validation of RPAM data by qPCR
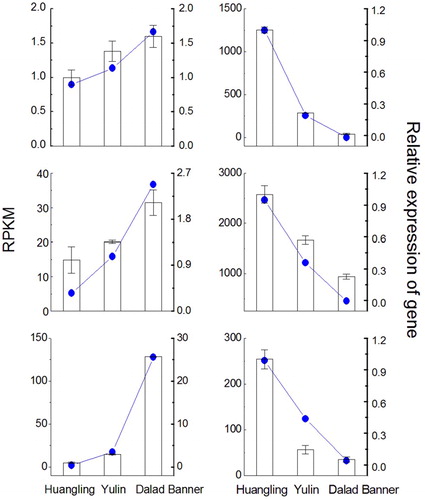
To further validate the results obtained from tag-mapped genes and computational analysis, six genes (three up-regulated and three down-regulated ones) were randomly selected for qPCR (Supplementary Table S1) using samples from all the three sites. Consequently, similar qPCR trends were observed for the selected genes and those detected by sequencing ().
Figure 7. Validation of RPKM data by quantitative polymerase chain reaction (qPCR). Note: Relative qPCR was used to measure the changes in target gene expression in the leaflets of Caragana korshinskii collected from three sampling sites (Huangling, Yulin and Dalad Banner) along a precipitation gradient of Loess Plateau. RPKM, Reads Per Kb per Million reads.
Plants in arid and semi-arid areas employ a variety of strategies and mechanisms to endure stress under long-term water-deficit conditions. Signalling pathways are considered as key elements of regulatory networks, underpinning the cross-tolerance responses to stress and leading to stress defence and growth regulation. The results from this study indicated that significantly up-regulated pathways related to drought responses might require increased metabolic changes and oxidation resistance, thereby explaining the dominance of C. korshinskii in the arid Loess Plateau.
Water starvation exerts contrasting effects on the transcriptome responses in C. korshinskii. This study also indicated that major pathways related to plant growth, such as zeatin biosynthesis, were significantly down-regulated with the decreasing precipitation gradient (). Zeatin is a plant hormone from the family of cytokines [Citation53], first discovered in the immature kernels of genus Zea. Zeatin promotes the growth of lateral buds, whereas its application to meristems stimulates cell division [Citation54]. Salt stress might restrict plant growth by decreasing zeatin levels [Citation55]. A previous study reported that zeatin levels remain low throughout the stress period but increase rapidly after stress relief [Citation56]. This effect was considered to be associated with drought-related processes, although the underlying mechanisms are yet to be elucidated entirely.
Conclusions
In the present study, the transcriptome profile dataset of C. korshinskii was generated by the de novo assembly of next-generation sequencing data. Next, we identified PAL in the phenylpropanoid pathway as one of the most crucial factors of plant response to stress. The balance between the production and elimination of secondary metabolites would be shifted in water-deficit conditions. C. korshinskii thereby up-regulated the level of PAL under drought stress. The involvement of PAL in the core reactions of the phenylpropanoid metabolism in C. korshinskii implicated its critical role in phenylpropanoid biosynthesis and the crosstalk between phenylpropanoid and secondary metabolites. These data expand our understanding of the molecular and genetic mechanisms underlying the drought endurance in C. korshinskii, identify genes useful for breeding drought-resistant genotypes and apply to restore desertification.
Data accessibility
Raw sequence data have been deposited in the National Centre for Biotechnology Information (NCBI) Sequence Read Archive (SRA) (SRX1117100) and are publicly available. They can be also obtained from Dr. Chunmei Gong ([email protected]) on request.
Supplemental Material
Download PDF (401.9 KB)Acknowledgments
The authors would like to thank the Guangzhou Gene Denovo Biotechnology Co., Ltd for assisting them with sequencing and technical support.
Disclosure statement
No potential conflict of interest was reported by the authors.
Funding
This work was supported by the National Natural Science Foundation of China (No. 31070538 and No. 31770648).
Related Research Data
References
- Kreps JA, Wu Y, Chang HS. Transcriptome changes for Arabidopsis in response to salt, osmotic, and cold stress. Plant Physiol. 2002;130:2129–2141.
- Xu E, Fan G, Niu S, et al. Transcriptome-wide profiling and expression analysis of diploid and autotetraploid Paulownia tomentosa × Paulownia fortunei under drought stress. PLoS ONE. 2014;9:e113313. [16 p.]. DOI:10.1371/journal.pone.0113313
- Sternberg T. Regional drought has a global impact. Nature. 2011;472:169.
- Choat B, Brodribb TJ, Brodersen CR, et al. Triggers of tree mortality under drought. Nature. 2018;558:531–539. DOI:10.1038/s41586-018-0240-x
- Breshears DD, Cobb NS, Rich PM, et al. Regional vegetation die-off in response to global-change-type drought. Proc Natl Acad Sci U S A. 2005;102:15144–15148. DOI:10.1073/pnas.0505734102
- Wang L, Shao M, Wang Q, et al. Historical changes in the environment of the Chinese Loess Plateau. Environ Sci Policy. 2006;9:675–684.
- Chen Z, Yang G. Analysis of drought hazards in North China: distribution and interpretation. Nat Hazards. 2013;65:279–294.
- Zhao X, Wu P. Meteorological drought over the Chinese loess plateau: 1971-2010. Nat Hazards. 2013;67:951–961.
- Chen G, Tian H, Zhang C, et al. Drought in the Southern United States over the 20th century: variability and its impacts on terrestrial ecosystem productivity and carbon storage. Clim Change. 2012;114:379–397.
- Bohnert HJ, Nelson DE, Jensen RG. Adaptations to environmental stresses. Plant Cell. 1995;7:1099–1111. DOI:10.2307/3870060
- Zhu JK. Salt and drought stress signal transduction in plants. Annu Rev Plant Biol. 2002;53:247–273. DOI:10.1146/annurev.arplant.53.091401.143329
- Shan Z, Luo X, Wei M, et al. Physiological and proteomic analysis on long-term drought resistance of cassava (Manihot esculenta Crantz). Sci Rep. 2018;8:17982. [12 p.]. DOI:10.1038/s41598-018-35711-x
- Price AH, Cairns JE, Horton P, et al. Linking drought-resistance mechanisms to drought avoidance in upland rice using a QTL approach: progress and new opportunities to integrate stomatal and mesophyll responses. J Exp Bot. 2002;53:989–1004.
- Yang Q, Yin J, Li G, et al. Reference gene selection for qRT-PCR in Caragana korshinskii Kom. under different stress conditions. Mol Biol Rep. 2014;41:2325–2334.
- Jian SQ, Zhao CY, Fang SM, et al. Soil water content and water balance simulation of Caragana korshinskii Kom. in the semiarid Chinese Loess Plateau. J Hydrol Hydromech. 2014;62:89–96.
- Xia GM, Kang SZ, Li WC, et al. Diurnal and seasonal variation of stem sap flow for Caragana korshinskii on the arid desert region in Shiyang river basin of Gansu. Acta Ecol Sin. 2006;26:1186–1193.
- Zhang ZS, Li XR, Liu LC, et al. Distribution, biomass, and dynamics of roots in a revegetated stand of Caragana korshinskii in the Tengger Desert, northwestern China. J Plant Res. 2009;122:109–119.
- Zhang H, Tang M, Chen H, et al. Communities of arbuscular mycorrhizal fungi and bacteria in the rhizosphere of Caragana korshinkii and Hippophae rhamnoides in Zhifanggou watershed. Plant Soil. 2010;326:415–424.
- Zheng Y, Xie Z, Gao Y, et al. Germination responses of Caragana korshinskii Kom. to light, temperature and water stress. Ecol Res. 2004;19:553–558.
- Cheng X, Huang M, Shao M, et al. A comparison of fine root distribution and water consumption of mature Caragana korshinkii Kom. grown in two soils in a semiarid region, China. Plant Soil. 2009;315:149–161.
- Wang X, Dong J, Liu Y, et al. A novel dehydration-responsive element-binding protein from Caragana korshinskii is involved in the response to multiple abiotic stresses and enhances stress tolerance in transgenic tobacco. Plant Mol Biol Rep. 2010;28:664–675.
- Wang Y, Shao M, Zhu Y, et al. Impacts of land use and plant characteristics on dried soil layers in different climatic regions on the Loess Plateau of China. Agr Forest Meteorol. 2011b;151:437–448.
- He X, Li Z, Hao M, et al. Down-scale analysis for water scarcity in response to soil–water conservation on Loess Plateau of China. Agric Ecosyst Environ. 2003;94:355–361.
- Shi H, Shao M. Soil and water loss from the Loess Plateau in China. J Arid Environ. 2000;45:9–20.
- Gong C, Bai J, Wang J, et al. Carbon Storage Patterns of Caragana korshinskii in Areas of Reduced Environmental Moisture on the Loess Plateau, China. Sci Rep. 2016;6:28883. [11 p.] DOI: 10.1038/srep28883PMID:27412432
- Ning P, Wang J, Zhou Y, et al. Adaptional evolution of trichome in Caragana korshinskii to natural drought stress on the Loess Plateau, China. Ecol Evol. 2016;6:3786–3795.
- Ning P, Zhou Y, Gao L, et al. Unraveling the microRNA of Caragana korshinskii along a precipitation gradient on the Loess Plateau, China, using highthroughput sequencing. PLoS ONE. 2017;12:e0172017. [21 p.]. DOI:10.1371/journal.pone.0172017
- Ye J, Fang L, Zheng H, et al. WEGO: a web tool for plotting GO annotations. Nucleic Acids Res. 2006;44:293–297.
- Li R, Yu C, Li Y, et al. SOAP2: an improved ultrafast tool for short read alignment. Bioinformatics. 2009;25:1966–1967.
- Stekel DJ, Git Y, Falciani F. The comparison of gene expression from multiple cDNA libraries. Genome Res. 2000;10:2055–2061.
- Benjamini BY, Yekutieli D. The control of the false discovery rate in multiple testing under dependency. Ann Stat. 2001;29:1165–1188.
- Patel PK, Hemantaran A. Antioxidant defence system in chickpea (Cicer arietinum L.): influence by drought stress implemented at pre-and post-anthesis stage. Am J Plant Physiol. 2012;7:164–173.
- Zhou M, Li D, Li Z, et al. Constitutive expression of a miR319 gene alters plant development and enhances salt and drought tolerance in transgenic creeping bentgrass. Plant Physiol. 2013;161:1375–1391. DOI:10.1104/pp.112.208702
- Wong ML, Medrano JF. Real-time PCR for mRNA quantitation. Biotechniques. 2005;39:75–85.
- Lynda D, Beaudoin-Eagan T, Thorpe A. Tyrosine and phenylalanine ammonia lyase activities during shoot initiation in tobacco callus cultures. Plant Physiol. 1985;78:438–441.
- Jain S, Choudhary DK. Induced defense-related proteins in soybean (Glycine max L. Merrill) plants by Carnobacterium sp. SJ-5 upon challenge inoculation of Fusarium oxysporum. Planta. 2014;239:1027–1040.
- Wu J, Wang L, Li L, et al. De novo assembly of the common bean transcriptome using short reads for the discovery of drought-responsive genes. PLoS ONE. 2014;9:e109262. [10 p.]. DOI:10.1371/journal.pone.0109262
- Claeys H, Inzé D. The agony of choice: how plants balance growth and survival under water-limiting conditions. Plant Physiol. 2013;162:1768–1779.
- Rausher MD. Co-evolution and plant resistance to natural enemies. Nature. 2001;411:857–864.
- Kessler A, Baldwin IT. Plant responses to insect herbivory: the emerging molecular analysis. Annu Rev Plant Biol. 2002;53:299–328.
- Vogt T. Phenylpropanoid biosynthesis. Mol Plant. 2010;3:2–20.
- Hahlbrock K, Scheel D. Physiology and molecular biology of phenylpropanoid metabolism. Annu Rev Plant Physiol Plant Mol Biol. 1989;40:347–369.
- Ferrer JL, Austin MB, Stewart C Jr, et al. Structure and function of enzymes involved in the biosynthesis of phenylpropanoids. Plant Physiol Biochem. 2008;46:356–370.
- Mithöfer A, Boland W, Maffei ME. Chemical ecology of plant-insect interactions. Molecular aspects of plant disease resistance. Chirchester: Wiley-Blackwell; 2009; p. 261–291.
- Macarisin D, Wisniewski M, Bassett C, et al. Proteomic analysis of β-aminobutyric acid priming and abscisic acid: induction of drought resistance in crabapple (Malus pumila): effect on general metabolism, the phenylpropanoid pathway and cell wall enzymes. Plant Cell Environ. 2009;32:1612–1631.
- Dixon RA, Paiva NL. Stress-induced phenylpropanoid metabolism. Plant Cell. 1995;7:1085–1097.
- Wang JJ, Hu CX, Bai J, et al. Carbon sequestration of mature black locust stands on the Loess Plateau, China. Plant Soil Environ. 2015;61:116–121.
- Posmyk MM, Bailly C, Szafrańska K, et al. Antioxidant enzymes and isoflavonoids in chilled soybean (Glycine max (L.) Merr.) seedlings. J Plant Physiol. 2005;162:403–412.
- Tattini M, Galardi C, Pinelli P, et al. Differential accumulation of flavonoids and hydroxycinnamates in leaves of Ligustrum vulgare under excess light and drought stress. New Phytol. 2004;163:547–561.
- Winkel-Shirley B. Flavonoid biosynthesis. A colorful model for genetics, biochemistry, cell biology, and biotechnology. Plant Physiol. 2001a;126:485–493. DOI:10.1104/pp.126.2.485
- Kim YB, Thwe AA, Li X, et al. Accumulation of flavonoids and related gene expressions in different organs of Astragalus membranaceus Bge. Appl Biochem Biotechnol. 2014;173:2076–2085.
- Winkel-Shirley B. It takes a garden. How work on diverse plant species has contributed to an understanding of flavonoid metabolism. Plant Physiol. 2001b;127:1399–1404.
- Mok DWS, Mok MC. Cytokinin metabolism and action. Annu Rev Plant Physiol Plant Mol Biol. 2001;52:89–118.
- Riccardi F, Gazeau P, de Vienne D, et al. Protein changes in response to progressive water deficit in maize. Plant Physiol. 1998;117:1253–1263.
- Walker MA, Dumbroff EB. Effects of salt stress on abscisic acid and cytokinin levels in tomato. Zeitschrift Für Pflanzenphysiologie. 1981;101:61–470.
- Müller D, Leyser O. Auxin, cytokinin and the control of shoot branching. Ann Bot. 2011;107:1203–1212.