
 ?Mathematical formulae have been encoded as MathML and are displayed in this HTML version using MathJax in order to improve their display. Uncheck the box to turn MathJax off. This feature requires Javascript. Click on a formula to zoom.
Abstract
Focusing on the sediment in Suyahu Reservoir (a typical plain reservoir in Henan Province, China), concentrations of eutrophication-causing substances (TOC, TN and TP) and heavy metal contamination (Zn, Pb, Cd, Cu, Cr, Ni, As and Hg) were measured. Spatial distribution of these contaminants and the resulting potential ecological risk were investigated in detail. The results indicated that the eutrophication-causing substances were concentrated in the reservoir sediment, with high concentrations in the south and low concentrations in the north due to hydrodynamics. The reservoir sediments were polluted and had an eutrophication problem due to the high average organic index. Heavy metals were deposited at the bottom near the centre of the reservoir. The comprehensive potential ecological risk index was Moderate, whereas Cd and Hg contributed 78.8% to the total risk-index values, and were the main factors of heavy mental pollution. Therefore, it was necessary to prevent and treat polluted sediments to prevent secondary pollution.
Introduction
The construction of a dam reduces a river’s flow velocity and its sediment carrying capacity, and leads to reservoir sedimentation [Citation1]. Estimates suggest that sedimentation accounts for 0.5% to 1.0% loss in reservoir storage capacity per annum worldwide [Citation2]. Sedimentation not only reduces the reservoir storage capacity, but can also lead to accumulation of pesticides, heavy metals and other toxic substances. These pollutants are adsorbed onto sediment particles and affect the reservoir environment and ecological security [Citation3, Citation4]. The present research on reservoir bed pollutants mainly focuses on the pollutant detection, characteristics analysis and ecological risk assessment in natural water bodies such as rivers and lakes. The concentrations of total organic carbon (TOC), total nitrogen (TN) and total phosphorus (TP) reflect the nutrient excess of sediments and cause reservoir eutrophication. Zn, Pb, Cd, Cu, Cr, Ni, As and Hg are the eight heavy metals with the greatest ecological risk, so are important indicators for both water environmental monitoring and potential hazard assessment [Citation5–7].
The pollution of artificial lakes and reservoirs has also attracted attention recently. The spatial and temporal variability of heavy metal concentrations in Ivan’kovo Reservoir bottom sediments was studied by Brekhovskikh et al. [Citation8]. The study found that the vertical distribution of these heavy metals in the bottom sediments is related to the level of contamination and rate of water exchange in the reservoir [Citation8]. The geochemical speciation of metals in the sediments in the Lobo-Broa Reservoir has been analyzed and could be useful in developing effective management strategies to control metal pollution in this reservoir [Citation9]. The surface sediments in bays and tributaries of the Danjiangkou Reservoir, which is an important strategic water source in China, has been studied, and the results show that its pollutants cause a state of high ecological risk [Citation10]. However, research on detection and environmental impact assessment of reservoir sediment pollution is relatively scarce, and is mainly limited to large reservoirs with strong hydraulic regulation capacity, while research on distributed plains or hilly reservoirs is rare. Because of the small hydraulic gradient and poor hydraulic sediment discharge conditions of plain and hilly reservoirs, the cumulative effects of siltation and pollution are more significant, and water environment problems would become more serious with rapid development of the regional economy and the changes in the water environment [Citation11].
In this article, Suyahu Reservoir, a typical plain reservoir in Henan Province, China, was taken as the research object. Then the concentration of TOC, TN and TP, as well as heavy metals (Zn, Pb, Cd, Cu, Cr, Ni, As and Hg) were detected and analyzed. Trends in accumulation of pollutants were determined. The pollution level and ecological risk of heavy metals were evaluated by the potential ecological risk index method. The purpose was to provide scientific guidance for ecological risk assessment and comprehensive management of sediment in plain reservoirs.
Research area
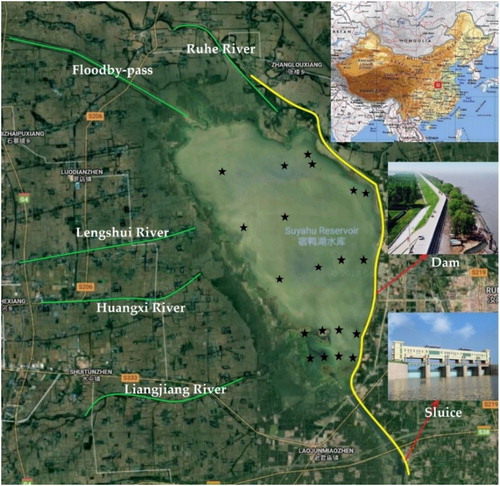
Suyahu Reservoir (32.965°∼33.070°N, 114.189°∼114.298°E) is located in Huaihe Basin, Henan Province, China, and drains a basin area of 4498 km2. It is a large-scale hydro-junction project with a total reservoir capacity of 1.638 billion m3, mainly for flood control, combined with irrigation, power generation, aquaculture and tourism. The main hydraulic structures are dams, spillway gates and irrigation gates (). The reservoir is a typical plain reservoir with a low bed slope and a large reservoir area. The topography below the reservoir declines from northwest to southeast with a slope of about 1/8000. Therefore, in the flood season, the upstream mud-laden water enters the reservoir area and discharges slowly. In addition, the distance between the main reservoir area and the sluice gate is about 30 km, and the long discharge passage causes a large amount of mud and sand to sink to the reservoir bottom. The reservoir sediment survey in 2016 showed that the total amount of siltation had reached 77.1 million m3, which has a significant effect on the reservoir’s flood defence capability.
Figure 1. Suyahu Reservoir and sediment sampling points. Source: Authors.
Reservoir siltation also brings environmental impacts. According to an analysis of water quality monitoring data from 2009 to 2015, five-day BOD and NH3-N severely exceeded the standard, and eutrophication in the reservoir is serious, affecting aquatic habitats [Citation12]. However, contamination of sediment at the reservoir bottom has not been addressed or monitored. In recent years, silt removal and capacity expansion has been on the agenda due to increasing demand for water resources. How polluted is the sediment at the reservoir bottom, and does it affect the plan for silt removal and treatment? The answers to these questions are currently lacking relevant data and analysis. Therefore, it is necessary to measure and analyze the environmental indicators of the reservoir sediment, so as to provide important supporting data for the safe operation and environmental management of the reservoir.
Materials and methods
Measurement of sediment environmental indicators
The measured environmental indicators include two main categories: eutrophication-related substances TOC, TN and TP; and heavy metals Zn, Pb, Cd, Cu, Cr, Ni, As and Hg.
Sample collection
Five survey sections were selected from north to south with four sampling positions along each section in October 2015, totalling 20 sampling points (). A gravity dredger was used to collect columnar samples of sediment from the reservoir bed, and samples were stratified immediately after they were brought ashore. The sampling core length was 0.6–2.7 m, based on the thickness of the sediment at each sample point.
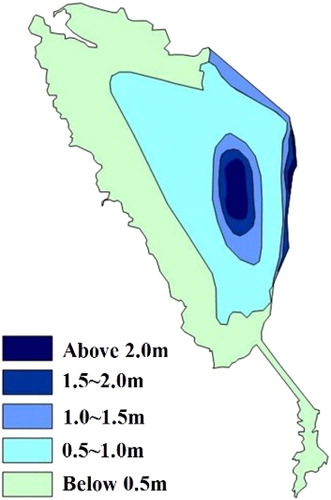
The sediment at the reservoir bottom can be divided into three layers: the upper layer with thickness of about 0.4–2.5m (), mainly soft plastic, grey silt containing humus and shell fragments; the middle layer with thickness of about 0.30–0.45 m, mainly soft plastic, grey or yellow–grey, muddy or silty clay; and the lower layer with thickness of over 2.0 m (not drilled through), mainly plastic, grey yellow, silty clay.
Figure 2. Distribution of mud thickness in the upper bed layer of Suyahu Reservoir. Source: Authors.
Samples were sealed in separate polyethylene bags after stratification, transported back to the laboratory, and stored at a low temperature of 5 °C. The samples were then air-dried at room temperature, ground into powder, then sorted with a 200 mesh nylon screen.
Sample measurement methods
The sample characteristics were determined in the laboratory. The specific method for determination of TOC and TN was potassium dichromate-sulfuric acid digestion, and TP was determined using perchloric acid–sulfuric acid digestion. The detection of eutrophication-related substances was carried out according to the Code for Investigation of Lake Eutrophication (2nd Edition) [Citation13]. Seven heavy metals (Zn, Pb, Cd, Cu, Cr, Ni and As) were measured with inductively coupled plasma mass spectrometry (ICP-MS, 7700X) referring to USEPA Method 6020 A (SW-846, Revision 1, January 1998). Hg was measured with a Hydra-c Automatic Mercury Measuring Instrument using USEPA Method 7473 (SW-846, Revision 0, February 2007).
Ecological risk assessment methods
The organic index method [Citation14] was used to evaluate the fertility of sediment via EquationEquation (1)(1)
(1) .
(1)
(1)
where Organic carbon (%) is TOC(%); Organic nitrogen (%) is TN(%)×0.95, as TN involves organic nitrogen and ammonium nitrogen, and organic nitrogen occupies the majority. Organic index of less than 0.03 corresponds to level I (Oligotrophic); organic index of 0.03–0.05 corresponds to level II (Mesotrophic), organic index greater than 0.05 corresponds to level III (Eutrophic).
The following two equations were used to calculate the heavy metal potential ecological risk. EquationEquation (2)(2)
(2) shows the single heavy metal potential ecological risk index.
(2)
(2)
Here, is the potential ecological risk coefficient of the ith heavy metal;
is the toxicity coefficient of the ith heavy metal (shown in ), reflecting the toxicity of the heavy metal and the sensitivity of organisms to the pollutant;
are, respectively, the measured and background concentrations of heavy metals in sediments, in which the background value refers to the Chinese Soil Element Background Value (1990) (shown in ) [Citation15].
Table 1. Background values and toxicity coefficients of heavy metals [Citation15].
Table 2. Potential ecological risk levels of heavy metals [Citation16]
EquationEquation (3)(3)
(3) shows the comprehensive risk index for heavy metals.
(3)
(3)
Here, is the comprehensive potential ecological risk index, and the categories of risk factors
and
are shown in [Citation16].
Data analysis
Data are presented as mean values from 20 independent measurements, with standard deviation (±SD). Statistical analysis was performed using Excel 2016.
Results and discussion
Eutrophication
The statistics of TOC, TN and TP in the sediments from Suyahu Reservoir are shown in .
Table 3. Statistics of eutrophication-related substances in the sediment in Suyahu Reservoir.
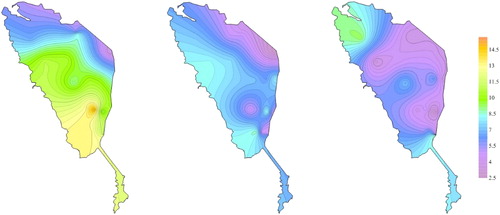
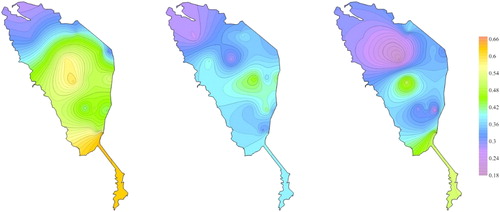
The spatial distribution of TOC in the sediment is shown in . The results showed that the organic matter content in the reservoir sediment increased gradually in the downstream direction. TOC is related to the accumulation of organic debris along the flow direction. The vertical distribution of TOC showed a concentration decrease from the surface layer to deeper layers. This was especially apparent in the southern region of the reservoir, where the highest concentration of TOC in the upper layer of bed sediment was 15.08% and the lowest concentration in the lower layer was only 2.78%; this reflected the accumulation process of organic carbon.
Figure 3. Spatial distribution of TOC concentration (%) in sediment (Upper, Middle and Lower). Source: Authors.
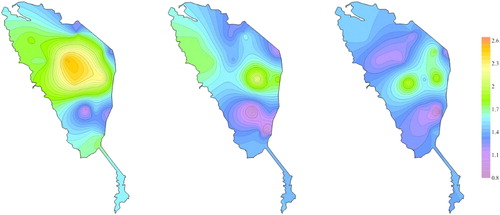
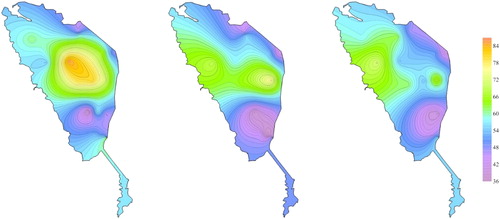
The spatial distribution of TN in the sediment is shown in . This indicated that the concentration of TN in the upper layer of bed sediment was relatively high, an average of 1.70 mg/g. TN concentrations were higher in the centre of the reservoir and lower around the banks. The lowest concentration of TN was near the Lianjiang River, only about 1.0 mg/g, whereas the maximum value was about 2.5 mg/g in the reservoir centre. Similar to TOC, the vertical distribution of the TN concentration gradually decreased from the upper to deeper layers, whereas the spatial distribution in the middle and lower layers was similar to that in the surface layer, reflecting the gradual accumulation of TN in the reservoir sediment.
Figure 4. Spatial distribution of TN concentration (mg/g) in sediment (Upper, Middle and Lower). Source: Authors.
The concentration of TP in the reservoir sediment was also very high (), with an average value of 4.70 mg/g in the upper sediment layer. The spatial distribution of P showed a gradual increase from upstream to downstream (sluice gates), with a maximum value of 6.50 mg/g, which was about twice the upstream concentration. The vertical distribution of TP is similar to TOC and TN, showing a decrease in concentration with depth.
Figure 5. Spatial distribution of TP concentration (mg/g) in sediment (Upper, Middle and Lower). Source: Authors.
Generally, chemical fertilizers and pesticides, which are widely used in farming of the upper reservoir watershed, accumulate in the soil, and then enter the reservoir from rivers. This causes organic matter pollution and eutrophication of the reservoir water [Citation17]. The area west of Suyahu Reservoir has many villages and farms. A large volume of chemical fertilizers and pesticides are used for agricultural production. This was reflected in the spatial distribution of the measured values of the eutrophication indicators (TOC, TN and TP), as the concentrations in the western and northwestern lake were generally larger than elsewhere along the shoreline. In addition, the distribution of organic matter such as TOC and TP was more pronounced in the south and lower in the north (TN was enriched in the reservoir centre), especially in the upper layer of sediment. The closer to the spillway gates, the higher the concentration of organic matter was, which showed that the flow field and hydrodynamic conditions had a significant impact on the migration of organic matter.
Based on the collected data, the average organic indexes of Suyahu reservoir sediment were calculated using EquationEquation (1)(1)
(1) , and the results from the upper to the lower layers were 1.55, 0.81, and 0.67, respectively, which all fell into III level. This indicated that the fertility of the reservoir sediment was very high and there was an eutrophication problem. The values of the organic index decreased rapidly from upper to middle sediment layers; this may be related to the low permeability of silty clay in the middle and lower sediment layers of the reservoir bed. It might also reflect the recent intensification of water pollution, as chemical fertilizers and pesticides are still widely used upstream of the reservoir, which results in continuous accumulation of pollutants in the upper sediment layer.
Heavy metals
presents the measured values of heavy metal concentrations in the sediment of Suyahu Reservoir. The heavy metal concentrations in the surface sediments were generally high in the reservoir centre and low around the banks. The concentrations were highest in the upper layer and lowest in the lower layer.
Table 4. Statistics of heavy metal concentrations (mg/kg) in the sediment of Suyahu Reservoir.
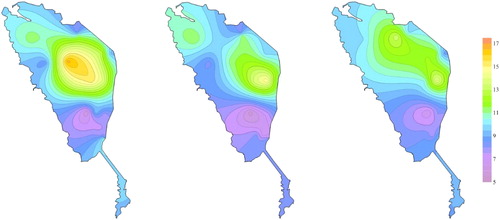
The spatial distribution of Cr concentration in the sediment () was similar to the distribution of Zn, Cu and Ni. These heavy metals concentrated not only in the reservoir centre, but also near the Flood By-pass, Lianjiang River, and Lengshui River (see ), indicating that these rivers were the main sources of heavy metal pollution.
Figure 6. Spatial distribution of Cr concentration (mg/kg) in sediment (Upper, Middle and Lower). Source: Authors.
The spatial distribution of As concentration in the sediment is shown in . The concentration of As was higher near the Flood By-pass and Ruhe River, which indicated the corresponding upstream sources of As.
Figure 7. Spatial distribution of As concentration (mg/kg) in sediment (Upper, Middle and Lower). Source: Authors.
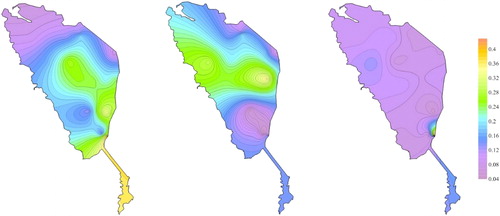
The spatial distribution of Cd concentration in the sediment is shown in . The distributions of Hg and Pb were similar. They were most concentrated in the reservoir centre, with lower concentrations upstream, which indicated that these heavy metals mainly came from historical accumulation, and the main sources were the Huangxi River and Lengshui River.
Figure 8. Spatial distribution of Cd concentration (mg/kg) in sediment (Upper, Middle and Lower). Source: Authors.
Heavy metals enter the reservoir mainly through atmospheric wet and dry deposition, and discharge from active point sources in industry and mining [Citation18]. They then enter the sediment through adsorption and deposition of suspended particulate matter, co-precipitation of anions and cations and diffusion of free ions. The sediment becomes a sink and source of heavy metals [Citation19]. The concentration of heavy metals in the upper layer of sediment was highest in the reservoir centre, indicating that heavy metals were not greatly affected by flow forces, but instead settled rapidly and accumulated at the reservoir bottom. Heavy metal pollution spread to the reservoir from upstream rivers such as the Lianjiang River and the Lengshui River. Since these rivers run through the urban area of Zhumadian city, it could be inferred that urban effluents from industrial production were the main source of heavy metals, and these were transported by rivers and entered the reservoir with no or little prior treatment. The identification of the main contamination sources of heavy metals in other water bodies such as Nador lagoon and Ivan’kovo Reservoir showed similar results; heavy metals occur largely due to anthropogenic activities or industrial production in the upstream area (urban effluents) [Citation8, Citation19].
Heavy metals showed similar vertical distributions to TOC, TN and TP, with values decreasing gradually from the upper to lower sediment layers. This reflects the recent intensification of water pollution, as pollutant loading has not yet been effectively stopped.
Potential ecological risk assessment
Because the eight heavy metals Zn, Pb, Cd, Cu, Cr, Ni, As and Hg carry great ecological risk, a potential ecological risk assessment was carried out. At present, the environmental risk assessment methods for heavy metals in sediments include the single factor pollution index method, ground accumulation index method, potential ecological risk index method and secondary phase comparison method [Citation16, Citation20–22]. The potential ecological risk index method uses the degree of accumulation of heavy metals in sediment relative to the highest background value in sediment before industrialization and the corresponding ecological toxicity coefficient, with a weighted sum leading to the ecological hazard index. This has the advantage of evaluating not only individual heavy metals, but also a variety of heavy metals comprehensively, and is widely used at present [Citation16, Citation20]. This method was also used to assess the potential ecological risk of Suyahu Reservoir sediments.
Based on the collected data, all heavy metals exceeded the background values () at some locations. From the calculations of the potential ecological risk coefficient of each heavy metal using EquationEquation (2)(2)
(2) and EquationEquation (3)
(3)
(3) , the ranking of pollution from low to high was Zn, Cr, Cu, Ni, Pb, As, Hg, Cd. The potential ecological risk coefficients of six heavy metals (Cu, Cr, Zn, Pb, As and Ni) were relatively small, with average values of 4.845, 1.702, 0.925, 5.378, 8.724 and 4.949, respectively. These all corresponded to a Low risk. The average potential ecological risk coefficient of Hg was 40.856, which was a Moderate risk but only slightly above the Low risk bracket. The average potential ecological risk coefficient of Cd was 57.646, indicating Moderate risk, while far below the Considerable risk bracket.
The comprehensive potential ecological risk index RI average value was 125.03. Based on the classification criteria of heavy metal ecological risk (), this corresponded to a pollution level of Moderate risk in the sediment. The major contributions to potential ecological risk from heavy metals were Cd and Hg. The of Cd and the
of Hg contribute 46.1% and 32.7% of values to the total RI in EquationEquation (3)
(3)
(3) , respectively. These values are similar to other reservoirs and lakes in China [Citation23, Citation24]. The main cause is that the distribution of Cd and Hg (and Pb as well) are dominated by anthropogenic activities.
Conclusions
Among the eutrophication-inducing substances in Suyahu Reservoir, the concentrations of TOC and TP were high in the central and southern reservoir and low in the north, whereas the TN concentration was highest in the centre of the reservoir. This indicated that organic matter migrates with the flow. On the other hand, heavy metals were less affected by hydrodynamics, and rapidly settle to the reservoir bed. Heavy metal pollution spreads from upstream river entrances to the reservoir. It could be inferred that industrial production and manufacturing are likely the main sources of metals. All investigated indicators showed a vertical behaviour such that concentrations were greatest in the upper sediment layer and smallest in the lower sediment layer. This reflected recent intensification of pollution loading, leading to the accumulation of contaminated substances in surface sediments. The concentrations of TOC, TN and TP in reservoir sediments were very high; the average organic index of the upper layer reaches 1.55, which corresponded to level III. This indicated that the sediment has an eutrophication problem. The average value of the comprehensive potential ecological risk index of heavy metals was 125.03, which refers to the moderate risk level. This risk was dominated by Cd and Hg, contributing 46.1% and 32.7% values, respectively, to the total heavy metal risk. The individual potential ecological risk coefficients of these heavy metals also reached the moderate risk level. Therefore, reservoir managers should pay attention to treatment of environmental pollution in the next step of sediment removal to prevent secondary pollution.
Disclosure statement
No potential conflict of interest was reported by the authors.
Additional information
Funding
Notes on contributors
Ziyang Li
Conceptualization, Formal Analysis, Investigation, Visualization and Writing-Original Draft Preparation, Ziyang Li; Data Curation, Formal Analysis, Investigation and Visualization, Jixiang Huo; Data Curation, Formal Analysis and Writing-Review & Editing, Jeremy D. Bricker.
Jixiang Huo
Conceptualization, Formal Analysis, Investigation, Visualization and Writing-Original Draft Preparation, Ziyang Li; Data Curation, Formal Analysis, Investigation and Visualization, Jixiang Huo; Data Curation, Formal Analysis and Writing-Review & Editing, Jeremy D. Bricker.
Jeremy D. Bricker
Conceptualization, Formal Analysis, Investigation, Visualization and Writing-Original Draft Preparation, Ziyang Li; Data Curation, Formal Analysis, Investigation and Visualization, Jixiang Huo; Data Curation, Formal Analysis and Writing-Review & Editing, Jeremy D. Bricker.
Related Research Data
References
- Schleiss AJ, Franca MJ, Juez C. Reservoir sedimentation. J Hydr Res. 2016;54:595–614.
- White R. Evacuation of sediments from reservoirs. London: Thomas Telford Services Ltd; 2001.
- Dimitra GG, Gimitra AL, Ioannis KK, et al. Environmental monitoring and ecological risk assessment for pesticide contamination and effects in Lake Pamvotis, northwestern Greece. Environ Toxic Chem. 2005;24:1548–1556.
- Marengo E, Gennaro MC, Robotti E, et al. Investigation of anthropic effects connected with metal ions concentration, organic matter and grain size in Bormida river sediments. Anal Chim Acta. 2006;560:172–183.
- Akcay H, Oguz A, Karapire C. Study of heavy metal pollution and speciation in BuyakMenderes and Gediz river sediments. Water Res. 2003;37:813–822.
- Zhang W, Jin X, Di Z, et al. Heavy metals in surface sediments of the shallow lakes in eastern China: their relations with environmental factors and anthropogenic activities. Environ Sci Pollut Res.. 2016;23:25364–25373.
- Makokha VA, Qi Y, Shen Y, et al. Concentrations, distribution, and ecological risk assessment of heavy metals in the East Dongting and Honghu Lake, China. Expo Health. 2016;8:31–41.
- Brekhovskikh VF, Volkova ZV, Kocharyan AG. Heavy metals in the Ivan’kovo reservoir bottom sediments. Water Res. 2001;28:278–287.
- Cervi EC, Fernandes F, Miranda RB, et al. Geochemical speciation and risk assessment of metals in sediments of the Lobo-Broa Reservoir, Brazil. Manage Env Qual. 2017;28:430–443.
- Lei P, Zhang H, Shan B. Analysis of heavy metals pollution and ecological risk assessment in the sediments from the representative river mouths and tributaries of the danjiangkou reservoir. Res Environ Yangtze Basin. 2013;22:110–117.
- Kuang S, Bao Q, Kang D, et al. Distribution patterns and ecological risk assessment of heavy metal contamination in surface sediments deposited in a typical small sized water reservoir. J Lake Sci. 2018;30:336–348.
- Nanjing Hydraulic Research Institute. Special study report on sedimentation cleaning and reservoir capacity expansion of suyahu reservoir in Henan Province. Nanjing: Nanjing Hydraulic Research Institute; 2016.
- Jin X, Tu Q. Code for investigation of Lake Eutrophication. 2nd ed. Beijing: China Environmental Science Press; 1990.
- Tu Q, Gu D. Study on eutrophication of Chaohu Lake. Hefei: China University of Science and Technology Press; 1990.
- China Environmental Monitoring Station. Chinese soil element background value. Beijing: China Environmental Science Press; 1990.
- Lars H. An ecological risk index for aquatic pollution control: A sedimentological approach. Water Res. 1980;14:975–1001.
- Yang Y, Liu M, Yun X, et al. Profiles and risk assessment of organochlorine pesticides in three gorges reservoir, China. Clean Soil Air Water. 2017;45:1600823–1600827.
- Maanan M. Heavy metal concentrations in marine molluscs from the Moroccan coastal region. Environ Pollut. 2008;153:176–183.
- Maanan M, Saddik M, Maanan M, et al. Environmental and ecological risk assessment of heavy metals in sediments of Nador lagoon, Morocco. Ecol Indicator. 2015;48:616–626.
- Pekey H, Karakaş D, Ayberk S, et al. Ecological risk assessment using trace elements from surface sediments of Izmit Bay (Northeastern Marmara Sea) Turkey. Mar Pollut Bull. 2004;48:946–953.
- Müller G, Putz G. Index of geo accumulation in sediments of the Rhine River. Geol J. 1969;2:108–118.
- Herman C. The use of faces to represent points in k-dimensional space graphically. J Am Stat Assoc. 1973;68:361–368.
- Zhao SM, Wang DW, Li XM, et al. Assessment on heavy metals pollution in surface sediments of Dianchi Lake and its estuaries. Ecol Environ Sci. 2014;33:276–285.
- Liu M, Yang Y, Yun X, et al. Distribution and ecological assessment of heavy metals in surface sediments of the East Lake, China. Ecotoxicology. 2014;23:92–101.