
 ?Mathematical formulae have been encoded as MathML and are displayed in this HTML version using MathJax in order to improve their display. Uncheck the box to turn MathJax off. This feature requires Javascript. Click on a formula to zoom.
Abstract
The fermentation system is a metabolic system that can be considered as a complex system, since it involves metabolites linked by different reactions. Some outputs of the reaction act as input in the other reactions and they control the behaviour of the system. Glucose as the main carbon source of the yeast cells plays an important role in the cell’s reproduction cycle and product synthesis. Glucose promotes negative feedback to some reactions in the central metabolism of the yeast cell. In this paper we mathematically study the effects of the negative feedback (inhibition) by glucose and other metabolites on the dynamics of the fermentation system. We also study the sensitivity of the flux in the presence of inhibition. We found that high inhibition by glucose affects the concentration of acetyl-CoA, which will lead to the respiration pathway of the yeast cells. High inhibition by acetaldehyde affects the concentration of all metabolites, including the maximal concentration of ethanol. Based on the metabolic control analysis results, we found that glucose can be considered as the external regulating point in increasing the flux of ethanol. Although glucose acts as a negative feedback, it can also be used to promote certain processes in the metabolic pathway since it gives the highest positive control in increasing the flux of ethanol as the desired product. For the internal regulation point, the maximal concentration of ethanol can be increased significantly by regulating the maximal activity of alcohol dehydrogenase and acetaldehyde dehydrogenase simultaneously.
Introduction
Introducing a new cellular process is one of the genetic engineering targets for improving cell productivity [Citation1, Citation2]. Metabolic engineering is a process that can convert, for example, renewable carbon sources into biofuels [Citation3]. The process alters enzyme activity to redirect carbon fluxes toward biofuel production [Citation3, Citation4]. Since conversion of substrate into biofuels involves a complex metabolic network, theoretical approach is needed as a tool to study the complex system to complete the experimental study. Theoretical studies provide high predictive power to design cells with desirable properties cheaply and reliably according to the needs of biotechnology production [Citation5, Citation6]. Some researchers used advanced mathematical model to capture the dynamical behaviour of a complex metabolic system such as the fermentation system [Citation7–14]. The model was applied as a predictive tool that can be compared with experimental data in terms of conversion of substrate becomes product under steady state condition. A valid model would presents a good agreement with the experimental data such that the model can be used as a miniature or a model prediction of the complex metabolic system. The model can be used as a strategic tool for the design and optimisation of metabolic network in metabolic engineering [Citation1, Citation8].
Each complex metabolic system is regulated by several enzymes which control the rate of the reaction process. In the biochemical pathway, the product of one reaction becomes a substrate in the next reaction until the final product is synthesised. Fermentation system is a complex metabolic system where yeast, such as Saccharomyces cerevisiae, converts glucose as the substrate to pyruvate acid via the glycolysis pathway and then go one step further converting pyruvate into ethanol. One glucose molecule is converted into two ethanol molecules and two carbon dioxide molecules [Citation15, Citation16]. Each reaction process is catalysed by different enzyme with different mechanism. In the previous study, we derived a kinetic model of the fermentation system by taking into consideration the central metabolism of fermentation pathway. The characteristics of enzymes in the main yeast cell pathway were studied, such as the possibility of delays in a reaction due to the existence of a rate limiting step, in which the conformational changes of the enzyme structure require certain time to rearrange the structure until it is ready to bind the substrate again [Citation17]. We found that there existed a bifurcation diagram for the delay that depended on the rate of glucose supply and kinetic parameters of the delayed reaction. There also existed a certain glucose supply that may optimise ethanol production. In the other study, we also investigated the key enzymes that can be regulated to enhance ethanol production [Citation9]. We found that there were supply glucose as an external control parameter and three enzymes as internal regulation targets that can be adjusted in enhancing ethanol production. The three enzymes are acetaldehyde dehydrogenase, pyruvate decarboxylase and alcohol dehydrogenase which reside in the acetaldehyde branch point. In this study, we will continue our investigation regarding analysis of the optimality conditions of the yeast cell to produce ethanol with high concentration. The existence of internal feedback inhibitions becomes the key point of this study since some experimental researchers found that acetaldehyde acts as inhibitor for glycolytic pathway and glucose inhibits the reaction catalysed by pyruvate dehydrogenase complex [Citation18–20]. Here, we continue our theoretical analysis by using mathematical model to study the effects of the existence of inhibitions to the dynamical behaviour of metabolites in the central metabolism of the yeast cell, especially its effects to the optimal production of ethanol. We also apply metabolic control analysis to identify the sensitivity of the positive steady-state properties of the ethanol concentration and ethanol flux to a small parameter change due to the existence of feedback inhibition. Our analysis serves as a starting point to investigate the major biotechnological questions such as the observation of complex cellular behaviours, the prediction of the outcomes of metabolic with perturbations and the improvement of the desired property of the yeast metabolism.
The paper is organized as follows: in the Methods section, we formulate the kinetic model of fermentation system by taking into consideration the internal feedback inhibition by glucose and acetaldehyde and also present the mathematical analysis of the model. In Results and discussion section, some numerical simulations are presented to study the transient behavior of the metabolites and using metabolic control analysis, the steady-state properties of the system are discussed to analyze the sensitivity of kinetic parameters. Some remarks and conclusions are presented in the last section.
Methods
Kinetic formulation
In this paper, we propose a mathematical model describing the chemical conversion of metabolites in the central metabolism of a yeast cell. The modelling formulation follows the line of Lei et al. [Citation7] and Kasbawati et al. [Citation9]. We consider a continuous fermentation process that occurred at ideal conditions.
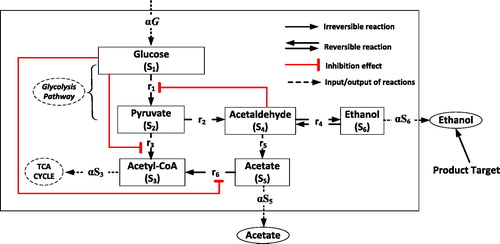
As shown in , we assume that the carbon metabolism on the central yeast metabolic pathway is started with the uptake of glucose. The glucose (S1) is converted into pyruvate (S2) via glycolysis pathway, a lumped reaction [Citation7]. Chemical conversion of glucose into pyruvate as the last product of glycolytic pathway is modelled using Michaelis-Menten kinetic Equationequation [7(7a)
(7a) ,Equation9]
(9)
(9) . Since there exists uncompetitive internal inhibition by acetaldehyde (S4) to the glycolytic pathway [Citation20], the Michaelis-Menten kinetic equation becomes
(1)
(1)
where
is an inhibition constant of
with respect to
is the maximum reaction of glucose conversion to become pyruvate in the glycolysis pathway and K1 is the Michaelis constant. The pyruvate is then converted to become acetaldehyde
) by pyruvatedecarboxylase (
) and acetyl-CoA (
by pyruvate dehydrogenase complex (
). The kinetics for pyruvate decarboxylase is
(2)
(2)
with maximum reaction rate
and Michaelis constants
Based on the study of Alexander and Jeffries [Citation19], it was known that glucose is an inhibitor for the pyruvate dehydrogenase complex. It inhibits the enzyme noncompetitively meaning that the higher the concentration of the glucose, the more likely that glucose will bind to the allosteric site of the enzyme. When the levels of glucose fall below a threshold, the effect of the negative feedback diminishes and pyruvate dehydrogenase complex is reactivated. Therefore, we have the kinetic equation for this reaction:
(3)
(3)
with maximum reaction rate
Michaelis constants
and inhibition constant
The product of
then leads to the respiration pathway of the yeast cell, i.e. the TCA cycle, which produces energy for the cell, whereas acetaldehyde leads to the fermentative pathway, in which it is converted to become acetate (S5) and ethanol (S6). Both conversion processes are, respectively, catalysed by acetaldehyde dehydrogenase and alcohol dehydrogenase. Alcohol dehydrogenase catalyses the reaction by a reversible mechanism, whereas acetaldehyde dehydrogenase catalyses the reaction by an irreversible mechanism, such that we have the kinetic equation for the both reactions:
(4)
(4)
(5)
(5)
Figure 1. Central metabolism of Saccharomyces cerevisiae. Reaction r1 is a lumped process of glucose conversion to become pyruvate and reaction ri, i = 2,…,6 is a chemical conversion catalysed by: (2) pyruvate decarboxylase, (3) pyruvate dehydrogenase complex, (4) alcohol dehydrogenase, (5) acetaldehyde dehydrogenase and (6) acetyl-CoA synthetase.
Acetyl-CoA syntehase then converts acetate to become acetyl-CoA that also leads to the respiration pathway. Since it is known that there also exists noncompetitive internal inhibition by glucose to this reaction [Citation21], we have the kinetic equation for this reaction:
(6)
(6)
where
is an inhibition constant of
with respect to
is the maximum reaction rate of acetyl-CoA syntehase, and K6 is the Michaelis constant.
By using the mass action rate law and the formulated kinetic Equationequation (1)–(6), we then derive the mathematical model of the metabolites in the central metabolism of the yeast cell with internal inhibition as follows:
(7a)
(7a)
(7b)
(7b)
(7c)
(7c)
(7d)
(7d)
(7e)
(7e)
(7f)
(7f)
with initial conditions
(7g)
(7g)
where
are initial concentration of metabolites which are greater or equal to zero. All parameters in model (7) are assumed positive. The mathematical properties of the model are derived in the following section.
Mathematical analysis
In this section we use stability theory to derive the mathematical properties of the kinetic model (7). One of the mathematical properties of the system that will be analysed is the stability conditions of the positive steady state of system (7). The steady state solution is defined in the region
At the equilibrium condition EquationEquation (7(7a)
(7a) a) becomes
(8)
(8)
such that we get the equilibrium solution for S1 depending on the equilibrium solution of S4,
(9)
(9)
The equilibrium solution of S1 will be positive if it fulfils the conditions
(10)
(10)
These conditions imply that the maximum rate of reaction in the glycolysis pathway should be greater than the maximum inflow of glucose supply, and steady state concentration of S4 should be maintained in the interval From EquationEquation (7
(7a)
(7a) b), we get
(11)
(11)
which can be rewritten in quadratic polynomial,
(12)
(12)
with
The roots of polynomial (12) are equilibrium solutions of S2 which depend on the equilibrium solutions of S1 and S4. If the equilibrium solution of S1 fulfils condition (10), then we have a3>0. Using Descartes rule of sign [Citation22], we have two possibilities number of positive roots of (12). When and
two positive roots of polynomial (12) exist. Otherwise, when
and
or
one positive root of polynomial (12) exists. Therefore, polynomial (12) will produce at most two positive roots for S2. This condition leads to the possibility of the existence of multiple steady states in the system where the fermentation system will generate different steady state concentrations for different initial conditions.
Furthermore, from (7c) we get the equilibrium solution of S3:
(13)
(13)
that will be positive if the equilibrium solutions of S1, S2 and S5 are positive. From (7d), we have
(14)
(14)
that can be rewritten as a quadratic polynomial as follows:
(15)
(15)
with
If the equilibrium solutions of S2 and S6 are positive, then we get b3>0. Using the similar analysis with S2, we find that the polynomial (15) will produce at most two positive roots for S4. This result also leads to the possibility of multiple steady states in the modelled fermentation system. Furthermore, from (7e) we have
(16)
(16)
that also can be rewritten in a quadratic polynomial form, i.e.
(17)
(17)
with
Since c1>0 and c3<0 when S1 and S4 are positive, then polynomial (17) will produce at most one positive equilibrium solution for S5.
Furthermore, from the last EquationEquation (7(7a)
(7a) f), we have
(18)
(18)
In quadratic polynomial form, EquationEquation (18)(18)
(18) can be rewritten as follows:
(19)
(19)
with
Since d1>0 and d3<0 when S4>0, we get that S4 has only one positive equilibrium solution.
Summarising our analysis results, we found that the fermentation system (7) has an equilibrium solution where
and
respectively, stand for the i-th positive root of S2 and S4. This steady state solution shows the steady state concentration of metabolites when the inhibitions exist in the system.
Furthermore, the mathematical property of the system (7) that will be studied is the local stability of the equilibrium point E. We analyse its local stability behaviour by investigating the eigenvalues of the Jacobian matrix of the linearised system (7). By linearising system (7) around the equilibrium point E, we get the following Jacobian matrix:
(20)
(20)
where
We can observe that two eigenvalues of matrix J are negative, i.e.
(21)
(21)
The rest of eigenvalues of matrix J is the solutions of the characteristic equation,
(22)
(22)
where coefficients
depend on
Because the coefficients of polynomial (22) depend on the steady state E and the large number of kinetic parameters, it is difficult to determine the value of its roots. Routh–Hurwitz criteria gives conditions on the coefficients of a polynomial such that the zeros of the polynomial have negative real part [Citation22]. For polynomial (22), the conditions are
or
Therefore, the steady state E will be locally asymptotically stable, if it fulfils the conditions (i)–(iv) meaning that for a certain experimental condition, the fermentation system will produce metabolites with the amount of concentration indicated by point E. In the next section we will present some numerical simulations to clarify these mathematical results and to capture the transient behaviour of the system (7) for a certain experimental condition indicated by kinetic values given in .
Table 1. The kinetic parameters of system (7) taken from [Citation7].
Results and discussion
Numerical simulations
In this section, we present some numerical simulations to validate the mathematical analysis and to capture the transient behaviour of solutions of system (7). Some simulations are presented to observe effects of the existence of the internal inhibitions. Using kinetic parameter values given in , we get one positive steady state,
(23)
(23)
with eigenvalues
implying the local stability of E. By choosing initial conditions S1(0)=20 g L−1 and zero for the others and final time observation 100 hours, we get numerical solutions of system (7) depicted in .
Figure 2. Comparison of the transient behaviour of metabolites in the central metabolism of yeast cells with and without inhibition effects.
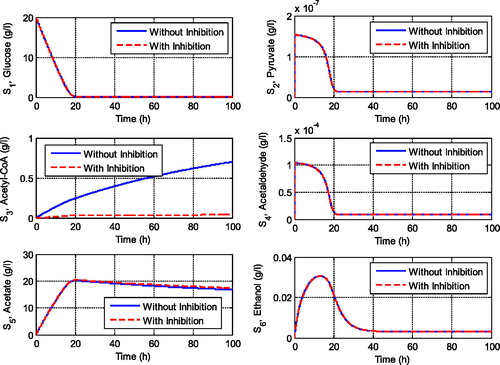
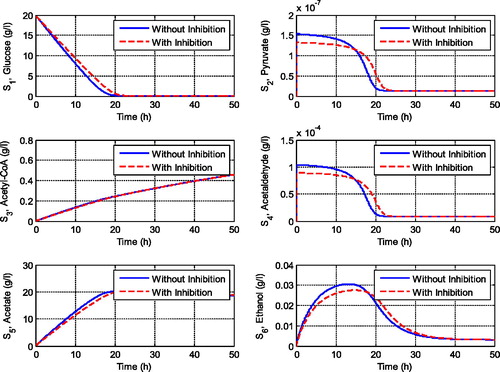
shows the transient behaviour of metabolites when the system experiences inhibitions by glucose and acetaldehyde. We can observe that inhibitions of some reactions highly affect the concentration of acetyl-CoA, which will lead to the respiration pathway of the yeast cell. The feedback inhibitions extremely decrease the concentration of acetyl-CoA. However, the feedback inhibition by acetaldehyde to the glycolysis pathway did not influence the production of pyruvate since there is no gap between the solution with and without inhibition term. This result implies that the inhibition by glucose to the third and the sixth reactions should be taken into attention since it influences the respiratory pathway of the yeast cell. It decreases the concentration of acetyl-CoA significantly. On the other hand, if we set the glucose inhibition as going to zero and the inhibition by acetaldehyde as high enough then we get the simulation results as shown in . We can observe that these conditions influence not only the concentration of pyruvate but also the concentration of the other metabolites including the concentration of ethanol. The maximum concentration of ethanol decreases as the acetaldehyde inhibition increases. However, when the acetaldehyde inhibition is high enough, it did not influence the concentration of acetyl-CoA as the main substrate for cell respiration (see ). It means that the feedback inhibitions by glucose significantly affect the respiratory pathway of the yeast cell, whereas acetaldehyde inhibition significantly affects the fermentation pathway. This is an interesting result since the two pathways, respiration and fermentation pathways, are important pathways for yeast cells that must be maintained.
Figure 3. Transient behaviour of metabolites when the glucose inhibition is over and the inhibition by acetaldehyde is very high.
Sensitivity analysis using metabolic control analysis
In this section we analyse the sensitivity of reactions involved in the fermentation pathway. Metabolic control analysis is a quantitative tool that quantifies the effect of perturbation in a metabolic network. It also quantifies the importance of each enzyme in controlling the flux of ethanol. In the metabolic control analysis, the sensitivity of reactions is measured via the following coefficients, namely elasticity coefficient and control coefficient for flux and metabolite. The elasticity coefficient quantifies the effect of small perturbation of a reaction parameter on the local reaction, whereas the control coefficient quantifies global effects of the perturbation of enzyme activity to the flux or metabolite concentration. To derive the sensitivity analysis of our system, now consider the nonlinear kinetic model in Equation (7). In a simple form, the kinetic model (7) can be rewritten in the following form:
(24)
(24)
where
is a vector of kinetic parameter of model (7), and N is a
-dimensional matrix of stoichiometric coefficients (the stoichiometric matrix) of system (7),
(25)
(25)
Reactions are given in EquationEquations (1)–(6), whereas reactions
respectively, represent the feeding rate of glucose and the outflows of the metabolite products, i.e.
If we extend the stoichiometric matrix N using an
-dimensional identity matrix then we get the augmented matrix
where each column of the identity matrix I represents a time derivative of system (24), i.e.
(26)
(26)
The row echelon form of the augmented matrix is given as the following form:
Table
It can be identified that there are no zero rows in its row echelon form meaning that no reduction is necessary for metabolites of system (24) since there is no dependence of the differential equations. Now let us investigate the flux of system (24). The flux of system (24) is defined as the steady-state reaction rate that can be reached when Therefore, finding the flux of the system (24) equals with finding the kernel of the Stoichiometric matrix N. Let
denote the flux of reaction
Since the rank of the matrix N is 6, there exist four independent fluxes that can be chosen freely. Choosing
as the independent fluxes (the r4,…,r7-columns without pivots in the echelon form of the stoichiometric matrix N), we then have
(27)
(27)
with the flux vector
the independent flux vector
and the kernel of matrix N,
(28)
(28)
The matrix K shows the dependence of the steady state fluxes on the independent fluxes. In a normal form we have
(29)
(29)
where
and
stand for the diagonal matrix of flux vector J and independent flux
respectively.
In metabolic control theory, there exist two theorems that can be applied to find the matrix control for flux and metabolite of the system (for detail about the two theorems see [Citation23]). The normalised form of both theorems is written as
(30)
(30)
where
and
respectively, represent the normalised matrix control for flux and metabolite,
is the normalised form of the kernel of N given in EquationEquation (29)
(29)
(29) , I is an identity matrix, and
is a matrix whose entries are elasticity coefficients,
By differentiating reaction rate
with respect to the metabolite variable
we get the elasticity matrix as follows:
(31)
(31)
Therefore, by substituting matrix in (29) and matrix
in (31) into EquationEquation (30)
(30)
(30) , we can derive the matrix control for flux,
and the matrix control for metabolites,
Using the kinetic parameters in , the stable positive steady state E, and EquationEquations (29)–(31), we get the values of the sensitivity of ethanol flux ( in term of flux control coefficient (
) which are depicted in . Here, we only present the sensitivity of ethanol flux (
) with respect to the reaction rate changes,
because our analysis is focused on the effects of the existence of feedback inhibition in some reactions to the ethanol production.
Figure 4. Distribution of flux control coefficients for quantifying the sensitivity of ethanol flux with respect to the reaction rate changes.
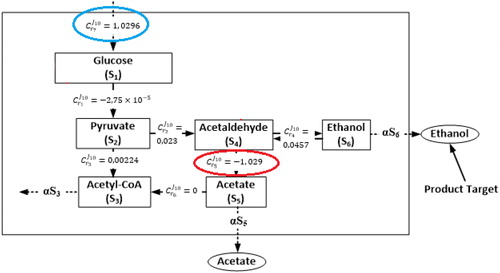
From the metabolic control analysis results, we can observe that each reaction has a different effect to the ethanol flux. Some reactions have almost zero effect to the ethanol flux including reactions that experience feedback inhibitions, whereas other reactions have positive effect and negative effect. The highest positive control is given by the glucose supply with control value whereas the highest negative control is given by reaction r5 catalysed by acetaldehyde dehydrogenase. These results are in agreement with our previous analysis results [Citation9]. It means that, if we increase the supply of glucose, then it will affect the increasing of ethanol production. However, the increasing of glucose supply should be under control since high glucose concentration significantly affects the respiratory pathway of the yeast cell. Otherwise, if we decrease reaction r5 catalysed by acetaldehyde dehydrogenase then it also will increase the production of ethanol.
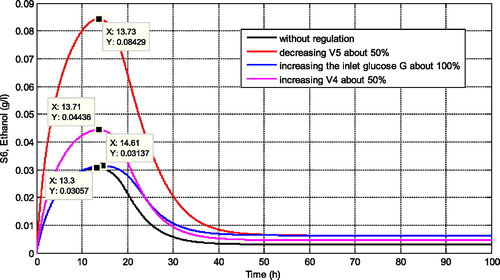
Some simulations are presented to confirm this metabolic control analysis results. For instance, in , we present the comparison of several regulations according to the sensitivity results. We can observe that when the glucose supply is increased about 100% (reaction with positive effect), it also increases the maximum concentration of ethanol for its steady state concentration. However, the increasing of ethanol concentration is not really significant. In comparison with the increasing of the maximum reaction rate of r4 by about 50% (reaction with positive effect), this regulation increases the concentration of ethanol higher than the previous regulation. Moreover, when the regulation is focused on the reaction r5 by decreasing its maximal reaction rate (reaction with negative effect), then this regulation significantly affects the increasing of ethanol concentration compared with the previous two regulations. The maximal concentration of ethanol increases dramatically, i.e. almost more than 100%.
Figure 5. Comparison of ethanol concentration for different regulation rules based on the metabolic control analysis results.
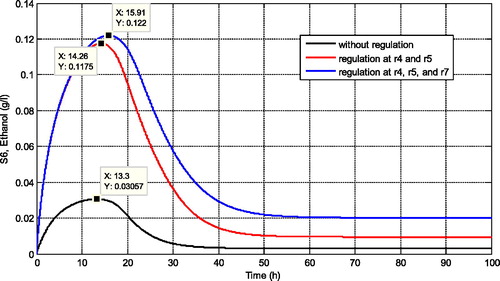
If we combine several regulation rules to increase the production of ethanol, we get the simulation results depicted in . When the maximal reaction rates of r4 and r5 are simultaneously regulated we find that the maximal concentration of ethanol increases twice from the previous regulation (regulating only r4). When the maximal reaction rates of r4, r5 and glucose supply are simultaneously regulated we find that the maximum concentration of ethanol increases slightly compared with regulation of r4 and r5. Since high glucose concentration will affect the inhibition at r3 and r6 then the best regulation choice is by regulating r4 and r5 simultaneously.
Figure 6. Comparison of ethanol concentration for different combination of regulation rules based on the metabolic control analysis results.
Conclusions
The kinetic model of the main metabolism of fermentation system was modelled by taking into consideration feedback inhibition effects of glucose and acetaldehyde to some reactions. The inhibition mechanisms occurred competitively and noncompetitively. The model produced at least one stable steady state and at most two stable steady states, if it fulfilled certain conditions. Numerical observations showed that high inhibition by glucose influenced the concentration of acetyl-CoA that will lead to the respiration pathway of the yeast cell, whereas high inhibition of acetaldehyde affected the concentration of all metabolites including the maximal concentration of ethanol. By applying metabolic control analysis to the metabolic system we found that there is one regulation rule that can be applied to increase the production of ethanol. Based on our numerical observations we found that the best regulation rule was by regulating the two key reactions that were catalysed by alcohol dehydrogenase and acetaldehyde dehydrogenase. By regulating the maximal activity of the two enzymes simultaneously, the maximal concentration of ethanol can be increased significantly.
Additional information
Funding
Related Research Data
References
- Wittmann C, Lee SY. Systems metabolic engineering. Heidelberg (DE): Springer; 2012; ISBN 978-94-007-4533-9.
- Na D, Kim TY, Lee SY. Construction and optimization of synthetic pathways in metabolic engineering. Curr Opin Microbiol. 2010;13:363–370.
- Kondo A, Ishii J, Hara KY, et al. Development of microbial cell factories for bio-refinery through synthetic bioengineering. J Biotechnol. 2013;163:204–216.
- Hollinshead W, He L, Yinjie T. Biofuel production: an odyssey from metabolic engineering to fermentation scale-up. Front Microbiol. 2014;5:344
- Klipp E, Herwig R, Kowald A, et al. Systems biology in practice: concepts, implementation and application. Weinheim (Germany): Wiley; 2005.
- Vasilakou E, Machado D, Theorell A, et al. Current state and challenges for dynamic metabolic modeling. Curr Opin Microbiol. 2016;33:97–104.
- Lei F, Rotboll M, Jorgensen SB. A biochemically structured model for Saccharomyces cerevisiae. J Biotech. 2001;88:205–221.
- Fischer HP. Mathematical modeling of complex biological systems: from parts lists to understanding systems behaviour. Alcohol Res Health. 2008;31:49–59.
- Kasbawati Gunawan AY, Hertadi R, et al. Metabolic regulation and maximal reaction optimization in the central metabolism of a yeast cell. AIP Conf Proc. 2015;1651: 75–85.
- Schuster S, Boley D, Möller P, et al. Mathematical models for explaining the Warburg effect: a review focussed on ATP and biomass production. Biochem. Soc Trans. 2015;43:1187–1194.
- Almquist J, Cvijovic M, Hatzimanikatis V, et al. Kinetic models in industrial biotechnology-improving cell factory performance. Meta Engineer. 2014;24:38–60.
- Kasbawati Gunawan AY, SidartoKA, et al. A new strategy of glucose supply in a microbial fermentation model. AIP Conf Proc. 2015;[September, 30]1677:030015. [12 p.]. DOI: https://doi.org/10.1063/1.4930637
- Kasbawati Gunawan AY, Sidarto KA. Washout and non-washout solutions of a system describing microbial fermentation process under the influence of growth inhibitions and maximal concentration of yeast cells. Math Biosci. 2017;289:40–50.
- Klamt S, Müller S, Regensburger G, et al. A mathematical framework for yield (vs. rate) optimization in constraint-based modeling and applications in metabolic engineering. Meta Engineer. 2018;47:153–169.
- Purves William K, Sadava, et al. Life, the science of biology. 7th ed. Sunderland (MA): Sinauer Associates and W. H. Freeman; 2003; p. 139–140.
- Stryer L. Biochemistry. San Francisco (CA): W. H. Freeman and Company; 1975.
- Kasbawati Gunawan AY, Hertadi R, et al. Effects of time delay on the dynamics of a kinetic model of a microbial fermentation process. Anziam J. 2014;55:336–356.
- Pronk JT, Yde Steensma H, VAN Dijken JP. Pyruvate metabolism in Saccharomyces cerevisiae. Yeast. 1996;12:1607–1633.
- Alexander MA, Jeffries TW. Respiratory efficiency and metabolite partitioning as regulatory phenomena in yeast. Enzyme Microb Technol. 1990;12:2–19.
- Sonnleitner B, Käppeli O. Growth of Saccharomyces cerevisiae is controlled by its limited respiratory capacity: formulation and verification of a hypothesis. Biotechnol Bioeng.. 1986;28:927–937.
- van den Berg MA, Steensma H. ACS2, a Saccharomyces cerevisiae gene encoding acetyl-coenzyme A synthetase, essential for growth on glucose. Eur J Biochem. 1995;231:704–713.
- Murray JD. Mathematical biology. 2nd ed. New York: Springer; 1990.
- Hofmeyr JHS, Cornish-Bowden A. Co-response analysis: a new experimental strategy for metabolic control analysis. J Biol. 1996;182:371–380.