
Abstract
Among the wild relatives of wheat, Triticum urartu Tumanian ex Gandilyan is of interest to wheat breeders. Numerous works have focussed on its utilization for enrichment of the genetic variation of cultivated genotypes. In the present study, the genetic diversity and population structure in 85 accessions of T. urartu were investigated using start codon targeted (SCoT) polymorphism and CAAT-box derived polymorphism (CBDP) markers. Nineteen SCoT primers and fifteen CBDP primers amplified 185 and 141 polymorphic fragments with an average of 9.74 and 9.40 fragments per primer, respectively. The polymorphic information content (PIC) for the SCoT and CBDP primers ranged from 0.41 to 0.50 and 0.40 to 0.49, with the resolving power (Rp) ranging from 21.61 to 3.97 and 13.08 to 28.02, respectively. Neighbour-joining (NJ) based clustering grouped 72 accessions into two main clusters based on the two sets of markers and the combined data. Genetic relationships inferred from STRUCTURE analysis was matched with cluster analysis and principal coordinate analysis (PCoA), indicating that the accessions were grouped into two major clades and the grouping patterns were not correlated with the geographic origins. The results from this study revealed that Iranian T. urartu, especially Kerend-e-Gharb and Sisakht-Pataveh populations, can be interesting for wheat improvement. Hence, conservation of this region is recommended.
Introduction
Among members of Einkorn wheats, Triticum urartu with Au genome is a diploid and self-pollinated species (2n = 2X = 14), which is known as one of the main ancestral species of durum and bread wheat [Citation1]. The main geographical origins of T. urartu are in the eastern and central parts of the Fertile Crescent region, which are parts of Turkey, Iran, Armenia, Iraq, Azerbaijan, Syria and Lebanon [Citation2]. According to reports, the west areas of Iran are a main centre of distribution of Einkorn wheat with associated compositions of Aegilops species, as the richest wheat gene pool has been explored in different parts of this country [Citation3]. Hence, distribution of this germplasm in the different parts of Iran, suggest that this area is an ideal source of diversity for discovering useful genes to transfer into modern wheat. Several studies reported that T. urartu is an ideal source of genes related to seed quality, tolerance to both biotic [especially for leaf rust and powdery mildew diseases] and abiotic [especially for drought, salinity and cold] stresses tolerance [Citation4–12].
Genetic variability among plant germplasm offers scenarios for improving the plant characteristics. Molecular markers are known as one of the efficient tools for investigating genetic diversity and population structure. Over the past few decades, various molecular marker systems have been developed in a wide range of plant crops. Nowadays, gene-targeted marker systems have become an important and useful technique in the genetic diversity assays. Start codon-targeted (SCoT) polymorphism system is known as one of the novel molecular markers, based on the short conserved region of the translation initiation codon (ATG) [Citation13]. CATT box-derived polymorphism (CBDP) is another novel promoter-targeted marker, which uses the nucleotide sequence of CAAT box of plant promoters. The CAAT box region has a specific pattern of nucleotides with a consensus sequence and is located upstream of the start codon of eukaryotic genes [Citation14]. Due to several advantages such as repeatability, low cost and high polymorphism, these techniques have been successfully applied in genetic diversity studies of many plant species [Citation14–20].
Genetic diversity in the wheat germplasm opens up new scenarios to the discovery of useful genes or alleles and improvement of varieties with desirable traits, which include both farmer- and breed-preferred traits such as yield potential, large seed, high seed weight and tolerance to both biotic and abiotic stresses [Citation21]. Previously, the genetic diversity and population structure of T. uraru populations have been studied using a large number of marker systems, including morphological characters [Citation22], isozymes [Citation23] and molecular markers [Citation20,Citation24,Citation25].
Of these, molecular characterization has been demonstrated to be an efficient technique to study genetic diversity, and it has successfully been used to dissect the genetic architecture and population structure in many plants [Citation26–29]. However, there are no reports on the genetic diversity and population structure of T. urartu population using SCoT and CBDP markers. The main goals of this study were to investigate the genetic population diversity and analyze the population structure in 85 accessions of T. urartu collected from different regions of Iran using these gene-targeted markers.
Materials and methods
Plant materials
A total of 85 accessions of T. urartu were collected from seven natural habitats located in west and southwestern regions of Iran ().
Table 1. Geographical characteristics of sampling locations of Iranian T. urartu accessions in this study.
DNA extraction
Total genomic DNA was extracted from young leaves of glasshouse-grown seedlings according to the CTAB protocol [Citation30]. DNA quality was assayed using 0.8% agarose gel electrophoresis.
DNA fingerprinting using SCoT markers
Nineteen SCoT primers used in this study were designed according to Collard and Mackill [Citation13]. All 19 primers amplified scorable polymorphic bands and were selected for further analysis (). All polymerase chain reaction (PCR) amplifications were done in a 30-μL reaction mixture containing 15 μL of master mix 2XPCR (ready-to-use PCR master mix 2X; Ampliqon), 9.5 μL double distilled water, 4 μL of the template DNA and 1.5 μL of each primer. The PCR amplifications (BioRad, T-100) were done under the following conditions: initial denaturation at 95 °C for 10 min, followed by 38 cycles of denaturation at 95 °C for 1 min, annealing at 53.7–62.8 °C (varied for each primer) for 50 s, extension at 72 °C for 2 min and a final extension at 72 °C for 7 min. The PCR products were visualized in a 1.5% agarose gel, stained with SafeView II and finally photographed using a gel documentation system.
Table 2. Start Codon Targeted (SCoT) and CAAT-box derived polymorphism (CBDP) primers and their amplification results generated in the 85 T. urartu accessions.
DNA fingerprinting using CBDP markers
For CBDP analysis, 15 primers were designed according to Singh et al. [Citation14] (). All PCR amplifications were carried out in 20-μL reaction mixture containing 6 μL double distilled water, 2 μL of the template DNA, 2 μL of each primer and 10 μL of master mix 2XPCR (ready-to-use PCR master mix 2X; Ampliqon). CBDP-PCR amplification was done under the following conditions: initial denaturation at 94 °C for 4 min, followed by 30 cycles of denaturation at 94 °C for 1 min, annealing at 33.6–73 °C (varied for each primer) for 1 min and extension at 72 °C for 2 min. The final extension was 7 min at 72 °C. PCR products were visualized in a 1.5% agarose gel, stained with SafeView II and finally photographed using a gel documentation system.
Data analysis
The amplified SCoT and CBDP fragments were scored as 0 and 1 for absence and presence of the bands, respectively. Five informative indices including total amplified bands (NPB), percentage of polymorphism bands (PPB), polymorphism information content (PIC), resolving power (Rp), and the marker index (MI) were used as the discriminatory powers for screening the primers. To partition the genetic diversity, analysis of molecular variance (AMOVA) was performed using GenAlEx ver. 6.5 software [Citation31]. Several genetic diversity indices such as the percentage of polymorphic loci (PPL), the observed (Na) and effective (Ne) numbers of alleles, Shannon’s information index (I) and Nei’s gene diversity (H) were estimated. Genetic dissimilarities were estimated based on Jaccard’s coefficients [Citation32], and a Fan-dendrogram was rendered by the Neighbour-joining (NJ) method using MEGA ver. 5.1 software [Citation33]. Structure analysis was done using STRUCTURE software version 2.3.4 [Citation34] to show the Bayesian clustering patterns for the 85 studied accessions. This analysis was performed with a burning time period of 5000 and a Markov Chain Monte Carlo (MCMC) replication number set up to 50000. The analysis was run 7 times for each ‘K’, ranging from 1 to 10. Finally, STRUCTURE HARVESTER, a program available online, was used to calculate the ΔK [Citation35].
Results and discussion
Polymorphism revealed by SCoT and CBDP markers
Nineteen primers generated a total of 185 scorable bands, of which all were polymorphic (). The total amplified bands (TAB) ranged from 7 (SCoT-11 and SCoT-13) to 13 (SCoT-7 and SCoT-14) with an average of 9.74 per primer. The polymorphism information content (PIC) ranged from 0.41 to 0.50, and out of 19 primers, 4 primers (SCoT-12, SCoT-14 and SCoT-17) had the highest values. The resolving power (Rp) parameter varied between 6.72 (SCoT-12 and SCoT-13) and 12.89 (SCoT-14) with a mean of 9.73 per primer. The marker index (MI) parameter showed a wide range of variability among the tested primers and the highest and lowest values were observed for SCoT-11 (3.47) and SCoT-14 (6.49), respectively. The average of MI across all primers was 4.8.
In the CBDP analysis, 15 primers generated 141 loci, all of which were polymorphic fragments. The number of polymorphic fragments ranged from a minimum of 8 in primer CBDP-15 to a maximum of 12 in CBDP-7. The PIC parameter ranged from 0.40 to 0.49 with a mean of 0.45 per primer. The primers CBDP-2, CBDP-7 and CBDP-10 showed the highest value for PIC. The average of Rp of 15 CBDP primers was 10.66, and the highest value was observed in primers CBDP-6 and CBDP-7 (13.64). The MI parameter ranged from 3.94 (CBDP-15) to 5.31 (CBDP-12) with an average of 4.51.
Our results indicated that SCoT markers showed higher TAB, NPB, PIC and MI than CBDP markers. Hence, the higher values of these indices detected by the tested markers indicate a reasonable significance level of genetic diversity in the Iranian T. urartu germplasm. Three informative parameters, PIC, Rp and MI, provide a benchmark that can help to determine the potential of markers in genetic analyses. In the present study, the average of MI and PIC values for SCoT markers was greater than CBDP, suggesting the good capacity of the SCoT system to present polymorphic level in investigated T. urartu accessions. In contrast, the average Rp value of the CBDP markers was more than that of the SCoT markers, which indicated the high ability of the CBDP markers to reflect the genetic diversity in T. urartu. These results are in agreement with Heikrujam et al. [Citation36], Tiwari et al. [Citation9], Etminan et al. [Citation16,Citation17,Citation37] and Qaderi et al. [Citation19], who reported that SCoT and CBDP markers were more useful for dissecting genetic diversity and structure than other molecular marker techniques.
Population genetic variation
The genetic diversity parameters calculated for each population are summarized in . Based on SCoT data, the highest number of observed alleles (Na) was estimated among Keren-e-Gharb (1.91) and Bisetoon (1.91). Two populations, Kerend-e-Gharb and Songhor, showed the highest number of effective alleles (Ne = 1.65 and 1.59), Shannon information (I = 0.53 and 0.51), Nei’s gene diversity (H = 0.36 and 0.34) and the percentage of polymorphic loci (PPL = 93.51 and 92.43%). According to the CBDP results, the Kerend-e-Gharb and Sisakht-Pataveh populations had the highest values of Na (1.88 and 1.86), Ne (1.65 and 1.66), I (0.53 and 0.53) and H (0.36 and 0.37). These populations also showed high values for PPL (92.91 and 90.07%). Furthermore, in the pooled data (SCoT + CBDP) analysis, two populations, Kerend-e-Gharb and Sisakht-Patave, showed the highest values for I (0.53 and 0.52), H (0.36 and 0.35) and Ne (1.63 and 1.62).
Table 3. Estimated genetic diversity parameters for different Iranian T. urartu populations using SCoT and CBDP markers.
As a considerable result, out of seven populations, the highest values of the genetic diversity indices (Ne, I, He and PPL) were observed for Kerend-e-Gharb, Songhor and Sisakht-Pataveh populations using each marker system. We selected Kerend-e-Gharb as a divergent population based on the pooled data. The higher genetic diversity in this population might be attributed to the frequency of allelic variation of this population being affected by different climatic conditions [Citation38]. Moreover, this result reveals that this region may be a good source of variability to explore the new alleles and candidate genes for future breeding programmes. Our findings are in accordance with those of a previous research in which higher diversity was observed for T. urartu populations than other wild wheat species [Citation20]. The highest values of genetic variation parameters were reported for T. urartu and other wild diploid wheats sampled from west regions of Iran, especially Kermanshah province [Citation27]. The west region of Iran, especially Kermanshah, Lorestan and Kurdistan, are located in a part of the Fertile Crescent and it is generally accepted that the genetic diversity among wheat germplasm there is higher than in other parts of Iran. Hence, according to these results, we believe that the Kerend-e-Gharb region can be an ideal source for the discovery of new gene resources. In agreement with our findings, Mousavifard et al. [Citation25] using an ISSR marker system revealed a high level of genetic diversity among Iranian wild diploid wheat species. Naghavi et al. [Citation39] using three different marker systems such as RAPD, AFLP and SSR also indicated high diversity among the Einkorn wheat germplasm.
Population genetic diversity
Analysis of molecular variance (AMOVA) was performed to dissect the genetic variation in T. urartu populations (). The results of AMOVA showed that the percentage molecular variance was higher within populations (SCoT = 97%, CBDP = 94%, pooled data = 95%) than among populations (SCoT = 3%, CBDP = 6%, pooled data = 5%), which suggests frequent exchange of gene pool among these different geographical regions [Citation9].
Table 4. Analysis of molecular variance (AMOVA) in T. urartu populations.
This result was confirmed by inter-population differentiation (GST) and gene flow (Nm) parameters. The genetic differentiation coefficient (GST)/gene flow (Nm) for SCoT, CBDP and pooled data were 0.07/6.20, 0.11/4.16 and 0.23/5.44, respectively. Wright [Citation40] demonstrated that if Nm > 1, the gene flow can inhibit the differentiation among populations due to genetic drift. As a result, high values of Nm were found when we used SCoT, CBDP and pooled data (6.20, 4.16 and 5.44, respectively). Indeed, this result can be explained by the size of the populations and the degree of distributions between different regions [Citation41]. Similar results have been reported previously for genetic diversity in T. urartu germplasm using SSR markers [Citation42], IRAP and REMAP markers [Citation43] and ISSR [Citation25], which can support our findings.
Genetic distance and grouping relationship
According to SCoT analysis, the pairwise genetic distance coefficients estimated using Jaccard’s coefficient showed a range of 0.17–0.77 with an average value of 0.56 among all the 85 accessions of T. urartu. The maximum genetic distance was found between two accessions from Kerend-e-Gharb (accession No. 23) and Songhor (accession No. 69) populations, whereas the minimum distance was observed between two accessions of Sisakht-Pataveh (accession No. 36) and Farokhshahr (accession No. 49) populations (data not shown). Besides, the genetic distance coefficients by CBDP data varied between 0.17 and 0.88 with a mean value of 0.48. The maximum distance was shown between two accessions from Bashmagh (accession No. 9) and Songhor (accession No. 63), whereas the minimum distance was shown between accessions No.49 and No.36 from the Farokhshahr and Sisakht-Pataveh populations. The pairwise genetic distance coefficient computed using the pooled data showed a range of 0.23–0.77 with a mean value of 0.41 among all the 85 studied accessions. The minimum distance was observed between accessions No. 49 (from Farokhsahr population) and No. 50 (from Bisetoon population), whereas the maximum distance was found between accessions No. 8 and No. 59 form Bashmagh and Bisetoon populations, respectively (data not shown).
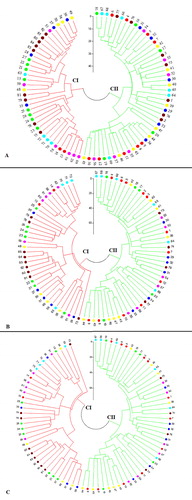
To investigate the relationships among the studied accessions, cluster analysis was carried out using the NJ method and based on dissimilarity coefficients matrix. The Fan-dendrogram constructed using SCoT, CBDP and the pooled data (SCoT + CBDP) grouped all accessions into two main clusters (). Based on SCoT data, the first cluster (CI) consisted of 2, 8, 4, 4, 6, 4 and 9 accessions from Bashmagh, Kerend-e-Gharb, Sisakht-Pataveh, Farokhshar, Bisetoon, Songhor and Marivan populations, respectively. Other accessions related to each population were grouped together in the second cluster (CII) (. In CBDP analysis, cluster I mainly consisted of accessions from Marivan and Bisetton along with some accessions from Songhor (4 accessions), Bashmagh (2 accessions), Sisakht-Pataveh (4 accessions), Farokhshar (4 accessions) and Kerend-e-Gharb (6 accessions) populations. More than half of the accessions from Songhor, Bashmagh, Kerend-e-Gharb, Sisakht-Pataveh and Farokhshar populations grouped in the second cluster (CII) (. A Fan-dendrogram rendered based on the pooled data showed a high level of genetic diversity among the studied populations and that each of cluster included several accessions of each population (.
Figure 1. Fan-dendrogram generated using neighbour-joining clustering based on SCoT (A), CBDP (B) and SCoT + CBDP (C) data. See for codes of genotypes.
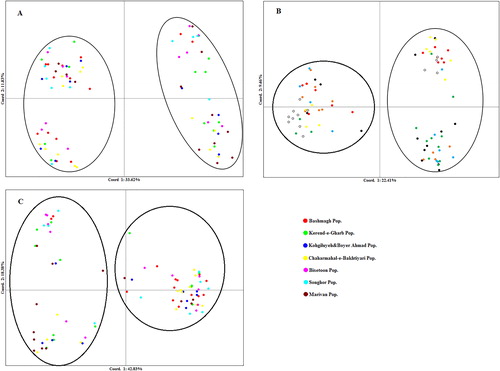
Moreover, principal coordinate analysis (PCoA) was done based on SCoT, CBDP and pooled data. According to SCoT, CBDP and the pooled data, the first two axes accounted for 63.03, 31.87 and 61.21% of the total molecular variation respectively. Based on PCoA biplots, all accessions were classified into two distinct groups (GI and GII), so that grouping of genotypes was not in accordance with their origins (). Indeed, these findings were confirmed by the results of cluster analysis ().
Figure 2. Biplot derived from the PCoA of the 85 Iranian T. urartu accessions based on SCoT (A), CBDP (B) and SCoT + CBDP (C) data.
Our results showed that the clustering patterns did not agree with the geographical distribution, revealing a high rate of gene flow among populations from different regions. Previously, many studies demonstrated a good efficiency of SCoT and CBDP markers for classification of different populations. For instance, in some studies, the phylogenetic relationships among different wild wheat species were studied and the results showed that this marker system had a high ability in discrimination of species based on their genomic structure [Citation20,Citation44]. Similarly, Etminan et al. [Citation18] reported that the CBDP markers are more efficient in differentiation of various species of Aegilop and Triticum genera. Although several studies have shown that SCoT and CBDP markers have a high efficiency in grouping individuals or species with different genetic background, our results revealed a low efficiency of these systems in grouping the individuals based on their geographical origins.
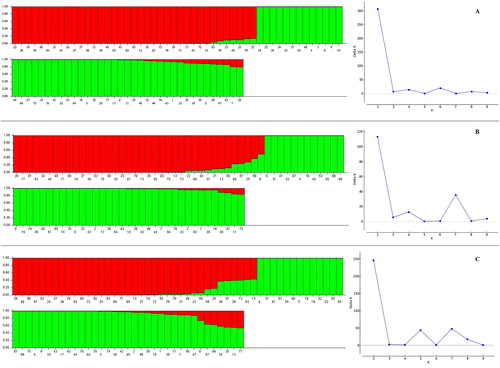
Population structure refers to all genetic patterns of individuals within a population. In fact, the genetic structure in a natural population is characterized by the number of possible subpopulations within it, the frequencies of different alleles in each subpopulation, and the degree of genetic isolation of the subpopulations [Citation45]. The population structure of the 85 T. urartu accessions was analyzed based on generated polymorphism data of each marker system and pooled data using STRUCTURE analysis for K = 1 to K = 10. In all the analyses, the results obtained by STRUCURE HARVESTER indicated that maximum ΔK was reached at K = 2 (). At this K, all accessions were assigned to two main subpopulations. The inferred population structure for K = 2 indicated that most of the accessions had a membership coefficient (qi) to one of the subpopulations equal or higher than 0.50 (qi ≥ 0.50). These results further confirmed the PCoA and cluster analysis.
Figure 3. Population structure of 85 accessions of T. urartu based on SCoT (A), CBDP (B) and SCoT + CBDP (C) primers inferred by STRUCTURE analysis. See for codes of genotypes.
Conclusions
Our results revealed a high level of genetic diversity in the Iranian T. urartu populations. This was further supported by various statistical analyses such as AMOVA, Bayesian clustering pattern, PCoA and cluster analyzes that showed a high difference within populations. Hence this study can suggest that exploring this highly diverse gene pool may result in identification of useful genes for researchers for wheat adaptation and improvement. Furthermore, the present study revealed that the SCoT and CBDP systems were powerful tools for assessment of the genetic diversity in wheat wild relatives. Hence, we offer that these DNA-based systems could be used in combination with other molecular markers for genetic analyses such as, association mapping studies and construction of linkage maps.
Disclosure statement
The authors declare there is no conflict of interest for their study.
References
- Kilian B, Ozkan H, Deusch O, et al. Independent wheat B and G genome origins in outcrossing Aegilops progenitor haplotypes. Mol Biol Evol. 2007;24(1):217–227.
- Valkoun J, Waines JG, Konopka J. The origins of agriculture and crop domestication. In: Damania AB, Valkoun J, Willcox G, Qualset CO, editors. Proceedings of the Harlan symposium. Aleppo, Syria: ICARDA,1997.
- Tabatabaei SF, Maassoumi TR. Triticum boeoticum ssp. thaoudar “exists” in Iran. Cereal Res Commun. 2001;29:121–126.
- Megyeri M, Mikó P, Molnár I, et al. Development of synthetic amphiploids based on Triticum turgidum × T. monococcum crosses to improve the adaptability of cereal. Acta Agron Hungarica. 2011;59(3):267–274.
- Chunyan W, Maosong L, Jiqing S, et al. Differences in stomatal and photosynthetic characteristics of five diploid wheat species. Acta Ecol Sin. 2008;28(7):3277–3283.
- Yesayan AH, Grigorin KV, Danielian AM, et al. Determination of salt tolerance in wild wheat (Triticum boeoticum Boiss.) under in vitro conditions. CWR. 2009;7:4–6.
- Ahmadi J, Pour-Aboughadareh A. Allelic variation of glutenin and gliadin genes in Iranian einkorn wheat. J Biodiversity Environ Sci. 2015;7:168–179.
- Ahamdi J, Pour-Aboughadareh A, Fabriki-Ourang S, et al. Molecular detection of glutenin and gliadin genes in the domesticated and wild relatives of wheat using allele-specific markers. Cereal Res Commun. 2018;46:510–520.
- Tiwari G, Singh R, Singh N, et al. Study of arbitrarily amplified (RAPD and ISSR) and gene targeted (SCoT and CBDP) markers for genetic diversity and population structure in Kalmegh [Andrographis paniculata (Burm.f.) Nees]. Ind Crops Prod. 2016;86:1–11.
- Pour-Aboughadareh A, Ahmadi J, Mehrabi AA, et al. Physiological responses to desiccation stress in wild relatives of wheat: implications for wheat improvement. Acta Physiol Plant. 2017;39(4):106. [cited 2019 Sep 11].
- Ahmadi J, Pour-Aboughadareh A, Fabriki-Ourang S, et al. Screening wild progenitors of wheat for salinity stress at early stages of plant growth: insight into potential sources of variability for salinity adaptation in wheat. Crop Pasture Sci. 2018;69(7):649–658.
- Ahmadi J, Pour-Aboughadareh A, Ourang SF, et al. Wild relatives of wheat: Aegilops–Triticum accessions disclose differential antioxidative and physiological responses to water stress. Acta Physiol Plant. 2018;40(5):90. [cited 2019 Sep 11].
- Collard BC, Mackill DJ. Start codon targeted (SCoT) polymorphism: a simple, novel DNA marker technique for generating gene-targeted markers in plants. Plant Mol Biol Rep. 2009;363:557–572.
- Singh AK, Rana MK, Singh S, et al. CAAT box-derived polymorphism (CBDP): a novel promoter-targeted molecular marker for plants. J Plant Biochem Biotechnol. 2014;23(2):175–183.
- Feng S, He R, Yang S, et al. Start codon targeted (SCoT) and target region amplification polymorphism (TRAP) for evaluating the genetic relationship of Dendrobium species. Gene. 2015;567(2):182–188.
- Etminan A, Pour-Aboughadareh A, Mohammadi R, et al. Applicability of start codon targeted (SCoT) and inter-simple sequence repeat (ISSR) markers for genetic diversity analysis in durum wheat genotypes. Biotechnol Biotechnol Equip. 2016;30(6):1075–1081.
- Etminan A, Pour-Aboughadareh A, Noori A, et al. Genetic relationships and diversity among wild Salvia accessions revealed by ISSR and SCoT markers. Biotechnol Biotechnol Equip. 2018;32(3):610–617.
- Etminan A, Pour-Aboughadareh A, Mehrabi AA, et al. Molecular characterization of the wild relatives of wheat using CAAT-box derived polymorphism. Plant Biosyst. 2019;153(3):398–405.
- Qaderi A, Omidi M, Pour-Aboghadareh A, et al. Molecular diversity and phytochemical variability in the Iranian poppy (Papaver bracteatum Lindl.): a baseline for conservation and utilization in future breeding programmes. Ind Crops Prod. 2019;130:237–247.
- Pour-Aboughadareh A, Ahmadi J, Mehrabi AA, et al. Insight into the genetic variability analysis and relationships among some Aegilops and Triticum species, as genome progenitors of bread wheat, using SCoT markers. Plant Biosyst. 2018;152(4):694–703.
- Moradkhani H, Mehrabi AA, Etminan A, et al. Molecular diversity and phylogeny of Triticum–Aegilops species possessing D genome revealed by SSR and ISSR markers. Plant Breed Seed Sci. 2015;71:82–95.
- Salimi A, Ebrahimzadeh H, Taeb M. Description of Iranian diploid wheat resources. Genet Resour Crop Evol. 2005;52(4):351–361.
- Moghaddam M, Ehdaie B, Waines JG. Genetic diversity in population of wild diploid wheat Triticum urartu Tum.ex. Gandil. revealed by isozyme markers. Genet Resour Crop Evol. 2000;47(3):323–334.
- Nasernakhaei F, Rahiminejad MR, Saeidi H, et al. Taxonomic identity of the Iranian diploid Triticum as evidenced by nrDNA ITS analysis. Phytotaxa. 2013;143(1):43–53.
- Mousavifard SS, Saeidi H, Rahiminejad MR, et al. Molecular analysis of diversity of diploid Triticum species in Iran using ISSR markers. Genet Resour Crop Evol. 2015;62(3):387–394.
- Ghahremani-Majd H, Dashti F. Genetic diversity of Persian shallot (Allium hirtifolium Boiss.) populations based on morphological traits and RAPD markers. Plant Syst Evol. 2014;300(5):1021–1030.
- Pour-Aboughadareh A, Mohmoudi M, Ahmadi J, et al. Agro-morphological and molecular variability in Triticum boeoticum accessions from Zagros Mountains, Iran. Genet Resour Crop Evol. 2017;64(3):545–556.
- Zamanianfard Z, Etminan A, Mohammadi R, et al. Evaluation of molecular diversity of durum wheat genotypes using ISSR markers. Biol Forum. 2015;7:214–218.
- Moradkhani H, Pour-Aboughadareh A, Mehrabi AA, et al. Evaluation of genetic relationships of Triticum-Aegilops species possessing D genome in different ploidy levels using microsatellites. In J Agric Crop Sci. 2012;23:1746–1752.
- Doyle JJ, Doyle JK. A rapid DNA isolation procedure for small quantities of fresh leaf tissue. Phytochem Bull. 1987;19:11–15.
- Peakall R, Smouse PE. GENALEX 6: genetic analysis in Excel. Population genetic software for teaching and research. Mol Ecol Notes. 2006;6(1):288–295.
- Jaccard P. Nouvelles recherches sur la distribution florale. Bulletin de la Societe Vaudoise [New research on the floral distribution]. Sci Nat. 1908;44:223–270.
- Tamura K, Peterson D, Peterson N, et al. MEGA5: molecular evolutionary genetics analysis using maximum likelihood, evolutionary distance, and maximum parsimony methods. Mol Biol Evol. 2011;28(10):2731–2739.
- Pritchard JK, Stephens M, Donnelly P. Inference of population structure using multilocus genotype data. Genetics. 2000;155(2):945–959.
- Earl DA, vonHoldt BM. Structure Harvester: a website and program for visualizing STRUCTURE output and implementing the Evanno method. Conserv Genet Resour. 2012;4(2):359–361.
- Heikrujam M, Kumar J, Agrawal V. Genetic diversity analysis among male and female Jojoba genotypes employing gene targeted molecular markers, start codon targeted (SCoT) polymorphism and CAAT box-derived polymorphism (CBDP) markers. Meta Gene. 2015;5:90–97.
- Etminan A, Pour-Aboughadareh A, Mohammadi R, et al. Application of CAAT box-derived polymorphism (CBDP) markers for analysis of genetic diversity in durum wheat. Cereal Res Commun. 2018;46(1):1–9.
- Ni J-L, Zhu A-G, Wang X-F, et al. Genetic diversity and population structure of ramie (Boehmeria nivea L.). Ind Crops Prod. 2018;115:340–347.
- Naghavi MR, Maleki M, Aizadeh H, et al. An assessment of genetic diversity in wild diploid wheat Triticum boeoticum from west of Iran using RAPD, AFLP and SSR markers. J Agric Sci Technol. 2009;11:585–598.
- Wright S. The genetical structure of populations. Ann Eugen. 1949;15(1):323–354.
- Dumolin-Lapegue S, Demesure B, Fineschi S, et al. Phylogeographic structure of white oaks throughout the European continent. Genetics. 1997;146(4):1475–1487.
- Abbasov M. Genetic diversity in wild diploid wheat T. urartu revealed by SSR markers. Cereal Res Commun. 2018;46:1–11.
- Taheri MT, Alavi-Kia SS, Mohammadi SA, et al. Assessment of genetic diversity and relationships among Triticum urartu and Triticum boeoticum populations from Iran using IRAP and REMAP markers. Genet Resour Crop Evol. 2018;65(7):1867–1878.
- Pour-Aboughadareh A, Ahmadi J, Mehrabi AA, et al. Assessment of genetic diversity among Iranian Triticum germplasm using agro-morphological traits and start codon targeted (SCoT) markers. Cereal Res Commun. 2017;45(4):574–586.
- Chakraborty R. Human population genetics. Boston: Springer Press; 1993.