
 ?Mathematical formulae have been encoded as MathML and are displayed in this HTML version using MathJax in order to improve their display. Uncheck the box to turn MathJax off. This feature requires Javascript. Click on a formula to zoom.
Abstract
Large quantities of phthalic acid esters (PAEs) are released and migrate into the environment continuously and become ubiquitous in soil, surface water, groundwater and other areas, eventually leading to serious environmental pollution. Therefore, the methods of PAEs mineralization have become a hot research topic. In this study, a highly efficient dimethyl phthalate (DMP)-degrading bacterium capable of utilizing DMP as the sole source of carbon and energy was isolated from frozen soil collected from a refuse disposal station. The DMP-degrading bacterium was identified as Pseudomonas sp. QDF12 according to the phylogeny of 16S rDNA sequence. The degradation process well fitted a first-order kinetic model, with a half-life of 9.8 h and the highest degradation rate of 20.19 mg/L•h at 15.0 °C. The fermentation conditions that enhanced the fermentation of biomass were optimized via Plackett-Burman design and response surface methodology. Finally, the carbon-nitrogen ratio, CaCO3, temperature and shaking speed were identified as key factors. Verification experiments indicated that the maximal biomass was 1.85 × 10⁹ cfu/mL under the optimized conditions, which was 134.18% and 66.67% higher than those obtained under the Luria broth medium and the basic fermentation conditions, respectively. The time and temperature of fermentation were reduced to 12 h and 12.0 °C respectively. In conclusion, the strain QDF12 is more suitable for application in low-temperature areas owing to its fast, efficient fermentation and low-temperature resistance. Because of the shorter fermentation period and lower fermentation temperature, the large-scale commercial application of strain QDF12 will reduce the production costs and accelerate the fermentation speed.
Introduction
Phthalic acid esters (PAEs) are a class of refractory synthetic organic plasticizer compounds which are widely utilized as softeners and plasticizers in various polymeric products, including plastics, coatings, paints, daily chemical products and pesticides [Citation1]. Some PAEs are easily released in the process of using plastics because their interactions with plastic molecules are not a chemical bond [Citation2]. Therefore, these compounds become global environmental organic pollutants found in soil, water, the atmosphere and even the human body [Citation3]. PAEs can be divided into high-molecular-weight (HMW) and low-molecular-weight (LMW) PAEs, and the latter include dimethyl phthalate (DMP), diethyl phthalate (DEP), dibutyl phthalate (DBP), diisobutyl phthalate (DiBP) and diethylhexyl phthalate (DEHP). LMW PAEs are used predominantly as solvents in adhesives, waxes, inks, cosmetics, insecticides and pharmaceuticals [Citation4]. LMW PAEs entering the bodies through food chains act as anti-androgens in male mammals to significantly injure reproductive functions, such as damaging the reproductive system, causing testicular atrophy and sperm loss, and changing the ultrastructure of germ cells. Furthermore, they are moderately toxic to the embryonic development of female mammals [Citation5–7]. LMW PAEs are classified as environmental pollutants of priority by the U.S. Environmental Protection Agency (EPA), European Union and the China National Environmental Monitoring Center [Citation8].
In China, PAEs account for 90% of the plasticizers usage in polyvinyl chloride productions. The current consumption of PAEs in China is more than 2.2 million tons per year and is predicted to increase [Citation9]. High-load PAEs have been found in 2.3 billion acres of cultivated soil in China [Citation10]. The top three provinces with the highest concentrations of ∑15PAEs are Fujian, Guangdong and Xinjiang, and the concentration of DEHP particularly exceeds those of all other organic pollutants. The highest soil concentration of PAEs in some parts of Hubei Province of China is 157,620 ng/g, which is 24 times that of the safety standard of the U.S. EPA (6500 ng/g) [Citation11]. The soil concentrations of DMP, DBP and DEHP are all significantly different among provinces. The high LMW PAEs concentration seriously reduces the quality and yield of crops, indicating that LMW PAEs can seriously hinder the agricultural productions [Citation12]. Moreover, LMW PAEs can inhibit the growth and reduce the diversity and activity of soil microorganisms, and weaken soil resistance against soil-borne diseases. This could lead to a reduction in soil fertility, crop quality and yield and eventually to serious soil degradation [Citation13].
In order to reduce the high residues of LMW PAEs in the environment and improve soil fertility, researchers are looking for ways to mineralize PAEs. Because the hydrolysis and photolysis rates of PAEs are very slow, biodegradation is the main pathway for the decomposition of environmental PAEs [Citation14]. As reported, PAEs with shorter ester hydrocarbon chains are more easily biodegraded and mineralized by microorganisms [Citation12]. Therefore, searching for efficient PAE-degrading bacteria is considered the primary step toward the removal of LMW PAE residues from soil. The DMP-degrading bacteria isolated so far are most prokaryotic microbes, including Acinetobacter, Arthrobacter, Bacillus, Paracoccus, Brevibacterium, Comamonas, Chryseobacterium, Enterobacter, Gordonia, Lactobacillus, Novosphingobium, Pasteurella, Xanhtomonas, Pseudomonas, Bukholderia, Rhodococcus, Pandoraea and Sphingomonas [Citation15–18]. The optimum degradation temperatures of these bacteria ranging from 20 to 40 °C will not be applicable to high-latitude environments with low annual average temperature, since low-temperature significantly inhibits the degradation activity of DMP-degrading bacteria. However, few studies are available on psychrotolerant DMP-degrading bacteria. In this study, we isolated a psychrotolerant DMP-degrading bacterium from selected frozen soil collected from high-latitude areas in China. The discovery of this bacterium enriches the family of PAEs-degrading bacteria and provides a strain resource for DMP biodegradation in low-temperature environment.
Materials and methods
Microorganism and medium conditions
Frozen soil polluted by domestic waste was collected at a depth of 0.5 m from a refuse disposal station (47°22'43” N, 124°0'42” E) in Tiefeng District, Qiqihar City. In each time, 5 g of frozen soil was loaded in a 250 mL Erlenmeyer glass flask containing 100 mL of minimum salt medium (MSM)-DMP solution. The flask was then incubated on an SHA-C rotary shaker (Guohua Electrical, China) at 15 °C and 100 rpm in the dark for 8 d.
A complete MSM was prepared by adding 2 mL of fresh Solution B to 1000 mL of Solution A. Solution A consisted of 2.0 g/L NH4NO3, 3.0 g/L NaCl, 1.64 g/L K2HPO4•3H2O and 0.39 g/L KH2PO4 in 1000 mL of ddH2O; Solution B (trace elements) consisted of 0.246 g/L MgSO4•7H2O, 0.166 g/L CoCl2•6H2O, 0.074 g/L MnSO4•H2O, 0.288 g/L ZnSO4•7H2O, 0.08 g/L CuSO4, 0.055 g/L CaCl2 and 0.25 g/L FeSO4•7H2O in 1000 mL of ddH2O. The MSM was initially adjusted to pH 7.6 with 1.0 mol/L NaOH or HCl. MSM-DMP was made by diffusing a DMP solution into MSM. A standard Luria broth (LB) medium (pH 7.6) was prepared by dissolving 3.0 g/L Beef extract, 5.0 g/L peptone and 5.0 g/L NaCl in 1000 mL of ddH2O. A domestication medium was prepared by mixing MSM-DMP and LB at appropriate proportions. The basic fermentation medium initially at pH 7.6 was composed of 5.0 g/L Beef extract, 2.0 g/L NH4NO3, 0.1 g/L CaCO3, 2.0 mL of Solution B, 100 μL of Tween-80, 7.0 g/L macro-elements (NaCl: K2HPO4•3H2O: KH2PO4=30:16.4:3.6) and 1000 mL of ddH2O. The volume of the Erlenmeyer flask used in the basic fermentation experiment was 150 mL. The final DMP concentrations in the MSM-DMP, the domestication medium and the basic fermentation medium were all 1000 mg/L.
DMP solution and Tween-80 were filter-sterilized through a 0.22-μm membrane before use. All other media and tools were sterilized in an autoclave at 121 °C for 25 min.
Culture enrichment and isolation
In each experiment, 1 mL of a soil suspension was transferred into a 250-mL Erlenmeyer flask containing 100 mL of the initial domestication medium (MSM-DMP: LB = 1:1, v/v). The flask was then incubated at 15 °C and 100 rpm for 3 d in the dark. When the flask became turbid, 1 mL of the inoculum from the initial domestication medium was inoculated for up to 4 d into the second domestication medium, in which the proportion of MSM to LB increased to 2:1. In this way, the LB concentration in the second domestication medium decreased, whereas the MSM-DMP increased continuously. When the seventh domestication experiment (which lasted 9 d) was started, LB was no longer added to the domestication medium.
The seventh domestication culture (0.1 mL) was spread onto an MSM-DMP solid plate. After incubation at 15 °C in the dark for 5–8 d, the colonies with different morphologies were transferred into the agar-free MSM-DMP and then incubated at the same conditions. When the liquid medium was turbid, 0.1 mL of the liquid culture was spread onto a new MSM-DMP solid plate. Three circulations of ‘liquid medium-solid medium’ alternative experiments were carried out according to the above processes. Finally, nine bacterial colonies (numbered QDA–QDI) were streaked onto slant test-tubes of MSM-DMP and then incubated at 15 °C for 3 d in the dark.
Identification of DMP-degrading bacteria
The purified strain QDF12 was identified by its colour, morphology, size and Gram staining. The morphology of the colonies on agar plates was observed by the naked eye. Cell morphology of strain QDF12 was investigated by using optical microscopy (Olympus BX51, Japan), and its cell size was measured by a microscopic micrometer. The Gram reaction was examined by using the Gram stain.
Further identification was performed by 16S rDNA gene sequencing. The bacterial strain QDF was enriched overnight in the MSM-DMP, and then collected by centrifugation at 10,000 rpm (Sigma 1-14, Germany) for 5 min and were washed twice with sterile water. Cell-free supernatant was transferred into fresh sterile Eppendorf tubes and was used as template DNA for the polymerase chain reaction (PCR). Genomic DNA was extracted by a Takara Genomic DNA extraction kit. Then about 1500 bp length of 16S rDNA was amplified through PCR using the bacterial universal primers 27 F (5′-AGAGTTTGATCCTGGCTCAG-3′) and 1492 R (5′-TACGGYTACCTTGTTACGACTT-3′). The PCR amplification conditions for each PCR mixture (20 μL) were composed of 2.0 μL of 10 × Taq buffer solution, 1.6 μL of deoxyribonucleoside triphosphate (dNTP)(2.5 mmol/L), 0.8 μL of each Primer (20 μmol/L), 0.5 μL of template DNA, 0.2 μL of Taq polymerase (5 U/μL), and 14.1 μL of ddH2O. PCR was performed as follows [Citation19]: preheating at 95 °C for 5 min; then denaturation at 95 °C for 30 s, annealing at 55 °C for 30 s, extension at 72 °C for 1.5 min for 24 cycles, and a final extension at 72 °C for 10 min. Purified PCR products were directly sequenced using an ABI Prism 3730XL Sequencer by Shanghai Majorbio Bio-pharm Technology Co., Ltd. and compared with the referenced sequences from the National Center for Biotechnology Information (NCBI) using BLAST search. The closest references were retrieved from NCBI GenBank and aligned with CLUSTAL W with all parameters set at their default values. Phylogenetic trees were then generated by a neighbour-joining algorithm [Citation20] and Maximum Composite Likelihood model of base substitution as implemented in MEGA7.0.14 [Citation21]. The trees were validated using bootstrap analysis performed with 1000 replicates.
Degradation experiments
The MSM-DMP (100 mL) was inoculated by transferring a loopfull of bacteria from the slant culture into a 250-mL Erlenmeyer flask on a rotary shaker at 15 °C and 100 rpm for 3 d. The medium was harvested on a centrifuge (Sigma 1-14, Germany) in a 50 mL Eppendorf centrifuge tube at 8000 rpm for 10 min. The cell pellets were washed twice with a 0.05 mol/L phosphate buffer solution (pH8.0) under sterile conditions, and re-suspended in the same buffer to optical density at 600 nm (OD600nm) of 0.2. The bacterial suspension was prepared for the subsequent degradation and optimization experiments.
All degradation experiments were carried out in 500-mL glass flasks, each containing 1.0 mL of the bacterial suspension and 200 mL of MSM-DMP. The flasks were then incubated on the rotary shaker at 15 °C and 100 rpm in the dark for 84 h. At the interval of 12 h, 2 mL of the solution in each flask was withdrawn and preserved at −20 °C for residual DMP determination by high-performance liquid chromatography (HPLC) (Elite P230II, Dalian China) [Citation22]. A blank control was set up in the same way except that no cells were added, which eliminated the possibility of DMP decomposition by chemical reactions, such as hydrolysis and oxidation. All the experiments were performed in triplicate. A high-performance DMP-degrading bacterium named QDF12 was obtained from the degradation experiments.
Effects of fermentation conditions on the growth of QDF12
Eight fermentation conditions were studied, including carbon-nitrogen ratio (C/N, beef extract/NH4NO3), CaCO3 concentration (g/L), culture temperature (°C), trace elements (mL), macro-elements (g/L), Erlenmeyer flask volume (mL), Tween-80 (μL/L) and shaking speed (rpm) (). When one fermentation condition was tested, the other conditions were kept constant and at the same levels as those of the basic fermentation medium. The fermentation biomass was determined by enumerating viable cells with the ‘drop count method’ [Citation23]. The fermentation solutions in decimal serial dilutions were prepared with sterile water. The 3-day-old MSM-DMP solid plates were each dropped with the fermentation solution (0.1 mL) and then incubated at 15 °C for 48 h in the dark. The fermentation biomass was calculated as colony forming units (CFU) per milliliter.
Table 1. Experimental range of eight fermentation conditions.
Optimization of fermentation conditions for maximum biomass
The medium components and culture conditions for the fermentation of strain QDF12 were optimized in two steps: Plackett–Burman design (PBD) and response surface methodology (RSM). All experiments were repeated three times and the results were analyzed on Design Expert 8.0.5 and Minitab 16.0 [Citation24].
Plackett–Burman design
PBD is a two-factorial design that identifies the critical physiochemical parameters required to elevate the fermentation biomass of strain QDF12 by screening n variables in n + 1 experiments. All the variables were investigated at two widely-spaced intervals of Negative values (low level, −1) and Positive values (high level, +1) [Citation25]. The details of the design matrix and the results of variable screening were denoted in . The effects of individual parameters on the fermentation biomass, E(Xi), were determined as follows:
(1)
(1)
where
and
represent the response (the fermentation biomass) at which the parameter is at its higher or lower levels respectively; N is the total number of trials, which is 12.
Table 2. Experimental design matrix with response value of PBD for screening significant variables.
Response surface methodology
Four significant factors were screened out, including x1 (C/N), x3 (CaCO3), x6 (temperature) and x8 (shaking speed). Then the levels of these factors and the interaction effects were analyzed and optimized by the central composite design (CCD) [Citation26]. Each variable was studied at five levels: −α, −1, 0, +1 and + α. The full experimental plan consisted of 30 trials (). The fermentation biomass of strain QDF12 was taken as the dependent variable (Response Y). The second-order polynomial coefficients were calculated and analyzed on Design Expert software 8.0.5 (State-Ease Inc., USA) as follows [Citation27]:
(2)
(2)
where
is the predicted response (the fermentation biomass), i and j both range from 1 to the number of variables (n),
is the offset term,
is the ith linear coefficient,
is the ith quadratic coefficient and
is the ijth interaction coefficient,
and
are the levels of the independent variables (C/N, CaCO3, temperature and shaking speed) that influence the response variable Y. The significance of the model was determined via analysis of variance (ANOVA) performed by Fisher's test (F-value). The model adequacy was evaluated by the coefficient of determination R2, adjusted R2 (which adjusts the number of explanatory terms in a model), and predicted R2 (which in regression analysis indicates how well the model predicts the responses for new observations). For each variable, the quadratic models were represented as contour plots and response surface curves were generated on Design Expert.
Table 3. Experimental design and result of CCD of response surface methodology.
Determination of DMP and HPLC conditions
For analysis of extracellular residual DMP in the solution, firstly the suspension of QDF12 (2 mL) was centrifuged at 10,000 rpm for 10 min. Then the supernatant was collected and filtered through a 0.22-μm filter for DMP determination by HPLC (Elite P230II, Dalian China) equipped with a diode array detector and a Hypersil ODS-C18 column (200 × 4.6 × 5μm). The mobile phase consisted of methanol and 0.01 mol/L phosphate solution (pH 7.0) (50:50, v/v) at 25 °C and was added at a rate of 0.5 mL/min. The sample volume (20 μL) was injected into the column and detected at 254 nm. The retention time of DMP was identified according to reference standards [Citation28]. The chemical concentration was quantified using external standards and calibration.
Data analysis
Statistical analysis of the data was done using SPSS 22.0 software and statistically significant differences were determined by applying Student’s t-test. Values p < 0.05 and p < 0.001 were considered to indicate statistical significance. All data were expressed as mean values ± standard deviation (±SD).
Results and discussion
DMP biodegradation kinetics
The degradation kinetics of nine bacterial strains were investigated at initial DMP concentration of 1000 mg/L. The first-order kinetics equation, which is frequently used to describe the biodegradation process, was used here to describe the DMP biodegradation by the DMP-degrading bacteria QDA-QDI [Citation29]:
(3)
(3)
where C is the residual concentration of DMP (mg/L), k is the degradation rate constant, t is time (d) and A is a constant. The half-life of DMP degradation ( h) and the decreasing rate of DMP concentration (v, mg/L•h) were calculated as follows:
(4)
(4)
(5)
(5)
where
is the initial concentration of DMP (mg/L).
The experimental data of DMP biodegradation were fitted using Equation (3) ( and ). The degradation ability of the nine DMP-degrading bacteria can be divided into three levels of high, medium and low efficiency. Only strain QDF was classified as ‘high efficiency’, whereas strains QDC and QDE showed the lowest efficiency, and the other strains were of ‘medium efficiency’. The degradation rates of the nine strains ranged from 9.44 to 20.19 mg/L•h, and the correlation coefficients R were all higher than 98%. The shortest half-life of degradation at 15 °C was 9.8 h (strain QDF). In the MSM-DMP initially containing 1000 mg/L DMP, the degradation rate within 48 h by strain QDF reached 96.89%, and the DMP degradation rate was up to 20.19 mg/L•h, which both surpassed the results of all other strains. The DMP-degrading bacterium Cyanothece sp. PCC7822 screened out by Zhang et al. [Citation30] consumed 40% of 50 mg/L DMP after 72 h and completely degraded it within 120 h, with the maximum degradation rate of only 0.67 mg/L•h. Another DMP-degrading bacterium, Rhodococcus sp. L4, screened and identified by Lu et al. [Citation31] took 96 h to completely degrade 100 mg/L DMP. In other studies, DMP was degraded by mixed bacteria. For example, the multiple microorganisms collected from anaerobic sludge degraded 10 mg/L DMP completely after 6 d, and the half-life of degradation was up to 23.9 h [Citation32]. In conclusion, we screened out a high-efficiency DMP-degrading bacterium that had a higher degradation rate compared with some DMP-degrading bacteria reported previously.
Figure 1. Biodegradation of DMP by DMP-degrading bacteria QDA to QDI.
Note: Initial DMP concentrations were 1000 mg/L. CK, control (1 mL sterilized water was added to the MSM-DMP medium, and there were no DMP degrading bacteria in the medium).
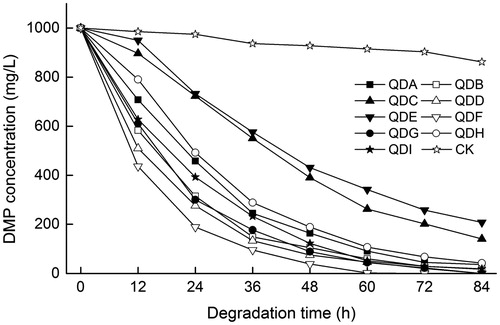
Table 4. Kinetic equations of DMP degradation by DMP-degrading bacteria QDA to QDI.
HPLC method validation
The analytical figures of merit were obtained using the implemented HPLC conditions used for DMP determination. The validation parameters studied were: sensitivity (linearity and linear range), limits of detection (LOD) and quantification (LOQ), and repeatability. A representative analytical curve equation was described as follows:
(6)
(6)
where Speak is the peak area and CDMP is the concentration of DMP (mg/L). The correlation coefficient R of 0.9985 indicated the linear model was adequate to describe the proportionality between peak areas and DMP concentrations. LOD is the lowest detectable concentration of the analyte and provides a signal-to-noise ratio of 3, whereas LOQ is the lowest quantifiable concentration of the analyte and gives the signal-to-noise ratio of 10. In the present study, LOD and LOQ were 0.11 mg/L and 0.37 mg/L, respectively, from which it was inferred that the HPLC method was sensitive to determine the concentrations of DMP. The repeatability of the HPLC method was estimated by comparing the relative standard deviation (RSD%) obtained after three consecutive measurements of nine DMP solutions treated and analyzed by HPLC. The RSD% for the lowest levels was 0.9% (confidence interval of 95%), although it was below 2.8% for the other levels. These results suggested a very high precision of the HPLC method even in the lowest portion of the analytical curve. summarizes the analytical parameters of merit of the analytical method described above. Based on these data, we concluded that the HPLC method can be used for the determination of DMP solutions under the experimental conditions.
Table 5. Analytical figures of merit of the HPLC method.
Characterization and phylogenetic analysis of QDF12
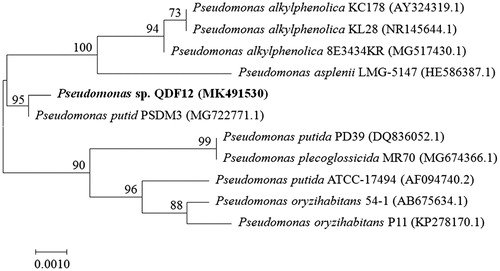
After analysis of the degradation experiment results, we screened out a highly efficient DMP-degrading bacterium QDF12. The strain had cell size of 0.2–0.6 μm × 1.1–2.1 μm and was gram-negative and short-rod-shaped. The strain formed colonies with a diameter of 0.5–1.5 mm after culturing for 24–36 h on the MSM-DMP agar medium; they were ivory, translucent and morphologically round. The colonies turned white after 84 h of incubation. Obvious clear water-like substances were found around the colonies, which may be an extracellular secretion of the bacterium containing a component capable of degrading extracellular DMP. The 16S rDNA gene was amplified via PCR using a universal bacterial primer set (27 F and 1492 R), which was obtained from strain QDF. The 16S rDNA partial gene sequences of strain QDF were aligned and compared with the 16S rDNA bacterial gene sequences in the GenBank on MEGA 7.0. Based on the phylogenetic analysis, the 16S rDNA sequence similarity search - BLAST showed the highest similarity with Pseudomonas (95%) and query cover of 100%. The phylogenetic tree was constructed () using the neighbour-joining method with bootstrapping and rooted by Pseudomonas putida. It showed that the strains fell within a cluster of gammaproteo-bacteria Pseudomonas. The tree shows the relative relationship between strain QDF12 and related species. We compared the characteristics of strain QDF12 with various Pseudomonas species listed in the phylogenetic tree. However, we cannot clearly identify it at the species level. So far, the acceptable positional standard is that if the similarity of sequences between the tested strain and a reference strain is higher than 97–98%, they are regarded as the same genus [Citation33]. Therefore, based on the results of the phylogenetic analysis and phenotypic analysis, the strain QDF12 was designated as Pseudomonas sp.QDF12. The partial nucleotide sequence of this strain was deposited in GenBank under the accession number MK491530. This strain was preserved in the China Center for Type Culture Collection (CCTCC) with the reference number of CCTCC NO. M2018272.
Figure 2. Phylogenetic tree based on 16S rDNA sequences of DMP-degrading bacteria QDF12 and representative species of the genus Pseudomonas.
Note: The numbers at the branch nodes are bootstrap values based on 1000 replicates.
Effects of fermentation conditions on the growth of Pseudomonas sp. QDF12
The effects of fermentation conditions (C/N, CaCO3, culture temperature, trace elements, macro-elements, Erlenmeyer flask volume, Tween-80 and shaking speed) on fermentation biomass at different levels are shown in . The main nutrients in the fermentation medium were of carbon (beef extract) and nitrogen (NH4NO3) sources. The fermentation biomass depended on the carbon/nitrogen (C/N) ratio and was generally promoted by a higher C/N ratio [Citation34,Citation35]. The experiments showed that Pseudomonas sp. QDF12 had the highest fermentation biomass when the C/N ratio was 4/1 (), which was similar with another study [Citation36]. The effects of trace elements on fermentation biomass were quite different from those of macro-elements (). Trace elements even at low concentrations (<3.5 mL/L) obviously inhibited the fermentation, whereas macro-elements only showed obvious inhibitory effect at high concentrations (>11.0 g/L). This indicates that low concentrations of trace elements will lead to a decline in the fermentation yield. In general, trace elements are involved in many metabolic pathways in cells, e.g. Mg2+, Zn2+ and Cu2+, which are activators of many enzymes; Fe2+, Co2+, Mn2+ and Mo2+, which are structural components of many special molecules; Ca2+ and K+, which are cofactors of some enzymes and can keep cell stability and osmotic pressure. Sufficient trace elements should be maintained in order to keep the normal growth and metabolism of cells. Thus, the concentrations of trace elements should be strictly controlled.
Figure 3. Effect of eight fermentation conditions on the growth of Pseudomonas sp. QDF12.
Note: Error bars indicate averaged values ± standard deviation from three independent experiments. Statistically significant differences (p < 0.05) were determined by applying Student’s t-test and denoted with different letters above each column.
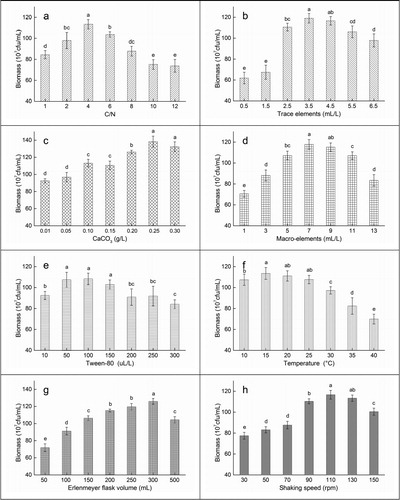
CaCO3 was added as a pH stabilizer to the fermentation medium. When abundant H+ existed in the fermentation medium, CO32+ quickly combined with it to form HCO3+ or CO2 and H2O. This kept the fermentation medium at neutral or weak alkaline conditions for a long time, thereby benefiting the growth of prokaryotic cells [Citation37]. Moreover, the maximum biomass with the presence of 0.25 g/L CaCO3 was 22.17% higher than that in the basic fermentation medium (p < 0.05) (), further indicating that the stable pH of the fermentation medium significantly promoted the fermentation. Tween-80 is a commonly-used nonionic surfactant that enhances the permeability of cell membranes and increases the cellular ability to absorb nutrients or secrete metabolites [Citation38]. In this experiment, the addition of 50–100 μL/L Tween-80 enhanced the fermentation (). As reported similarly, the non-ionic surfactant below the concentration of 5 mL/L in the culture medium could significantly improve the permeability of cell membranes and increase the fermentation yield [Citation39]. At present, most of the identified DMP-degrading bacteria are mesophilic bacteria, which grow at an optimum temperature between 20 and 40 °C [Citation16,Citation27–30]. This temperature range is not suitable for the growth of these bacteria in northern areas, especially in the environment where the annual average temperature is below 20 °C. Thus, the lower temperatures in the studied areas were more favourable for the growth of Pseudomonas sp. QDF12. The highest fermentation biomass at 15.0 °C was 1.14 × 10⁹ cfu/mL (), and the corresponding DMP degradation rate was up to 20.19 mg/L•h (), indicating that Pseudomonas sp. QDF12 was suitable for production and application in low-temperature areas.
We innovatively chose the shaking bottle volume as an optimization factor for the first time. The gas/liquid contact area per unit volume of a fermenter is decided by its fermentation capacity, which affects the volumetric oxygen transfer coefficient, thereby affects the oxygen transfer rate (OTR) and the fermentation efficiency [Citation40]. The results showed that the fermentation biomass maximized when the flask volume, the gas/liquid contact area of the fermentation medium and the specific surface area of the fermentation liquid were 300 mL, 46.57 cm2 and 0.1552 cm2/mL, respectively (). The fermentation biomass began to decrease when the flask volume was enlarged. Reportedly, the fermentation medium shakes more intensely in a larger-volume shaking bottle under a constant shaking speed (100 rpm), and cells cannot grow in a relatively unstable environment, resulting in slow growth. Especially in the process of producing a metabolite, a faster shaking speed will greatly reduce the fermentation yield [Citation41].
Optimization of fermentation conditions
Identifying the significant factors using Plackett-Burman design
The important fermentation factors with respect to their main effects were screened out by PBD. The effects of the screened factors on the fermentation biomass were studied through 12 runs of experiments (). Statistical analysis of the responses was also performed (). The obtained F-value of 33.92 indicates that the model is significant (p < 0.05). The coefficient of determination R2 (0.9890) and adjustment coefficient R (0.9797) indicate that the data variability can be well explained by the models [Citation42].
Table 6. Statistical analysis of the Plackett–Burman design.
The p-value of ANOVA helped to identify the significance of each term at the designed confidence level. Any variable with confidence level above 95% was considered as significant. Accordingly, x1, x3, x6 and x8 were significant terms, and the other factors in the tested ranges did not cause significant variation in the fermentation process. The effects of the eight factors on the fermentation biomass in the tested ranges ranked as follows x1>x3>x8>x6>x2 and x5>x7>x4. Based on the ANOVA results, a first-order polynomial equation representing the production of fermentation biomass of QDF12 against eight independent variables was derived:
(7)
(7)
The positive or negative sign represents the direction of the effect that a certain factor has on the fermentation biomass. The coefficients of C/N (−17.58), CaCO3 (+11.75), culture temperature (−0.79) and shaking speed (−0.22) indicate that the high levels of CaCO3 concentrations and the low levels of C/N, culture temperature and shaking speed are all beneficial for the fermentation biomass.
In conclusion, the fermentation conditions of C/N, CaCO3, culture temperature and shaking speed all significantly affected the fermentation biomass. The optimal levels of these four factors were further optimized by statistical optimization methods.
Optimization by RSM
The interactions among the significant factors and their optimal levels were studied via CCD [Citation43]. When a significant factor was studied, the other factors were maintained constant, which yielded the maximal fermentation biomass (). The results of the fermentation biomass are presented in . According to the results of multiple regression analysis, a second-order polynomial equation was derived as follows:
(8)
(8)
where Y is the predicted fermentation biomass (×107cfu); x1, x3, x6 and x8 are actual values of C/N, CaCO3, culture temperature and shaking speed, respectively.
The model adequacy was tested using ANOVA through Fisher’s test (). The F-value of 58.97 indicates that the model is significant and the Lack of Fit (LOF) F-value of 2.56 is insignificant. A coefficient of determination (R2) closer to 1 indicates a better correlation between the predicted and observed values, and a smaller coefficient of variation (C.V.%) implies a higher reliability of the experiment [Citation35,Citation44]. In this study, the R2 of 0.9823, predicted R of 0.9538 and adjusted R of 0.9826 were consistent, and the predicted R and adjusted R were within 0.20 of each other. This indicates the consistency between the experimental and predicted data. The C.V.% of 3.69 indicates the experiments were highly reliable. Diagnostic plots were drawn to assess how well the model approximated the true response surface [Citation45], and some selected plots are shown in . The normal probability of residuals () was normally distributed and the residuals were approximated along a straight line, which signified an acceptable model [Citation46,Citation47]. The studentized residuals plotted against the response of fermentation biomass were scattered in a desired random way (). The actual responses plotted against the predicted responses showed good agreement (). Diagnostic plots, including the Box-Cox plot (), indicated that data transformation was unnecessary and therefore was not performed here. All the statistical results prove the second-order polynomial equation is highly accurate and generally applicable and adequate to describe the responses observed in the experiments.
Figure 4. Diagnostic plots showing the normal probability plot of residuals (a); studentized residuals (b) plotted against the response of predicted fermentation biomass; actual responses (c) plotted against the predicted response and Box-Cox plot (d) showing data transformation was unnecessary.
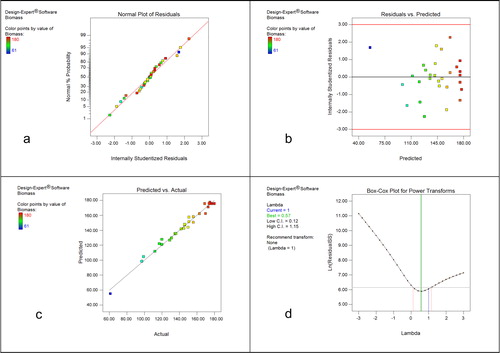
Table 7. ANOVA for the regression model of fermentation biomass from the experimental results.
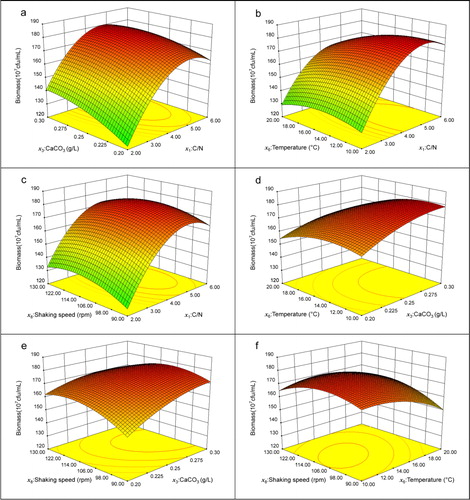
The p-values are of vital importance for understanding the patterns of mutual interactions among the experimental variables. The p-value of less than 0.001 indicates high significance [Citation48]. The linear terms of the independent variables including x1, x3, and x6 significantly affected the response Y (). The quadratic terms of the four variables and the interactions between x1 and x6, between x3 and x8, and between x6 and x8 also significantly affected the fermentation biomass. Notably, the effects of x1, x3, x6, x12, x32, x62 and x82 (p < 0.001) were higher than other effects, and thus were the most significant variables influencing the fermentation biomass. The response surface contour plots are generally the graphical representation of the regression equation. Based on the contour plots and response surface curves (), the fermentation biomass at different levels of the four factors can be predicted [Citation49]. Each contour ellipse plot represents an infinitive number of combinations of two factors, with the other two factors maintained at their central levels [Citation50]. The maximum predicted value is indicated by the response surface confined in the smallest ellipse in the contour diagram. The maximal fermentation biomass under the conditions of 4.70 of C/N and 0.28 g/L of CaCO3 was 1.81 × 10⁹ CFU/mL, whereas the temperature and shaking speed were both held at the zero level (). The highest fermentation biomass at 4.94 of C/N and 12.1 °C was 1.81 × 10⁹ CFU/mL, whereas CaCO3 and shaking speed were held at 0.25 g/L and 110 rpm respectively (). With C/N at 4.84 and shaking speed at 112 rpm, the fermentation biomass maximized to 1.79 × 10⁹ CFU/mL with CaCO3 and temperature held at 0.25 g/L and 15.0 °C respectively (). At the conditions of 0.29 g/L CaCO3 and 12.2 °C (), 0.29 g/L CaCO3 and shaking speed of 109 rpm (), and 12.9 °C and shaking speed of 110 rpm (), the maximum fermentation biomass was 1.80 × 10⁹, 1.78 × 10⁹, and 1.77 × 10⁹ CFU/mL respectively.
Figure 5. Contour plots and response surface curves of biomass showing interaction between C/N and CaCO3 (a), C/N and temperature (b), C/N and shaking speed (c), CaCO3 and temperature (d), CaCO3 and shaking speed (e), and temperature and shaking speed (f).
According to Equation (8), it can be predicted that the fermentation biomass will reach a maximum of 1.84 × 10⁹ cfu/mL when the four factors are C/N at 4.71:1 (beef extract 8.249 g/L, NH4NO3 1.751 g/L), 0.29 g/L CaCO3, 12.0 °C and shaking speed at 99 rpm. The other non-significant fermentation conditions were 3.5 mL/L of solution B, 7.0 g/L of macro-elements (NaCl 4.175 g/L, K2HPO4•3H2O 2.282 g/L, KH2PO4 0.543 g/L), 100 μL/L of Tween-80,300 mL of Erlenmeyer flask volume and 1000 mg/L of DMP.
Validation and application of the experimental model
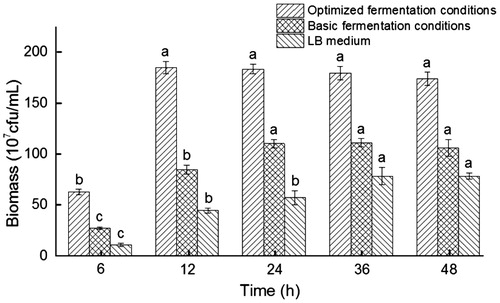
An optimized fermentation medium was prepared by combining all the optimized fermentation factors at the required levels. The maximum fermentation biomass peaked to 1.85 × 10⁹ cfu/mL under the optimized fermentation conditions (), which agrees well with the prediction of 1.84 × 10⁹ cfu/mL. This comparison validates that the statistical model is successful, accurate and reliable for predicting the fermentation biomass. The optimized fermentation medium can enhance the fermentation biomass and accelerate the growth compared with the basic fermentation medium. The maximum fermentation biomass was 66.67% higher compared with that obtained in the basic fermentation medium (1.11 × 10⁹ cfu/mL) and 134.18% higher compared with the LB medium (0.79 × 10⁹ cfu/mL). The fermentation time was shortened from 72 to 12 h, greatly improving the fermentation efficiency, and the optimum fermentation temperature dropped to 12.0 °C. Overall, the DMP-degrading bacterium Pseudomonas sp. QDF12 is characterized by high efficiency, low energy consumption and high yield under the optimized conditions.
Figure 6. Growth of Pseudomonas sp. QDF12 under different fermentation conditions.
Note: Data are averaged values from three independent experiments. Error bars indicate standard deviation (±SD). Statistically significant differences (p < 0.05) were determined by applying Student’s t-test and were denoted with different letters above each column.
Conclusions
A psychrotolerant DMP-degrading bacterium QDF12 was isolated from selected frozen soil by gradient domestication and solid-liquid mixed separation and identified as Pseudomonas sp. The strain QDF12, which used DMP as the sole carbon and energy source, could efficiently degrade DMP at low temperature. The fermentation conditions of strain QDF12 were optimized through Plackett-Burman design and response surface methodology in order to enhance the fermentation yield. Compared with the basic fermentation medium and LB medium, the optimized fermentation conditions significantly increased the fermentation biomass, shortened the fermentation time and reduced the fermentation temperature. Therefore the application of the optimized fermentation conditions will reduce costs, increase speeds and improve benefits for large-scale productions of the DMP-degrading bacterium Pseudomonas sp. QDF12.
Disclosure statement
The authors declare that they have no competing interests.
Additional information
Funding
References
- Xu B, Gao NY, Cheng HF, et al. Oxidative degradation of dimethyl phthalate (DMP) by UV/H2O2 process. J Hazard Mater. 2009;162(2-3):954–959.
- Latini G. Monitoring phthalate exposure in humans. Clin Chim Acta. 2005;361(1-2):20–29.
- Boonnorat J, Chiemchaisri C, Chiemchaisri W, et al. Removals of phenolic compounds and phthalic acid esters in landfill leachate by microbial sludge of two-stage membrane bioreactor. J Hazard Mater. 2014;277:93–101.
- Pivnenko K, Eriksen MK, Martín-Fernández JA, et al. Recycling of plastic waste: presence of phthalates in plastics from households and industry. Waste Manage. 2016;54:44–52.
- Bhatia H, Kumar A, Ogino Y, et al. Di-n-butyl phthalate causes estrogenic effects in adult male Murray rainbowfish (Melanotaenia fluviatilis). Aquat Toxicol. 2014;149:103–115.
- Santangeli S, Maradonna F, Zanardini M, et al. Effects of diisononyl phthalate on Danio rerio reproduction. Environ Pollut. 2017;231:1051–1062.
- Pant N, Shukla M, Kumar Patel D, et al. Correlation of phthalate exposures with semen quality. Toxicol Appl Pharmacol. 2008;231(1):112–116.
- Wu D, Mahmood Q, Wu LL, et al. Activated sludge-mediated biodegradation of dimethyl phthalate under fermentative conditions. J Environ Sci. 2008;20(8):922–926.
- Wang J, Luo YM, Teng Y, et al. Soil contamination by phthalate esters in Chinese intensive vegetable production systems with different modes of use of plastic film. Environ Pollut. 2013;180:265–273.
- Niu L, Xu Y, Xu C, et al. Status of phthalate esters contamination in agricultural soils across China and associated health risks. Environ Pollut. 2014;195:16–23.
- Wu W, Hu J, Wang JQ, et al. Analysis of phthalate esters in soils near an electronics manufacturing facility and from a non-industrialized area by gas purge microsyringe extraction and gas chromatography. Sci Total Environ. 2015;508:445–451.
- He LZ, Gielen G, Bolan NS, et al. Contamination and remediation of phthalic acid esters in agricultural soils in China: a review. Agron Sustain Dev. 2015;35(2):519–534.
- Wang ZG, Hu YL, Xu WH, et al. Impacts of dimethyl phthalate on the bacterial community and functions in black soils. Front Microbiol. 2015;6:405.
- Abdel Daiem MM, Rivera-Utrilla J, Ocampo-Pérez R, et al. Environmental impact of phthalic acid esters and their removal from water and sediments by different technologies-A review. J Environ Manage. 2012;109:164–178.
- Zeng F, Cui KY, Li XD, et al. Biodegradation kinetics of phthalate esters by Pseudomonas fluoresences FS1. Process Biochem. 2004;39(9):1125–1129.
- Zhang JF, Zhang CN, Zhu YP, et al. Biodegradation of seven phthalate esters by Bacillus mojavensis B1811. Int Biodeterior Biodegrad. 2018;132:200–207.
- Yang J, Guo CL, Liu SS, et al. Characterization of a di-n-butyl phthalate-degrading bacterial consortium and its application in contaminated soil. Environ Sci Pollut Res. 2018;25(18):17645–17653.
- Gao DW, Wen ZD. Phthalate esters in the environment: a critical review of their occurrence, biodegradation, and removal during wastewater treatment processes. Sci Total Environ. 2016;541:986–1001.
- Dong YL, Li H, Rong SH, et al. Isolation and evaluation of Bacillus amyloliquefaciens Rdx5 as a potential biocontrol agent against Magnaporthe oryzae. Biotechnol Biotechnol Equip. 2019;33:1–11.
- Zhou Y, Hu LF, Song JB, et al. Isolation and characterization of a MADS-box gene in cucumber (Cucumis sativus L.) that affects flowering time and leaf morphology in transgenic Arabidopsis. Biotechnol Biotechnol Equip. 2019; 33(1):54–63.
- Wang HY, Zhang W, Ye YP, et al. Isolation and characterization of Pseudoxanthomonas sp. strain YP1 capable of denitrifying phosphorus removal (DPR). Geomicrobiol J. 2018;35(6):537–543.
- Xu ZW, Cheng L, Shi J, et al. Kinetic study of the removal of dimethyl phthalate from an aqueous solution using an anion exchange resin. Environ Sci Pollut Res. 2014;21(10):6571–6577.
- Collins CH, Lyne PM, Grange JM, et al. Microbiological methods. London: Arnold; 2004.
- Kabdaşlı I, Olmez-Hanci T, Tünay O, et al. Application of response surface methodology for dimethyl phthalate treatment via H2O2/UV-C process. Desalin Water Treat. 2016;57(54):26165–26173.
- Plackett RL, Burman JP. The design of optimum multifactorial experiments. Biometrika. 1946;33(4):305–325.
- Hu GJ, Li JB, Zhang XY, et al. Investigation of waste biomass co-pyrolysis with petroleum sludge using a response surface methodology. J Environ Manage. 2017;192:234–242.
- Kar S, Ray RC. Statistical optimization of alpha-amylase production by Streptomyces erumpens MTCC 7317 cells in calcium alginate beads using response surface methodology. Pol J Microbiol. 2008;57(1):49–57.
- Wu DL, Mahmood Q, Zheng P, et al. Isolation and physiology of a dimethyl phthalate degrading bacterial strain YZ2. Environ Prog. 2007;26(4):384–390.
- Surhio MA, Talpur FN, Nizamani SM, et al. Complete degradation of dimethyl phthalate by biochemical cooperation of the Bacillus thuringiensis strain isolated from cotton field soil. RSC Adv. 2014;4(99):55960–55966.
- Zhang XH, Liu LC, Zhang SP, et al. Biodegradation of dimethyl phthalate by freshwater unicellular cyanobacteria. Biomed Res Int. 2016;2016:1.
- Lu Y, Tang F, Wang Y, et al. Biodegradation of dimethyl phthalate, diethyl phthalate and di-n-butyl phthalate by Rhodococcus sp. L4 isolated from activated sludge. J Hazard Mater. 2009;168(2-3):938–943.
- Wang JL, Chen LJ, Shi HC, et al. Microbial degradation of phthalic acid esters under anaerobic digestion of sludge. Chemosphere. 2000;41(8):1245–1248.
- Michael JJ, Abbott SL. Bacterial identification for publication: when is enough enough? J Clin Microbiol. 2002;40(6):1887–1891.
- Pitol LO, Finkler ATJ, Dias GS, et al. Optimization studies to develop a low-cost medium for production of the lipases of Rhizopus microsporus by solid-state fermentation and scale-up of the process to a pilot packed-bed bioreactor. Process Biochem. 2017;62:37–47.
- Jia J, Yang XF, Wu ZL, et al. Optimization of fermentation medium for extracellular lipase production from Aspergillus niger using response surface methodology. Biomed Res Int. 2015;2015:1.
- Mao XB, Eksriwong T, Chauvatcharin S, et al. Optimization of carbon source and carbon/nitrogen ratio for cordycepin production by submerged cultivation of medicinal mushroom Cordyceps militaris. Process Biochem. 2005;40(5):1667–1672.
- Zou MY, Guo FF, Li XZ, et al. Enhancing production of alkaline polygalacturonate lyase from Bacillus subtilis by fed-batch fermentation. PLoS One. 2014;9(3):e90392.
- Nielsen CK, Kjems J, Mygind T, et al. Effects of Tween 80 on growth and biofilm formation in laboratory media. Front Microbiol. 2016;7:1878.
- Todorov SD, Vaz-Velho M, de Melo Franco BDG, et al. Partial characterization of bacteriocins produced by three strains of Lactobacillus sakei, isolated from salpicao, a fermented meat product from North-West of Portugal. Food Control. 2013;30(1):111–121.
- Thibault J, Pouliot K, Agosin E, et al. Reassessment of the estimation of dissolved oxygen concentration profile and KLa in solid-state fermentation. Process Biochem. 2000;36(1-2):9–18.
- Arthur Felse P, Panda T. Submerged culture production of chitinase by Trichoderma harzianum in stirred tank bioreactors-the influence of agitator speed. Biochem Eng J. 2000;4(2):115–120.
- Bao YL, Ye ZF. Application of an integrated statistical design for optimization of culture condition for ammonium removal by Nitrosomonas europaea. PLoS One. 2013;8(4):e60322.
- Peng HS, Tan J, Bilal M, et al. Enhanced biosynthesis of phenazine-1-carboxamide by Pseudomonas chlororaphis strains using statistical experimental designs. World J Microbiol Biotechnol. 2018;34(9):129.
- Isiaka Adetunji A, Olufolahan Olaniran A. Optimization of culture conditions for enhanced lipase production by an indigenous Bacillus aryabhattai SE3-PB using response surface methodology. Biotechnol Biotechnol Equip. 2018;32(6):1514–1526.
- Kamble PP, Suryawanshi SS, Jadhav JP, et al. Enhanced inulinase production by Fusarium solani JALPK from invasive weed using response surface methodology. J Microbiol Methods. 2019;159:99–111.
- Silva V, Couto N, Eusébio D, et al. Multi-stage optimization in a pilot scale gasification plant. Int J Hydrogen Energy. 2017;42(37):23878–23890.
- Kar S, Ray RC, Mohapatra UB. Alpha-amylase production by Streptomyces erumpens MTCC 7317 in solid state fermentation using response surface methodology (RSM). Pol J Microbiol. 2008;57(4):289–296.
- Ben Mefteh F, Frikha F, Daoud A, et al. Response surface methodology optimization of an acidic protease produced by Penicillium bilaiae isolate TDPEF30, a newly recovered endophytic fungus from healthy roots of date palm trees (Phoenix dactylifera L.). Microorganisms. 2019;7(3):74.
- Fu ZL, Sun BG, Li XT, et al. Isolation and characterization of a high ethyl acetate-producing yeast from Laobaigan Daqu and its fermentation conditions for producing high-quality Baijiu. Biotechnol Biotechnol Equip. 2018;32(5):1218–1227.
- Farag S, Soliman NA, Abdel-Fattah YR. Statistical optimization of crude oil bio-degradation by a local marine bacterium isolate Pseudomonas sp. sp48. J Genet Eng Biotechnol. 2018;16(2):409–420.