
Abstract
Microbial communities drive the biogeochemical cycles in wetlands and provide a number of ecosystem services. They underpin soil function, and are easily impacted by anthropogenic pressure. This study examined the bacterial microbiome in the natural wetland of Zlato Pole and the protected, periodically flooded rice paddies in the Maritsa River Basin using a metagenomic approach, based on high-throughput sequencing. Alpha-diversity analysis showed a significant variation between the three study sites for Chao1 and ACE (abundance based coverage estimator) richness estimators. A positive correlation was established with pH, with highest values detected for the rice paddies and the lowest, for the Zlato Pole sediments. The obtained sequences were assigned into 37 known bacterial phyla with over 97% bacterial sequences classified within only nine of them. The bacterial communities in rice paddies sediments were more evenly distributed, whereas the Zlato Pole sediment was the most biased. The consortiums in the rice paddies were dominated by Proteobacteria, followed by Actinobacteria and Acidobacteria. The bacterial assemblages in those sites could not be distinguished by analysis of similarity. The Zlato Pole sediment community held an isolated position, where Acidobacteria was replaced by Firmicutes and Bacteroidetes and the microbiome showed an extremely high abundance of Gammaproteobacteria and Bacilli. The dominance of Gammaproteobacteria and the presence of Deinococcus-Thermus phylum, along lower nutrient concentration and the absence of correlation with the environmental parameters, is evidence of constant anthropogenic pressure around the area. The obtained results could be applied in the plans for sustainable management of the protected wetlands.
Introduction
Wetlands are unique ecosystems combining terrestrial and aquatic habitats. As such, they exhibit some of the characteristics of each system, covering 7.7% of the existing land area [Citation1]. They are estimated to be one of the most important terrestrial ecosystems providing a vast diversity of services, such as removal of pathogens [Citation2], environmental pollution and flood control, nutrient cycling [Citation3], terrestrial runoff buffers, etc. [Citation4]. Natural wetlands globally are extremely sensitive threatened resources due to the constant urbanization, agricultural pressure and climate change [Citation5]. Bulgaria is one of European Union member states with the lowest share of land area covered by wetlands (0.8%) [Citation1]. The Maritza River Basin is a major inland area including different aquatic environments, such as Zlato Pole natural wetland, situated in the old riverbed, and periodically flooded rice paddies. Both wetlands are included in the national action plan for the conservation of wetlands of high significance in Bulgaria as potential Ramsar sites [Citation6]. They play a crucial role as wildlife habitats and fall under the protection of the Birds Directive 2009/147/EC [Citation7]. Their nature and situation in densely populated areas render them extremely sensitive to water and forestry management activities, extraction of sand and gravel, poaching and pollution [Citation6]. The Zlato Pole protected area is highly vulnerable, as most of its natural ecosystems are or have been subjected to long-standing and strong anthropogenic press. On the other hand, paddy fields make up the largest anthropogenic wetlands on earth [Citation8]. The differences in the aquatic and exploitation regime in relatively closely situated wetlands make them suitable for research on the effects of anthropogenic pressure on wetland health, which was the topic of the present study.
Wetland performance is often evaluated by direct measurement of vegetation or macroinvertebrates, but they do not provide an accurate assessment [Citation9]. In recent years studies have been focused on the structure and diversity of sediment microbial communities as biological indicators [Citation4,Citation10], as they have a significant relationship with trophic status [Citation11]. The sediment communities are more suitable for ecological assessment due to the much higher taxa diversity and abundance compared to the corresponding water body [Citation12]. This is a result of the presence of complex matrix providing a surface for the microbial growth [Citation13]. The microbial consortium (microbiome) in the soil at a given location includes diverse species based on ecological selection principles [Citation14]. Two major groups of factors regulate the microbial community composition and diversity: the “bottom-up controllers”, including environmental factors such as nitrogen forms, organic matter, phosphorus, etc., and the biological factors (viruses, Protista grazing), known as “top-down controllers” [Citation15]. Therefore, the sediment community richness and abundance are a reflection of the total sum of factors affecting the given ecosystem, and understanding the differences in the taxonomic composition in different types of wetlands is crucial [Citation11]. The sediment communities have a vital role in the biogeochemical processes, energy transfer, and climate regulation. They can shape the physical and chemical characteristics of a wetland soil [Citation13,Citation16], having both direct and indirect effects on the health of the ecosystems [Citation14,Citation17].
This study aimed to provide a comparative analysis of the bacterial communities in Zlato Pole wetland and in seasonally flooded paddy fields, using a metagenomic approach, based on high-throughput sequencing, and to examine the correlation of the microbial communities’ composition with the soil properties. The knowledge of the soil microbiome could be applied in the plans for restoration, protection and sustainable management of the protected wetlands.
Materials and methods
Experimental locations
Wetland sites are located along the Bulgarian part of Maritsa River and include Zlato Pole wetland (ZP) and Tsalapitsa rice paddies (“Orizishta Tsalapitsa”), both protected under the Birds Directive (79/409/EEC). Protected zone Zlato Pole was used as a reference site with shores covered primarily with Typha sp. and Salix sp. It is the largest natural wetland (BG0002103) along the Bulgarian part of the Maritsa River. The site includes the old riverbed and several basins located several kilometers away from the town of Dimitrovgrad, south of the Zlato pole village. Two isolated, periodically flooded, rice paddies were selected in the protected zone “Orizishta Tsalapitsa” (BG0002086). It is a complex of rice paddies situated between the village of Tsalapitsa and the city of Plovdiv. The sampling locations are coded as follows: ZP1, Zlato Pole sediments (42°2.207', 25°42.938'); ZP2, soil from the non-flooded part of Zlato Pole wetland (42°2.241', 25°42.944'); C1, Tsalapitsa rice paddy sediments(42°13.600', 24° 33.804'; C2, soil from the non-flooded part of Tsalapitsa rice paddy (42°13.396', 24° 33.202'); P1, Plovdiv rice paddy sediments (42°10.307', 24°40.502'); P2, soil from the non-flooded part of Plovdiv rice paddy (42°10.436', 24°40.403').
Soil sampling
Soil samples from the topsoil 0–10 cm were collected in triplicates in July 2018 during the rice maturity stage, from flooded and non-flooded rice paddies and from the sediments and the non-flooded area at Zlato Pole. Each sample was mixed from nine random soil cores [Citation18]. All samples were homogenized and sieved through a 2-mm mesh and partitioned into two subsamples: one was partially air-dried for chemical analysis, and one was placed in sterile 50-mL containers and stored at 4 °C in the dark for no longer than 24 h for microbiological analysis.
Physicochemical analysis
Soil moisture was determined by measuring the weight loss on drying the sample at 105 °C for 24 h. Soil pH was measured with a pH meter (WTW/SET) in a slurry of soil and water 1:2.5. Nitrate (NO3-N) and ammonium (NH4-N) nitrogen content was analyzed after soil extraction with 0.1 N KCl according to Motsara and Roy [Citation19]. Total nitrogen content was determined by the Kjeldahl method [Citation20]. Organic matter (OM) content was measured by calculating the loss of weight on ignition at 600 °C. Available phosphorus (AP) content was determined spectrophotometrically by Olsen’s method [Citation19].
DNA extraction
Total genomic DNA was directly extracted from 0.25 g soil sample with DNeasy PowerSoil Kit (Qiagen) according to the producer’s protocol. The quality and quantity of the randomly-sheared, high molecular weight metagenomic DNA were evaluated by BioSpectrometer (Eppendorf) with µCuvette G 1.0 (Eppendorf) and agarose gel electrophoresis.
16S rRNA amplicon sequencing and data analysis
The V3–V5 hypervariable region of the 16S rRNA gene was amplified and sequenced using MiSeq Illumina platform with the 2 × 300bp paired-end read at Eurofins MWG Operon (Ebersberg, Germany).
The quality of the raw data was checked using FastQC. To preserve only high-quality sequences, all reads in the FASTQ files with sequencing errors or with ambiguous bases (“N”) were removed. After preprocessing, sequences were trimmed using Trimmomatic to 255 bp length to remove low-quality bases from the 3′ end [Citation21]. Chimeras were detected and removed using USEARCH [Citation22] as it is implemented in the QIIME-pipeline [Citation23]. Operational taxonomic units (OTUs) were picked using the QIIME script (pick_open_reference.py); sequences were clustered with UCLUST and taxonomies assigned based on the SILVA (v132, https://www.arb-silva.de. . . . . . . . ) database at 97% identity cut-off value [Citation24]. The OTU counts were normalized by subsampling to the lowest number of OTUs found in the sample. The community alpha diversity indexes were calculated using QIIME v1.9.1 [Citation23].
Interactive visualization charts of the taxonomic diversity of the samples were generated using KRONA tool [Citation25].
Data availability
Raw sequences for each sample were deposited in GenBank SRA archive and are available with the following accession numbers: BioProject accession number PRJNA563557; Samples accession numbers: SAMN12676176, SAMN12676177, SAMN12676178, SAMN12676179, SAMN12676180, SAMN12676181 (http://www.ncbi.nlm.nih.gov/bioproject/563557. . . . . .).
Statistical analysis
Statistical analyses were done using Primer 6 (Primer-E, Ltd), Statistica v.10 (StatSoft) and Microsoft Excel with XLSTAT software package (Addinsoft). Prior to the analysis, physicochemical parameters were standardized by subtracting the distribution mean from each value and then dividing the values to the standard deviation. Principle Component Analysis (PCA) of normalized soil chemistry variables was chosen to show the environmental parameter variations between samples. For the beta-diversity analyses, singleton and doubleton sequences were removed and the individual taxa abundance was transformed by the square root to downweight high abundance sequences [Citation26]. Permutational multivariate analysis of variance (perMANOVA) and analysis of similarities (ANOSIM) were used to test the differences between the two types of wetlands as well as between the flooded and non-flooded soils in the studied areas and to assess the within-group and between-group means [Citation27]. Non-metric multidimensional scaling (NMDS) plots were generated to visualize the dissimilarity in the microbial communities between the different sites. The NMDS was based on a Bray-Curtis similarity matrix [Citation28,Citation29]. Redundancy analysis was used to establish the relationships between microbial communities’ composition, soil type and predictor variables (environmental variables). Correlation analysis (Pearson) was used to analyze the correlation between genera and physicochemical parameters. The significance of all statistical tests was assessed at α = 0.05. Heatmaps and cluster dendrograms based on Euclidean dissimilarity metrics were constructed based on the relative taxa abundance [Citation30].
Results and discussion
Physicochemical parameters
The physicochemical characteristics of the sampled soils are shown in . Principal component analysis was performed to compare the physical and chemical variations of flooded and non-flooded soils in the studied sites. The patterns are shown in . The first two principal components explained 79.54% of the total environmental data variation. All samples, with the exception of Zlato Pole sediments, were situated along the PC1 axis. The ANOSIM categorized the flooded and non-flooded samples into two distinct groups, which were confirmed by the high R-value (R = 0.926; p < 0.01), with no significant differences between the natural wetland and the paddy fields (p = 0.133).
Figure 1. PCA soil biplot based on the environmental parameters sampled from the flooded and non-flooded areas of the studied wetlands. ZP1, Zlato Pole wetland sediments; ZP2, soil from the non-flooded part of Zlato Pole wetland; C1, Tsalapitsa rice paddy sediments; C2, soil from the non-flooded part of Tsalapitsa rice paddy; P1, Plovdiv rice paddy sediments; P2, soil from the non-flooded part of Plovdiv rice paddy.
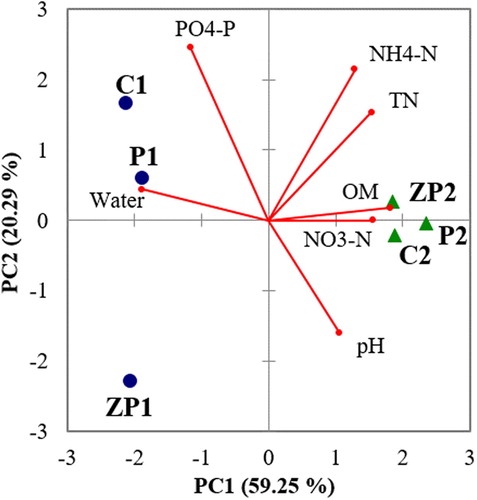
Table 1. Values of the environmental parameters from the sampling sites in the studied wetlands.
The soils from Zlato Pole were sandy in structure, whereas the samples taken from the paddy fields varied from clay (flooded soils) to silty-clay (non-flooded samples). Non-flooded soils were characterized by neutral pH values, whereas in the flooded samples, pH varied between 5.77 (C1) and 7.09 (ZP1). The non-flooded soils were significantly more abundant in OM, TN, NH4-N and NO3-N, whereas AP was higher in the flooded paddy fields. In contrast, the flooded area of Zlato pole wetland tended to have low levels of OM, TN, and AP. In general the studied wetland sediments were more typical of natural than of constructed wetlands [Citation31].
Alpha diversity of the bacterial communities
The analysis based on MiSeq Illumina sequencing of the V3–V5 region of the 16S rRNA gene generated 238 239 reads form the flooded area samples and 202 901 reads from the adjacent non-flooded area samples, which were reduced with 3% after removing low-quality sequences. After filtering, and OTU picking process, 181 328 sequences were assigned to taxa from the flooded area samples and 158 260 from the non-flooded samples. The total number of obtained high-quality OTUs per sample was used to calculate the α-diversity indices and the rarefaction curves (). Alpha diversity analyses were further used to determine whether the observed trends were driven by the studied environmental variables. There were evident differences between the reference wetland (ZP) and the paddy fields in terms of Chao1, ACE and Shannon diversity estimators. The rarefaction curves for all indices showed that all samples reached a plateau (Supplemental Figure S1), suggesting that all the diversity was retrieved from the sites. The Tsalapitsa rice paddies soil samples (C) had the steepest rarefaction curves with the highest taxonomic richness (Supplemental Figure S1). The values of the α-diversity indices supported these results: the highest values of ACE and Chao1 indices were in the C2 soil sample and the lowest ones, in the Zlato Pole sediments. There was significant variation between the three sites, both for Chao1 (F = 13.7774; p = 0.0018) and ACE (F = 15.6812; p = 0.0012) richness estimators, but there were no significant differences between the flooded and non-flooded samples (Chao1: F = 1.1766; p = 0.3035; ACE: F = 1.1705; p = 0.3047). Further analysis based on the pairwise comparisons confirmed that the C site had significantly higher Chao1 (p ≤ 0.05) and ACE (p ≤ 0.05) estimates than the P and ZP regions. The Shannon diversity index also varied between wetlands (F = 5.0921; p = 0.0332), with the lowest values established in the ZP1 sample (p ≤ 0.05). The results for Chao1, ACE and Shannon diversity estimators in the rice paddy fields exceed the previously reported values for floodwaters in vegetative and reproductive rice stages [Citation32]. These findings are in agreement with Barber et al. [Citation33], who reported lower diversity in native soils compared to agriculture fields.
Table 2. Number of bacterial taxonomic units recovered from the studied wetlands and diversity indices of 16S rRNA gene relative to each sample.
The ACE, Chao1 and Shannon diversity indices showed correlations with some of the analyzed physicochemical parameters (Supplemental Table S1). There was a strong positive correlation of pH with Chao1 and Shannon (p ≤ 0.01), and a weakly positive correlation with the ACE estimator (p ≤ 0.05). All three indices were weakly negatively correlated with the concentration of AP. There were no significant relationships between α-diversity and organic matter or nitrogen form concentration. In this regard, the increase in α-diversity may be a result of rice cultivation practices, such as fertilization. The provision of otherwise scarce nutrients, like nitrogen and phosphorus, may lead to a fertilization-induced increase in diversity [Citation34].
Beta diversity among the studied areas
A comparison of the community taxonomic patterns based on multivariate analysis showed clear differentiation between the sites. This was also confirmed by NMDS ordinations, which showed separation of the bacterial communities based on soil type and area location (). The permutational MANOVA design test and ANOSIM R values, based on the soil type, wetland type and location, substantiated this result and showed significant differences in the taxa composition between the natural wetland and rice paddies (R = 0.771; p ≤ 0.001), and between the flooded and non-flooded soil samples in the rice paddies (R = 1; p ≤ 0.05). After 10 permutations of random subsampling at each wetland site, the ZP community was consistently found to be significantly distinct from the rice paddies. In contrast, the bacterial assemblages present in the two rice paddies could not be distinguished (ANOSIM, R = 0.065; p = 0.124). The level of dissimilarity of bacterial communities observed in selected areas indicates significant correlations to the biogeochemical parameters in the natural wetland and the paddy fields. Hierarchical clustering based on the taxonomic structure and abundance at the genus level revealed overall differences between the reference Zlato Pole wetland and the seasonally flooded areas (C and P). It differentiated the non-flooded samples, and the flooded samples, with the lowest level of dissimilarity between non-flooded zones of the paddy fields despite their spatial distance (. The bacterial communities in the flooded rice paddies were positioned in a separate cluster. This is often observed in irrigated rice fields [Citation35], and could explain the considerable number of similar bacterial sequences obtained in the present study.
Figure 2. NMDS ordination of Bray–Curtis dissimilarities based upon differences in microbial community structure (A) and hierarchal cluster analysis at the species level (B).
Note: *nat, reference natural wetland Zlato Pole; art, seasonally flooded rice paddies
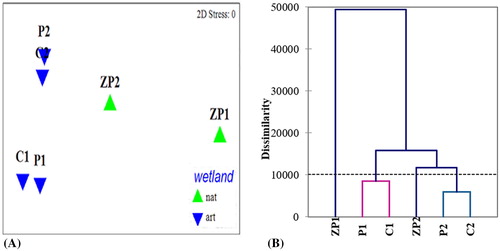
The analysis of the microbiomes in the flooded and non-flooded soils confirmed the hypothesis of Foulquier et al. [Citation36] that the taxonomic composition is highly affected by the hydrological regime. At the time of sampling, the seasonally irrigated soils harbored bacterial communities distinct from those in the permanently flooded wetland (ZP), as well as in the dry soils. This is consistent with other findings that hydrology is one of the main drivers that model the structure of the sediment bacterial populations [Citation37]. Further, the bacterial composition of the sediments and adjacent dry soil consortiums in our study demonstrated that the time (5 months) of sediment submersion is insufficient for convergence of communities between permanently and seasonally flooded soils, despite the notable similarity in the environmental conditions. This contradicts the Rees et al. [Citation38] report that microbial communities in sediments subjected to tow month drought, could fully return to their initial structure one month after rewetting. It is possible for the dry-wet cycle rotation in the paddy fields to act as a physiological stressor for the bacterial communities, due to periodical oxygen depletion and alteration in water potential within the sediments [Citation36].
The sediment samples presented lower concentrations of OM, TN and nitrogen forms than those from the adjacent dry areas. The OM content in non-flooded soils stands out as a key factor shaping the bacterial communities, in contrast to water content in the inundated soils. OM content and soil types have been previously described as major driving factors of microbial community structure in terrestrial ecosystems, ensuring the substrate availability for microorganisms [Citation36,Citation39]. In addition, pH varied between the soil types and had a direct effect on the microbial community structure. The pH proved one of the parameters that could explain the observed higher variation in the community among soil types than study sites, as reported in a number of previous studies [Citation40–42]. The seasonally inundated paddy fields were characterized by an accumulation of available phosphorus, as a result of fertilization [Citation43], and harbored higher bacterial diversity than the ZP1 site (). Hou et al. [Citation44] suggest that paddy-upland reciprocal cultivation is related to rotation of anaerobic and aerobic conditions, affecting the soil C and N cycles. This presumably explains the increase in microbial diversity and suggests that the bacterial diversity in such soils would be higher regardless of the fertilization employed. The results demonstrate that the differentiation in bacterial community compositions of the rice sediments from the adjacent areas and the natural wetland are influenced not only by the flooding but also by the rice production.
Site-specific bacterial community taxonomic composition
The analyzed sequences were distributed among 37 bacterial phyla, with over 97% bacterial sequences classified within only nine of them. The area-specific distribution is presented in the Krona charts (Supplemental Figures S2–S7). The taxonomic composition in the studied sites included some rare and low abundant phyla. The studied communities exhibited taxonomic variation, but were generally dominated by four major phylogenetic groups (Proteobacteria, Actinobacteria, Acidobacteria and Bacteroidetes), accounting for 84.5% of the total number of obtained sequences. The dominant groups are presented in relative abundance >1%). The bacterial communities in the rice paddies sediments were more evenly distributed, whereas the Zlato Pole sediment was the most biased. Proteobacteria was the most diverse phylum across samples, encompassing 34.2% (P1) to 67.7% (ZP1) of all bacterial sequences, followed by Actinobacteria (7.8%-26.3%). Division Proteobacteria has been frequently reported as a dominant in sediments or soils. Proteobacteria are actively involved in the metabolic processes related to global carbon, nitrogen and sulfur cycling in natural and artificial wetlands [Citation10,Citation11,Citation42,Citation45]. The presence of Actinobacteria was also not surprising, as they are reportedly one of the dominant phyla in a number of soils and wetlands [Citation31,Citation46,Citation47]. Acidobacteria (2%-16.9%) was the third dominant phylum, equally abundant in the paddy field sediments. It is considered a sensitive indicator for environmental changes in response to agricultural activities [Citation48], however there were no specific distribution patterns in the distribution of Acidobacteria subgroups. Further, the Pearson correlation analysis demonstrated no significant correlations with environmental factors (p > 0.05) (Supplemental Table S2). The results were inconsistent with the previous report that members of Acidobacteria are pH sensitive and thrive in acidic environments [Citation42]. In contrast, in the ZP1 sample, Firmicutes (9.4%) and Bacteroidetes (8.3%) dominated over Acidobacteria. The abundance of Chloroflexi and Gemmatimonadetes was also significantly higher (p ≤ 0.05) in the sediments from the rice paddies than in the ZP area. Verrucomicrobia and Nitrospirae were relatively evenly distributed among samples. Other universally represented minor taxa included Cyanobacteria, Chlorobi, Saccharibacteria, Planctomycetes and Tectomicrobia, whereas Deinococcus-Thermus phylum was detected primarily in ZP1 sediments. They are typically found in natural and constructed wetlands [Citation10,Citation31,Citation45], paddy fields [Citation35] and other agricultural soils [Citation49].
Figure 3. Abundances at Phylum level (A) and Class level (B) based on MiSeq Illumina sequencing of the V3–V5 region of the 16S rRNA gene in the wetland samples.
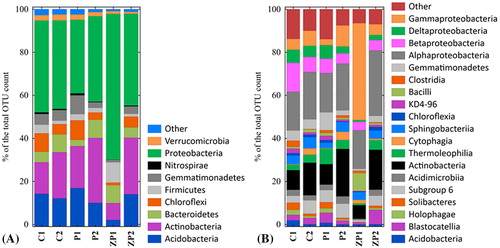
shows the relative abundance in the percentage of bacterial sequences identified at the class level (relative abundance > 1%). In total, 117 bacterial classes were identified, and the abundances of 67 of them were shared between all samples. None of the classes dominated in all communities. Among Proteobacteria phylum, the most abundant classes were Alphaproteobacteria (21.4%), followed by Gammaproteobacteria (12.5%), Betaproteobacteria (6.8%) and Deltaproteobacteria (4%). Alphaproteobacteria and Betaproteobacteria had a more significant contribution to the rice paddies, which is in agreement with previous findings [Citation50]. These taxa are ubiquitous in freshwater sediments, usually correlated with pH and nutrients [Citation13]. Other classes, such as Deltaproteobacteria and Gammaproteobacteria, were represented by a more limited number of sequences compared to other paddy field studies [Citation42]. It has been previously reported that Betaproteobacteria prefer relatively oxygen-rich conditions [Citation32], suggesting that the Tsalapitsa and Plovdiv paddy sediments represented oxic conditions for the bacterial consortium. Moreover, this is supported by the extremely low richness of the Verrucomicrobia phylum than generally observed [Citation13,Citation31], which prefer relatively anoxic conditions [Citation51], and more nitrogen-rich content [Citation52].
By contrast, the microbial consortium in Zlato Pole sediments was characterized by an extremely high abundance of Gammaproteobacteria (45.1%) and Bacilli (Firmicutes). The higher richness of Firmicutes compared to the paddy sediments (p < 0.05) is an indicator of more extreme conditions in the reference wetland. It is consistent with previous observations, and could be explained by their adaptation to thrive in low-nutrient environments through spore-formation [Citation29]. Numerous studies have indicated that Gammaproteobacteria usually thrive in organic-rich environments, such as sites contaminated with agricultural or organic pollution [Citation11,Citation53,Citation54]. They are also involved in reduction processes in anaerobic sediments [Citation10]. Actinobacteria, Acidimicrobia, Acidobacteria subgroup 6, Sphingobacteria and Thermoleophilia, were universally represented. The soils obtained from the non-flooded areas of Zlato Pole wetland, Tsalapitsa and Plovdiv rice paddies displayed higher abundance of Actinobacteria (18.5%, 22%, and 15% respectively) than the samples obtained from the sediments, especially those from ZP1 (6%). Bacilli were ten times more abundant in ZP1 (8.3%) than in the C1 and P1 sediments (0.8%). In addition, some of the minor classes as Deinococci, Flavobacteria and Verrucomicrobiae were presented primarily in the ZP1 community. Others, including Solibacteres, Holophagae, Acidobacteria, Ignavibacteria, etc. were found mainly in the paddy sediments (.
Figure 4. Heatmap analysis of bacterial community at class (total abundance) level (A) and genus (relative abundance >1%) level (B).
Note: *UB, uncultured bacterium.
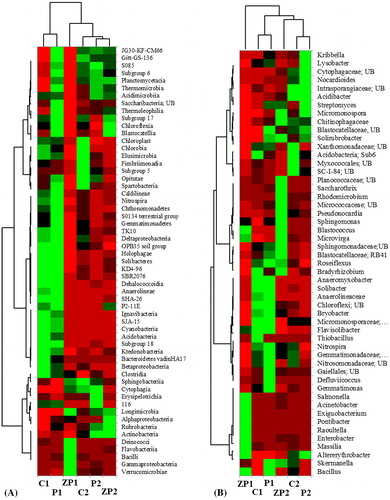
Of the 885 genera identified in the wetland soils, 357 (40.3%) were detected in all samples. Relative abundance >1% was established for only 51 (5.8%) genera, and the majority of identified bacteria were affiliated to rare taxa. Sphingomonas, Nocardioides, Skermanella, Altererythrobacter, Solirubrobacter, Blastococcus and Nitrospira were detected in high numbers in all samples and were similar for both flooded and non-flooded soils (. The dominant bacterial consortium in the Zlato Pole sediments (ZP1) differed significantly and was strongly dominated by Acinetobacter (53.7%), Sphingomonas (7.4%), Exiguobacterium (6.7%), Cloacibacterium (3%), Massilia (1.8%), Microvirga (1.7%) and Pontibacter (1.4%). Acinetobacter, Exiguobacterium, Cloacibacterium and Pontibacter were detected only in the ZP1 sample. The genus Acinetobacter is able to transform nitrogen by heterotrophic nitrification and aerobic denitrification [Citation55]. It is usually positively correlated with nitrate and total nitrogen content [Citation56]. The high Gammaproteobacteria abundance in ZP sediments, despite the lower nutrient concentration and the absence of correlation with the environmental parameters, is evidence of constant anthropogenic pressure around the area. This suggestion is supported by the presence of Deinococcus-Thermus phylum, recognized as one of the most extremophilic bacterial taxa [Citation57]. Other genera identified only in ZP1 include the sanitary-state indicators Enterobacter, Salmonella and Raoultella. The Tsalapitsa and Plovdiv rice paddies sediment communities (C1 and P1) ware characterized by higher diversity compared to ZP1, including microorganisms actively involved in the nitrogen cycle [Citation10], e.g. genera such as Sphingomonas, Gemmatimonas, Bradyrhizobium, Solibacter, Bryobacter, etc., without the presence of a highly pronounced dominant genus (. The non-flooded soils (C2, P2 and ZP2) had a highly similar bacterial consortium composition. The main differences with the sediment communities were not in the dominant complex, but in the higher abundance of area-specific genera such as Micromonospora, Roseiflexus and Acidibacter. Overall, the dominant complex composition showed similar clustering of the soil communities () to that based on the total identified taxa (.
Redundancy analysis
Redundancy analysis (RDA) was applied to differentiate the beta-diversity variation based on the set of physicochemical parameters. It resulted in a model that could explain 70.79% of the total variation of the dominant genera in the bacterial community (). RDA1 was strongly correlated to C1, P1 and ZP1 sediment communities, and RDA2 was associated with the communities from the non-flooded areas (C2, P2 and ZP2). The bacterial communities in C1 and P1 sediments were associated with soil water content and AP concentration, leading to differences in their taxonomic composition from those in the reference wetland, where, by contrast, the community indicated no relation with the analyzed environmental parameters. In contrast, those in the C2, P2 and ZP2 sites were associated with NO3-N, TN and OM. The communities in the areas adjacent to the non-flooded areas at the C2 and P2 sites, and especially at the ZP1 area, were strongly related to OM and TN concentration. The correlation analysis showed that AP was one of the main driving factors in the bacterial communities at the genus level (Supplemental Table S2). Of the dominant genera, Briobacter, Solibacter, Flavisolibacter and the members of family Anaerolineaceae were positively correlated with AP (p ≤ 0.05).
Figure 5. Relationship between the abundance of dominant genera in the bacterial communities and environmental factors in natural and seasonally flooded wetlands.
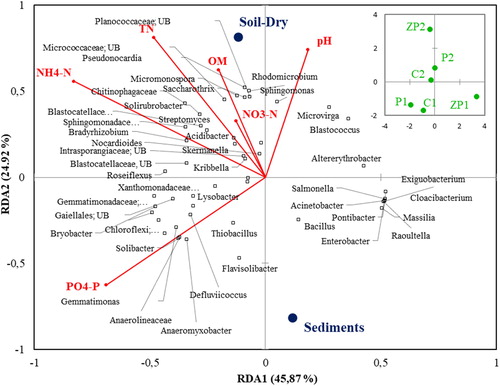
The focus in this study was on near-surface soils, since they are more responsive to land management [Citation58]. We used similar experimental conditions for taxon richness estimation. It is critical for the assessment of the effect of the environmental and spatial variation on the soil bacterial species richness within a given region [Citation59]. The bacterial community structures determined by MiSeq Illumina sequencing showed significant differences between the permanently inundated sediments of the Zlato Pole wetland and the seasonally flooded sediments of the protected area “Orizishta Tsalapitsa”. Multivariate analyses demonstrated that the bacterial communities were separated into three groups, suggesting that wetland type, as well as soil type, are the major factors in determining the bacterial community in Maritsa River Basin wetlands. The dominant complex was clearly linked to the NH4-N, TN and OM content, as reported in a previous study [Citation60]. The soil microbiomes exhibited distinct clustering based on soil type, and land management practice, with paddy field sediment samples clustering together and separately from the adjacent dry soils, and reference wetland sediments, suggesting evidence of a cultivation-specific microbiome, as observed by Lopes et al. [Citation61]. However, since only 70.79% of the total variation of the dominant genera was explained by the RDA, we suggest that there are other factors affecting the bacterial composition in the studied sites, too. Such parameters may include the food web interactions [Citation62], dispersal limitations [Citation63], as well as “top-down” control mechanisms [Citation64].
Conclusions
The present study provides the first detailed analysis of the bacterial diversity in two different wetlands in the Maritsa River Basin, taking into account the effects of the hydrological regime and rice cropping. The bacterial community structures and their differences between natural and seasonally flooded wetlands were clearly distinguished by MiSeq Illumina sequencing. The results revealed a significant difference in the bacterial community structure between the permanently inundated sediments of the Zlato Pole wetland and the seasonally flooded sediments of the protected area “Orizishta Tsalapitsa”. Multivariate analyses suggested that the major factors in determining the bacterial community in Maritsa River Basin wetlands were the type of wetland and the type of soil. The dominant complex was linked to the ammonium nitrogen, total nitrogen and organic matter content. The soil microbiomes clustered based on soil type and land management practice. These observations are important for better understanding the microbial ecology of wetlands, especially considering the water regime as a main driver for the bacterial diversity. The obtained results confirmed the relative importance of environmental parameters on microbial community structure. Nevertheless, further and more detailed study is needed to detect the spatiotemporal patterns of the bacterial communities found in permanently inundated sediments and those found in seasonally dewatered locations.
Supplemental Material
Download PDF (1.6 MB)Disclosure statement
No potential conflict of interest was reported by the authors.
Additional information
Funding
Related Research Data
References
- Stoyneva MP, Michev TM. Inventory of Bulgarian wetlands and their biodiversity. Sofia (Bulgaria): House Svetlostrouy; 2007 (in Bulgarian).
- Kadlec RH, Knight RL. Treatment wetlands.1st ed. Boca Raton (FL): CRC Press; 1996.
- Peralta AL, Matthews JW, Kent AD. Microbial community structure and denitrification in a wetland mitigation bank. Appl Environ Microbiol. 2010;76(13):4207–4215.
- Bodelier PLE, Dedysh SN. Microbiology of wetlands. Front Microbiol. 2013;4:79.
- He S, Malfatti SA, McFarland JW, et al. Patterns in wetland microbial community composition and functional gene repertoire associated with methane emissions. mBio. 2015; 6(3):e00066–15.
- Vassilev V, Vassilev R, Yankov P, et al. National action plan for conservation of wetlands of high significance in Bulgaria (2013–2020). Sofia: Bulgarian Biodiversity Foundation Design and Print by C Print Ltd; 2013.
- EC Directive 2009/147/EC of the European Parliament and of the Council of 30 November 2009 on the conservation of wild birds. Off J Eur Union. 2009;L20:7–25. Available from: eur-lex.europa.eu
- Kögel-Knabner I, Amelung W, Cao Z, et al. Biogeochemistry of paddy soils. Geoderma 2010;157(1–2):1–14.
- Breaux A, Serefiddin F. Validity of performance criteria and a tentative model for regulatory use in compensatory wetland mitigation permitting. Environ Manage. 1999;24(3):327–336.
- Lv X, Yu J, Fu Y, et al. A meta-analysis of the bacterial and archaeal diversity observed in wetland soils. Sci World J. 2014;2014:1.
- Huang W, Chen X, Jiang X, et al. Characterization of sediment bacterial communities in plain lakes with different trophic statuses. Microbiol Open. 2017;6:e503.
- Zinger L, Boetius A, Ramette A. Bacterial taxa–area and distance–decay relationships in marine environments. Mol Ecol. 2014;23(4):954–964.
- Wang Y, Sheng H-F, He Y, et al. Comparison of the levels of bacterial diversity in freshwater, intertidal wetland, and marine sediments by using millions of illumina tags. Appl Environ Microbiol. 2012;78(23):8264–8271.
- Ying T, Wei C. Soil microbiomes – a promising strategy for contaminated soil remediation: a review. Pedosphere. 2019;29(3):283–297.
- Eissler Y, Galvez M-J, Dorator C, et al. Active microbiome structure and its association with environmental factors and viruses at different aquatic sites of a high-altitude wetland. Microbiol Open. 2017;8:e667.
- Molina V, Hernández K, Dorador C, et al. Bacterial active community cycling in response to solar radiation and their influence on nutrient changes in a high-altitude wetland. Front Microbiol. 2016;7:1–15.
- Fierer N. Embracing the unknown: disentangling the complexities of the soil microbiome. Nat Rev Microbiol. 2017;15(10):579–590.
- Luo X, Fu X, Yang Y, et al. Microbial communities play important roles in modulating paddy soil fertility. Sci Rep. 2016;6(1):20326.
- Motsara MR, Roy RN. Guide to laboratory establishment for plant nutrient analysis. Rome (Italy): Fao. 2008.
- Bremner JM, Mulvaney CS. Total nitrogen In: Page AL, Miller RH, and Keeny DR, editors. Methods of soil analysis. Madison: American Society of Agronomy and Soil Science Society of America; 1982. p. 1119–1123.
- Bolger AM, Lohse M, Usadel B. Trimmomatic: a flexible trimmer for Illumina sequence data. Bioinformatics. 2014;30(15):2114–2120.
- Edgar RC. Search and clustering orders of magnitude faster than BLAST. Bioinformatics. 2010;26(19):2460–2461.
- Caporaso JG, Kuczynski J, Stombaugh J, et al. QIIME allows analysis of high-throughput community sequencing data. Nat Methods. 2010;7(5):335–336.
- Quast C, Pruesse E, Yilmaz P, et al. The SILVA ribosomal RNA gene database project: improved data processing and web-based tools. Nucleic Acids Research. 2012;41(D1):D590–D596.
- Ondov BD, Bergman NH, Phillippy AM. Interactive metagenomic visualization in a Web browser. BMC Bioinformatics. 2011;12(1):385.
- Horton DJ, Theis KR, Uzarski DG, et al. Microbial community structure and microbial networks correspond to nutrient gradients within coastal wetlands of the Laurentian Great Lakes. FEMS Microbiol Ecol. 2019;95:fiz033.
- Anderson MJ, Walsh DC. PERMANOVA, ANOSIM, and the Mantel test in the face of heterogeneous dispersions: what null hypothesis are you testing? Ecol Monogr. 2013;83(4):557–574.
- Anderson MJ. A new method for non-parametric multivariate analysis of variance. Austral Ecol. 2001;26(1):32–46.
- Li H, Su J-Q, Yang X-R, et al. Distinct rhizosphere effect on active and total bacterial communities in paddy soils. Sci Total Environ. 2019;649:422–430.
- Sjøgaard KS, Valdemarsen TB, Treusch AH. Responses of an agricultural soil microbiome to flooding with seawater after managed coastal realignment. Microorganisms. 2018;6(1):12.
- Arroyo P, Sáenz de Miera LE, Ansola G. Influence of environmental variables on the structure and composition of soil bacterial communities in natural and constructed wetlands. Sci Total Environ. 2015;506–507:380–390.
- Pittol M, Scully E, Miller D, et al. Bacterial community of the rice floodwater using cultivation-independent approaches. Int J Microbiol. 2018;2018:1.
- Barber N, Chantos-Davidson KM, Peralta RA, et al. Soil microbial community composition in tallgrass prairie restorations converge with remnants across a 27-year chronosequence. Environ Microbiol. 2017;19(8):3118–3131.
- Mackelprang R, Grube AM, Lamendella R, et al. Microbial community structure and functional potential in cultivated and native tallgrass prairie soils of the Midwestern United States. Front Microbiol. 2018;9:1775.
- Schmidt H, Eickhorst T. Spatio-temporal variability of microbial abundance and community structure in the puddled layer of a paddy soil cultivated with wetland rice (Oryza sativa L.). Appl Soil Ecol. 2013;72:93–102.
- Foulquier A, Volat B, Neyra M, et al. Long-term impact of hydrological regime on structure and functions of microbial communities in riverine wetland sediments. FEMS Microbiol Ecol. 2013;85(2):211–216.
- Mentzer JL, Goodman RM, Balser Teri C. Microbial response over time to hydrologic and fertilization treatments in a simulated wet prairie. Plant Soil. 2006;284(1–2):85–100.
- Rees GN, Watson GO, Baldwin DS, et al. Variability in sediment microbial communities in a semipermanent stream: impact of drought. J N Am Benthol Soc. 2006;25(2):370–378.
- Girvan MS, Campbell CD, Killham K, et al. Bacterial diversity promotes community stability and functional resilience after perturbation. Environ Microbiol. 2005;7(3):301–313.
- Griffiths RI, Thomson BC, James P, et al. The bacterial biogeography of British soils. Environ Microbiol. 2011;13(6):1642–1654.
- Thomson BC, Tisseran E, Plassart P, et al. Soil conditions and land use intensification effects on soil microbial communities across a range of European field sites. Soil Biol Biochem. 2015;88:403–413.
- Bai R, Wang J-T, He J-Z, et al. Microbial community and functional structure significantly varied among distinct types of paddy soils but responded differently along gradients of soil depth layers. Front Microbiol. 2017;8:945.
- Kong AYY, Six J, Bryant DC, et al. The relationship between carbon input, aggregation, and soil organic carbon stabilization in sustainable cropping systems. Soil Sci Soc Am J. 2005;69(4):1078–1085.
- Hou P-F, Chien C-H, Chiang-Hsieh Y-F, et al. Paddy-upland rotation for sustainable agriculture with regards to diverse soil microbial community. Sci Rep. 2018;8(1):7966.
- Peralta AL, Ludmer S, Kent AD. Hydrologic history influences microbial community composition and nitrogen cycling under experimental drying/wetting treatments. Soil Biol Biochem. 2013;66:29–37.
- Schrempf H. Actinobacteria within soils: capacities for mutualism, symbiosis and pathogenesis. FEMS Microbiol Lett. 2013;342(2):77–78.
- Ansola G, Arroyo P, Sáenz de Miera LE. Characterization of the soil bacterial community structure and composition of natural and constructed wetlands. Sci Total Environ. 2014;473–474(2014):63–71.
- Navarrete AA, Venturini AM, Meyer KM, et al. Differential response of Acidobacteria subgroups to forest-to-pasture conversion and their biogeographic patterns in the Western Brazilian Amazon. Front Microbiol. 2015;6:1443.
- Fierer N, Leff JW, Adams BJ, et al. Cross-biome metagenomic analyses of soil microbial communities and their functional attributes. Proc Nat Acad Sci. 2012;109(52):21390–21395.
- Lüdemann H, Arth I, Liesack W. Spatial changes in the bacterial community structure along a vertical oxygen gradient in flooded paddy soil cores. Appl Environ Microbiol. 2000;66:754–762.
- Eilers KG, Debenport S, Anderson S, et al. Digging deeper to find unique microbial communities: the strong effect of depth on the structure of bacterial and archaeal communities in soil. Soil Biol Biochem. 2012;50:58–65.
- Hester ER, Harpenslager SF, Jmh V. D., et al. Linking nitrogen load to the structure and function of wetland soil and rhizosphere microbial communities. bioRxiv. 2017:197855.
- Beardsley C, Moss S, Malfatti F, et al. Quantitative role of shrimp fecal bacteria in organic matter fluxes in a recirculating shrimp aquaculture system. FEMS Microbiol Ecol. 2011;77(1):134–145.
- Kunihiro T, Takasu H, Miyazaki T, et al. Increase in Alphaproteobacteria in association with a polychaete, Capitella sp I, in the organically enriched sediment. ISME J. 2011;5(11):1818–1831.
- Yao S, Ni J, Ma T, et al. Heterotrophic nitrification and aerobic denitrification at low temperature by a newly isolated bacterium, Acinetobacter sp. HA2. Bioresour Technol. 2013;139:80–86.
- Ma X, Song X, Li X, et al. Characterization of microbial communities in pilot-scale constructed wetlands with Salicornia for treatment of marine aquaculture effluents. Archaea. 2018;2018:1.
- Theodorakopoulos N, Bachar D, Christen R, et al. Exploration of deinococcus-thermus molecular diversity by novel group-specific PCR primers. Microbiol Open. 2013;2(5):862–872.
- Zhang XX, Zhang RJ, Gao JS, et al. Thirty-one years of rice-rice-green manure rotations shape the rhizosphere microbial community and enrich beneficial bacteria. Soil Biol Biochem. 2017;104:208–217.
- Chen Y, Kuang J, Jia P, et al. Effect of environmental variation on estimating the bacterial species richness. Front Microbiol. 2017;8:690.
- Ahn C, Peralta RM. Soil bacterial community structure and physicochemical properties in mitigation wetlands created in the Piedmont region of Virginia (USA). Ecol Eng. 2009;35(7):1036–1042.
- Lopes AR, Manaia CM, Nunes OC. Bacterial community variations in an alfalfa-rice rotation system revealed by 16S rRNA gene 454-pyrosequencing. FEMS Microbiol Ecol. 2014;87(3):650–663.
- Kent AD, Jones SE, Yannarell AC, et al. Annual patterns in bacterioplankton community variability in a humic lake. Microb Ecol. 2004;48(4):550–560.
- Ferrenberg S, O'Neill S, Knelman JE, et al. Changes in assembly processes in soil bacterial communities following a wildfire disturbance. ISME J. 2013;7(6):1102–1111.
- Allen B, Willner D, Oechel WC, et al. Top-down control of microbial activity and biomass in an Arctic soil ecosystem. Environ Microbiol. 2010;12(3):642–648.