
Abstract
Genes in the carbonic anhydrase (CA) family encode zinc metalloenzymes that catalyze the reversible interconversion of carbon dioxide and water to bicarbonate and protons. Although CAs play key roles in diverse biological processes involving carboxylation and decarboxylation, including photosynthesis and respiration, plant growth and response to stress, the characteristics of CA gene family members in tomato remain unclear. In this study, we performed an exhaustive search of the tomato genome and accordingly identified 14 CA genes that are unevenly distributed on the 12 tomato chromosomes. We examined in detail the structures, conserved motifs, phylogenetic relationships and duplications of these genes, and for functional characterization, also undertook RNA-seq analyses to assess the transcript levels of CA genes in various tissues and organs and at different developmental stages. Furthermore, we investigated the expression patterns of the CA genes in response to salt stress. We found that some family members exhibited tissue-specific expression, whereas others were more ubiquitously expressed. Our results will provide a valuable foundation for further studies on the CA genes in tomato and other plants in the Solanaceae family.
Introduction
Carbonic anhydrases (CAs) comprise a family of zinc metalloenzymes that are widely distributed amongst organisms, including fungi, bacteria, algae, animals and higher plants. These enzymes catalyze the reversible interconversion of carbon dioxide (CO2) and water to bicarbonate and protons and in plants are characterized by a high conversion efficiency of 100,000 CO2 molecules per second that regulates the concentration of CO2 in the vicinity of photosynthetic enzymes [Citation1].
CAs participate in most biochemical reactions involving carboxylation and decarboxylation, including photosynthesis and respiration. Moreover, studies have shown that these enzymes are also involved in pH regulation, inorganic carbon transport, ion transport and water and electrolyte balance processes [Citation2,Citation3]. In the leaves of higher plants, CAs are amongst the most abundant proteins, accounting for 1% to 20% of total soluble plant protein and are second in abundance only to Ribulose-1,5-bisphosphate carboxylase/oxygenase (RuBisCO), which comprises approximately 30% of proteins [Citation4,Citation5]. CAs not only ensure the efficiency of the conversion of HCO3- to CO2 but also participate in the transfer of exogenous inorganic carbon to the periphery of RuBisCO in the chloroplast matrix [Citation4]. Furthermore, studies have demonstrated that the presence of CA on either side of artificial membranes can facilitate the rapid trans-membrane diffusion of CO2 [Citation6].
To date, it has been found that all known CAs in animals belong to the α-clade, whereas higher plants and algae contain CAs belonging to the α, β and γ clades. However, although all CA families contain zinc, they appear to have evolved independently [Citation7,Citation8]. The model plant Arabidopsis thaliana contains 19 CAs (8 αCAs, 6 βCAs, and 5 γCAs), among which only αCA1-3 are expressed in leaves [Citation9]. αCA1 protein is located in the Golgi apparatus membrane and, with the exception of roots, the αCA1gene is expressed in all plant parts [Citation3,Citation10]. The induction of CA1 expression at low CO2 concentrations has been found to promote the balance between CO2 and HCO3-, thereby facilitating the diffusion of CO2 across the cell membrane and thus providing inorganic carbon for photosynthesis [Citation11]. Consistently, silencing of the αCA1 gene has been demonstrated to reduce photosynthetic activity and starch accumulation in Arabidopsis mutants [Citation9]. αCA4 is located in the thylakoid membranes and affects the activity of the external light harvesting antenna complexes [Citation12,Citation13], whereas CA6 is mainly located around the pyrenoids and may be involved in the incorporation of CO2 into bicarbonate, thereby increasing the concentration of HCO3- in the cytoplasmic matrix and thus ensuring the retention of inorganic carbon within the chloroplasts [Citation14]. However, the functions of other αCAs have yet to be determined.
Compared with the αCAs, the βCA family has been more extensively studied in higher plants, and these enzymes have been found to play key roles in C4-type photosynthesis [Citation15]. C3 plants contain orthologs of the C4 cytosolic βCA genes, which are involved in most physiological responses. In C3 plants, βCA1 and βCA5 are located in chloroplasts, βCA2 and βCA3 in the cytosol, βCA4 in the plasma membrane and βCA6 in the mitochondria [Citation5,Citation16]. βCAs maintain the concentration of CO2 in the vicinity of RuBisCO, promote the diffusion of CO2 through the chloroplast membrane, rapidly remove HCO3- ions and release CO2 [Citation6]. βCA1 and βCA4 have also been implicated in the control of gas exchange via the regulation of stomatal movement or by acting in conjunction with Epidermal Pattering Factor 2 (EPF2) to control stomatal development [Citation16,Citation17]. Early studies on AtCAs indicated that βCA1 and βCA5 are involved in CO2 sensing [Citation16]. Overexpression of βCA6 has been demonstrated to increase fresh and dry weights and the area of rosettes leaves and is also found to reduce respiratory rate [Citation5]. Further studies have shown that CAs facilitate the exploitation of soil HCO3- as a substrate for photosynthesis in leaves. βCAs are involved in the absorption of soil HCO3- ions by roots and the regulation of plant growth and cell death homeostasis in response to light stress [Citation5]. Members of the third group of CAs, the γCAs, are located in the mitochondria and have been shown to be involved in the assembly of respiratory chain complex I, as well as photorespiration and plant reproductive development [Citation18,Citation19].
Tomato (Solanum lycopersicum) is one of the most economically important vegetables cultivated worldwide, owing to its high yields and high quality. Whole-genome sequencing of the tomato cultivar “Heinz 1706” by the Tomato Genome Consortium has facilitated the genome-wide identification and functional analysis of gene families related to the morphological diversity and agronomic traits of tomato. As a model plant for fruit research, tomato is also an important resource for the development of genetically improved solanaceous crops.
Given the significance of CA genes in various biological and physiological processes, including photosynthesis and respiration, we conducted a genome-wide analysis to identify CA proteins in tomato. We undertook an in-depth investigation of the chromosomal gene locations, gene structures, conserved motifs and phylogenetic relationships of the CA genes and subsequently conducted a comprehensive analysis of the specific expression of CA genes in tomato tissues and organs. Furthermore, we examined the expression patterns of these genes in response to salt stress. Our results provide a framework for the further study of CA genes and lay a foundation for the genetics-based breeding of new high-yielding tomato varieties with highfruit quality and stress resistance.
Materials and methods
Identification of CA genes in tomato
We extracted all the currently available AtCA protein sequences from the Arabidopsis Information Resource (TAIR) Database (http://www.Arabidopsis.org/, Release 10), whereas OsCA protein sequences were downloaded from the Rice Genome Database (http://rice.plantbiology.msu.edu/). These protein sequences were used as queries to perform BLASTP searches in the tomato plant GDB (http://www.plantgdb.org), Solanaceae Genomics Network Database (http://www.sgn.cornell.edu, ITAG v3.2), and NCBI Conserved Domain databases (https://www.ncbi.nlm.nih.gov/cdd), using an E-value ≤10−60, which in turn locks the tomato CA family members. We also performed CA domain searches in the Ensembl Plant (http://plants.ensembl.org/index.html) and Uniprot databases (https://www.uniprot.org/) in order to identify CA family members. A further search for Carb_anhydrase (PF00194) was carried out based on Hidden Markov Model (HMM) analysis using the HMMER 3.0 program under default parameters [Citation20]. All of the putative CA protein sequences were examined using the online tool InterPro program (http://www.ebi.ac.uk/interpro/), the Pfam Database (http://www.sanger.ac.uk/software/pfam) [Citation21], and the Simple Modular Architecture Research Tool (SMART) (http://smart.embl-heidelberg.de) [Citation22] to confirm the presence of Carb_anhydrase (PF00194). We accordingly obtained 14 CA sequences, among which there were six αCAs, four βCAs, and four γCAs. These genes were named Solanum lycopersicum carbonic anhydrase (SlCA) genes and denoted according to their positions on tomato chromosomes and their Arabidopsis homologs. In cases in which we identified more than one paralog of the same AtCA gene, a suffix was added after SlCA based on E value levels. The SlCA genes were further used as query sequences to search for members of CA gene families in two further plants in the family Solanaceae, namely, potato (Solanum tuberosum) and tobacco (Nicotiana benthamiana), using the SGN and NCBI databases.
Chromosomal locations, gene structures, conserved motifs, protein domains and phylogenetic analysis of tomato CA family members
We downloaded the tomato genome annotation file ITAG3.2_gene.GFF from the SGN Database and prepared schematic diagrams of the structures of SlCAgenes using the TBtool [Citation23]. The online software MEME (http://meme-suite.org/tools/meme) was used to identify the conserved motifs of the SlCA protein sequences, setting the maximum number of motifs at 20. The positional information, transcriptional direction, and sequences of all SlCA genes within the S. lycopersicum chromosomes were obtained from the SGN Database, whereas all SlCA protein sequences that satisfied the requirements were analyzed using the Pfam, SMART, and Conserved Domain NCBI Database to eliminate redundant sequences.
Comparative analyses of the multiple sequence homology of SlCA proteins were performed using the online tool Clustal Omega (https://www.ebi.ac.uk/Tools/msa/clustalo/), with default parameter settings [Citation24,Citation25]. Evolutionary histories were inferred using the Maximum Likelihood method based on the JTT matrix-based model [Citation26]. The tree with the highest log likelihood (–24,115.38) is shown herein. Initial trees for the heuristic search were obtained automatically by applying the Neighbor-Joining and BioNJ algorithms to a matrix of pairwise distances estimated using a JTT model and then selecting the topology with superior log likelihood values. The tree is drawn to scale with branch lengths measured in the number of substitutions per site. Evolutionary analyses were conducted using MEGA X [Citation27].
Gene duplication analysis and Ka/Ks calculation
Tandem duplications and whole-genome duplication (WGDs/segmental) of the SlCAs were subsequently examined based on a phylogenetic analysis of homologous genes and chromosomal location information via TBtool [Citation23]. A sequence similarity among genes greater than 90% was considered to be indicative of a segmental duplication, whereas five or fewer genes within a 100-kb region were regarded as tandem duplications events [Citation28,Citation29]. Similarly, TBtool was used to estimate synonymous (Ks) and non-synonymous (Ka) substitution rates [Citation23].
Prediction of the subcellular localization of SlCA proteins
Subcellular locations of the SlCA proteins were predicted using the online tool WoLF PSORT (https://wolfpsort.hgc.jp/), with all amino acid sequences being input using the fasta format.
Expression analysis of SlCA genes based on RNA-Seq data
Expression profiles of the SlCA genes were obtained from the published RNA-seq data in the Tomato Functional Genomics Database (http://ted.bti.cornell.edu/). The locus/gene names were used as queries to obtain data from various tissues in the tomato cultivar “Heinz 1706” (S. lycopersicum) and wild species LA1598 (Solanum pimpinellifolium).
Salt stress assay
In this study, we used the tomato cultivar “micro-TOM” to analyze the patterns of SlCA gene expression in response to salt stress. Micro-TOM plants were grown in an illuminated incubator at 25 °C/20 °C under a 16 h/8 h (light/dark) photoperiod until the seedlings had produced a third euphylla. The seedlings were then grown for a week at 25 °C/20 °C under a 12 h/12 h (light/dark) photoperiod in Yamazaki nutrient solution [consisting of Ca(NO3)2·4H2O, 354 mg/L; KNO3, 404 mg/L; NH4H2PO4, 77 mg/L; MgSO4·7H2O, 246 mg/L; H3BO3, 2.86 g/L; MnSO4·4H2O, 2.13 g/L; ZnSO4·7H2O, 0.22 g/L; CuSO4·5H2O, 0.08 g/L; (NH4)2MoO4, 0.02 g/L; FeSO4·7H2O, 37.2 g/L and Na2-EDTA, 27.8 g/L], during which time they were subjected to different salt stress treatments.
As salt treatments, the nutrient solution was supplemented with 50, 75, or 100 mM NaCl. Seedlings grown in nutrient solution without NaCl supplementation served as controls. Plant tissues for RNA isolation were collected at 0, 3, 5, 7 and 9 days after treatment, immediately frozen in liquid nitrogen and stored at –80 °C until use.
Expression profiles of CA genes in tomato
Total RNA was extracted using a TRIzol Reagent Kit (Tiangen, China) according to the manufacturer’s instructions. The quality of isolated total RNAs was assessed electrophoretically (using agarose gel) and spectrophotometrically (OD260/OD280). Reverse transcription reactions were performed using a PrimeScript™ RT reagent kit with gDNA Eraser (Perfect Real Time) (Takara, Japan) as directed by the manufacturer. The primers used for amplification were designed using Primer premier version 6 (), and synthesized by Sangon Biotech (Shanghai, China). Quantitative real-time PCR was performed using a SYBR Green PCR Master Mix (Tiangen, China). An ABI 7500 Sequence Detection System and Software (Applied Biosystems) were used for qRT-PCR analysis. Amplification was initiated with a 30-s denaturation step at 95 °C, followed by 40 cycles of 95 °C for 15 s, 60 °C for 15 s and 72 °C for 30 s. All reactions were performed in triplicate, and negative controls (no template and no reverse transcriptase) were included for each gene. The specificity of the reactions was verified by melting curve analysis.
Table 1. Primers used for qRT-PCR assays.
Analysis of cis-regulatory elements in the promoter of SlCA genes
We denoted the 2-kb sequence upstream of the ATG start codon of each SlCA gene as the promoter sequence. These sequences were downloaded from the SGN Database, and then submitted to the PlantCARE Database (http://bioinformatics.psb.ugent.be/webtools/plantcare/html/) for cis-regulatory element prediction [Citation30].
Results and discussion
Identification of CA gene family members in tomato
On the basis of BLAST searches against the sequences of 19 AtCA and 26 OsCA genes obtained from the SGN and NCBI databases and subsequent HMMER analysis, we identified a total of 14 CA genes in tomato. These SlCA genes (six αSlCAs, four βSlCAs, and four γSlCAs) were named according to their homologs in Arabidopsis.
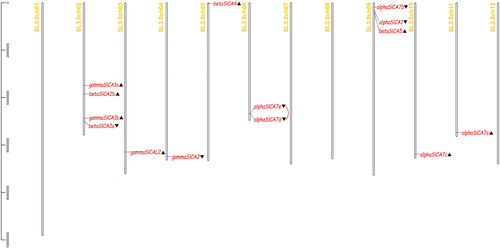
The SlCAs were found to be distributed on eight of the 12 tomato chromosomes, with most being located on the 2nd and 9th chromosomes. The chromosomal positions of the 14 SlCAs were assigned based on the SGN and NCBI databases (). The open reading frames of the SlCAs are approximately 713 bp to 965 bp in length and encode small protein polypeptide fragments ranging in size from 237 (βSlCA5) to 321 (βSlCA2a) amino acids. On the basis of our subcellular localization predictions, the SlCAs have a broad cellular distribution, with sites including the plasma membrane, tonoplast, chloroplast and mitochondrion (Supplementary material Table S1). Furthermore, we found that αSlCAs are distributed on chromosomes 6, 9 and 11; βSlCAs—on chromosomes 2, 5 and 9 and γSlCAs - on chromosomes 2, 3 and 4. Among the six αSlCAs, αSlCA7e/7d on chromosome 6 are closely linked forming a tandem repeat. No SlCAs were detected on chromosomes 1, 7, 8 or 10.
Figure 1. Distribution of the 14 Solanum lycopersicum carbonic anhydrase (SlCA) genes on tomato chromosomes. Note: ▲ denotes reverse transcription and ▼ denotes forward transcription. The red line indicates a tandem repeat.
Gene structure, motif recognition, and phylogenetic analyses
In order to comprehensively assess the phylogenetic relationships among the SlCA genes, we generated a diagram showing an unrooted tree, conserved motifs and gene structures drawn using TBtool ().
Figure 2. Phylogenetic tree, conserved motifs and gene structures of Solanum lycopersicum carbonic anhydrases (SlCAs). Note: The evolutionary history of the SlCA genes was inferred using the Maximum Likelihood method based on the JTT matrix-based model (left). The tree is drawn to scale, with branch lengths measured in terms of the number of substitutions per site. Evolutionary analyses were conducted using MEGA X. To the right of the tree are schematic representations of the conserved motifs in SlCA proteins identified using MEME (center). The non-conserved sequences are indicated by gray lines, and each motif is indicated by a different colored box. Each of the three sub-clades of CA proteins contains similar conserved motifs. Gene structure of SlCAs (right). The gray lines, green boxes, and other colored boxes represent introns, UTR regions, and exons, respectively. The figure also shows the CA protein domains.
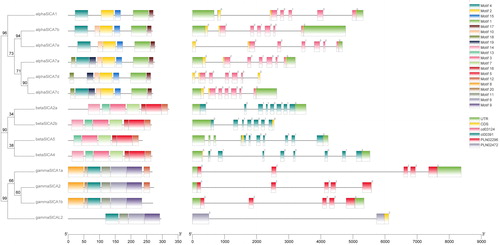
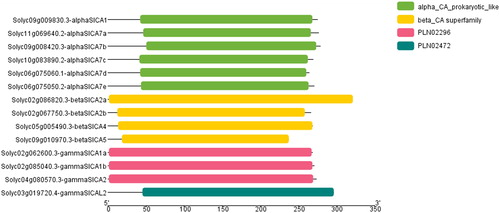
We found that all the detected SlCA genes contain introns and that the βSlCA and γSlCAs genes contain the highest (11) and the lowest (2) number of exons, respectively (). Furthermore, we observed that intron insertion positions in SlCAs in the different sub-clades are relatively conserved, thereby implying a reasonably close evolutionary relationship. To analyze the conserved domains, all the amino acid sequences of SlCAs were uploaded into the NCBI Conserved Domain Database. All three clades of SlCA proteins contain a typical CA domain ().
Figure 3. The conserved domains of Solanum lycopersicum carbonic anhydrase (SlCA) proteins. Note: The non-conserved sequences are represented by gray lines and the CA domains are represented by colored bars. The PLN02296 and PLN2472 domains are found in the γ-CAs.
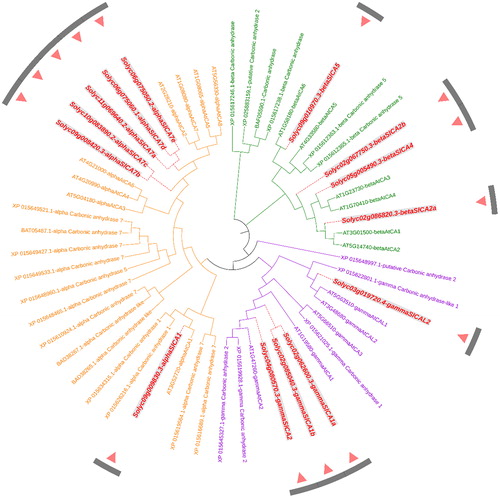
In order to gain a better understanding of the phylogenetic relationships among CA genes in Arabidopsis, rice and tomato, we constructed an unrooted tree based on an alignment of the amino acid sequences of 19 AtCA, 26 OsCA and 14 SlCA proteins using the software ClustalX and MEGA X (). These CA family members could be divided into the aforementioned three typical clades, namely, α, β and γ. Among these, the α-clade includes six SlCAs (αSlCA1 and αSlCA7a-e), the β-clade includes four SlCAs (βSlCA2a/2b, βSlCA4, and βSlCA5) and the γ-clade includes four SlCAs (γSlCA1a/1b, γSlCA2, and γSlCAL2).
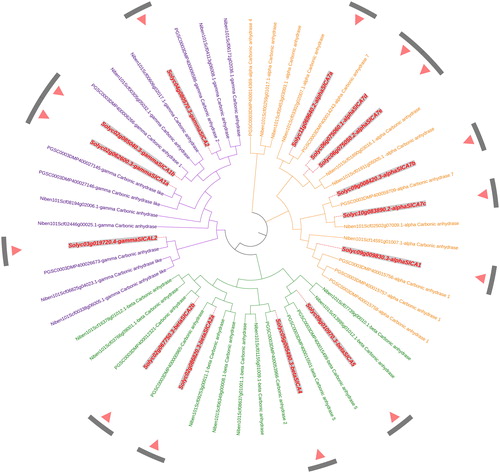
Figure 4. An unrooted phylogenetic tree of carbonic anhydrase proteins in tomato, rice and Arabidopsis. Note: The tree was constructed with MEGA X software using the Maximum Likelihood method based on a JTT matrix-based model. The α, β, and γ clades are shown in orange, green and purple, respectively. All the Solanum lycopersicum carbonic anhydrase (SlCA) proteins are shown in red.
Using the tomato CA protein sequence as query sequences, we performed a BLASTP search of the Solanaceae SGN Database and accordingly identified 16 and 24 CAs in potato (Solanum tuberosum) and tobacco (N. benthamiana), respectively. An unrooted tree was constructed using MEGA X and as shown in , all the CAs clustered into the three typical clades.
Figure 5. An unrooted phylogenetic tree of carbonic anhydrase protein sequences in tomato, potato, and tobacco. Note: The phylogenetic tree was constructed with MEGA X software using the Maximum Likelihood method according to the JTT matrix-based model. The α, β, and γ clades are shown in orange, green, and purple, respectively. All the Solanum lycopersicum carbonic anhydrase (SlCA) proteins are shown in red.
Analysis of SlCA duplication
During the course of evolution, replicating genes can undergo one of three potential evolutionary fates: non-functionalization, neo-functionalization and sub-functionalization. When comparing the substitution rate (Ka/Ks) of non-synonymous (Ka) and synonymous (Ks) substitutions, the magnitude of selective constraints and positive selection can be inferred. In general, Ka/Ks > 1, Ka/Ks = 1 and Ka/Ks < 1 indicate positive selection, neutral evolution and purification selection, respectively.
Among the 14 SlCA genes distributed on eight of the 12 tomato chromosomes, we identified seven pairs of genes that exhibited whole-genome duplication/segmental duplication, namely αSlCA7a/αSlCA7e, αSlCA7b/αSlCA7c, βSlCA2a/βSlCA2b, βSlCA2a/βSlCA4, γSlCA1a/γSlCA1b, γSlCA1a/γSlCA2 and γSlCA1b/γSlCA2 (). Estimates of the Ka, Ks and Ka/Ks values of these SlCA pairs are shown in . We found that the Ka/Ks ratios of the SlCA homologous pairs were all less than 0.4, with that of one homologous pair being less than 0.1, indicating that these SlCA genes have undergone purification selection following segmental and genome-wide duplications.
Figure 6. Chromosomal distribution and synteny analysis of the Solanum lycopersicum carbonic anhydrase (SlCA) genes. Note: The curved yellow bars represent the chromosome as indicated. Gene IDs are based on gene positions on the chromosomes. Putative whole-genome duplications are indicated by gray lines and segmentally duplicated genes are indicated by red lines.
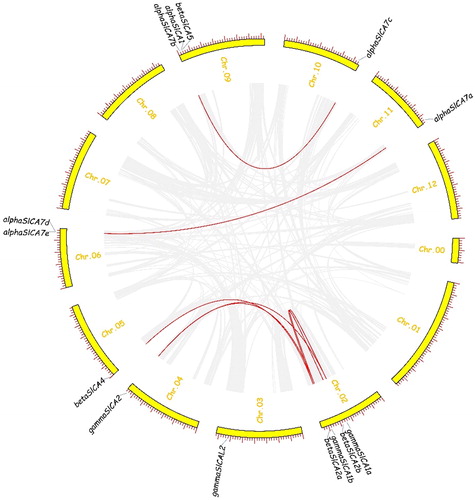
Table 2. Comparative analysis of the Ka, Ks, and Ka/Ks values of Solanum lycopersicum carbonic anhydrase (SlCA) genes.
Cis-regulatory elements in the promoters of SlCA genes
For our analysis of the cis elements in the promoters of SlCA genes, we obtained the promoter sequences of the 14 SlCA genes from the SGN Database and identified the cis-regulatory elements using PlantCARE. We accordingly detected 38 cis elements in the SlCA promoters, of which 23, 9 and 6 are involved in light responsiveness, hormonal responses and environmental responses, respectively (Supplementary material Table S2). These results thus indicate that the SlCA genes may play key roles in photosynthesis and stress response.
Expression patterns of CA genes in cultivated and wild tomatoes
Digital expression analysis (or RNA-seq transcriptome sequencing) is a powerful and efficient method for large-scale analyses of gene expression [Citation31]. In the present study, we obtained gene expression profiles by analyzing RNA-seq transcriptome sequencing data based on gene name or locus. We examined the expression patterns of CA genesin Heinz 1706 (S. lycopersicum) and the wild tomato LA1589 (S. pimpinellifolium) based on data available in the public databases (http://ted.bti.cornell.edu/cgi-bin/TFGD/digital/home.cgi).
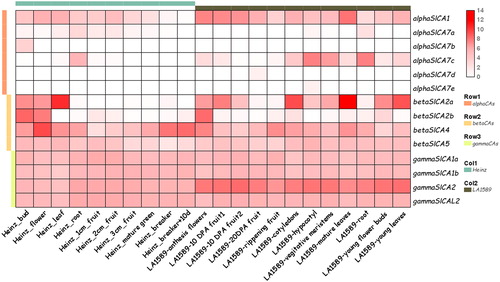
As shown in , compared to βSlCAs and γSlCAs, αSlCA genes were expressed in low amounts in tomato. Furthermore, we found that the expression level of αSlCA1 in Heinz1706 was lower than that in wild tomato LA1589. In LA1589, αSlCA7c was highly expressed in hypocotyls and roots, whereas in Heinz1706, it was only highly expressed in roots. The expression levels of βSlCAs were observed to differ according to tissue type, among which βSlCA2a showed high expression levels in the leaves and cotyledons of both tomato species, whereas βSlCA2b and βSlCA4 were mostly expressed in flowers and buds. In contrast, there were no significant differences in the expression levels of γSlCAs in the various parts of the two tomato varieties.
Figure 7. Expression patterns of Solanum lycopersicum carbonic anhydrase (SlCA) genes in different tissues of S. lycopersicum (Heinz1706) and S. pimpinellifolium (LA1589). Note: The row data for RNA-seq were obtained from a public database and analyzed using TBtools. The expression levels of SlCA genes are shown in terms of RPKM values. The expression values were mapped using a color gradient from low (white) to high (red). The α, β, and γ clades are indicated by pink, orange and yellow bars, respectively. Heinz 1706 is indicated by a cyan bar, and LA1589 is indicated by a gray bar.
Expression analyses of SlCAs in micro-TOM in response to salt stress
The RNA-seq data revealed that SlCAgenes are expressed at higher levels in the leaves of S. lycopersicum and S. pimpinellifolium, indicating that these genes may play an important role in photosynthesis in tomato plants. To further examine the expression pattern of SlCAs under adverse conditions, we subjected micro-TOM seedlings to different concentrations of NaCl.
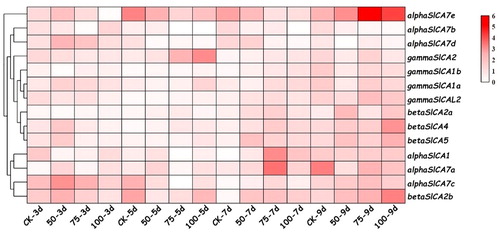
Heatmap data analyses revealed a high variability in the transcript abundance of the SlCA genes in tomato in response to salt stress (). We observed that αSlCA1 and αSlCA7a exhibited similar expression patterns, which were higher in the late stage of salt treatment, with the highest value being recorded after 7 days in seedlings treated with 75 mM NaCl. The expression levels of αSlCA7b,7d and all γSlCA genes, with the exception ofγSlCA2, were low and did not change significantly over the course of the treatment period. The expression levels of αSlCA7c and βSlCA2b were higher in the early and late stages of treatment than during the intermediate period, and the expression levels of αSlCA7c and βSlCA2b were highest in response to treatment with 50 and 100 mM NaCl after 3 and 9 days, respectively. αSlCA7e was highly expressed in both the early stage of treatment in response to a low NaCl concentration and in the late stage of treatment in response to a high NaCl concentration, with the highest expression level being detected on day 9 in response to treatment with 75 mM NaCl. The expression level of βSlCA2a was generally low, but relatively higher during the late stage of salt treatment. Similarly, βSlCA4 and βSlCA5 showed higher expression in the late stage of treatment, with the highest levels being detected in seedlings exposed to 100 mM NaCl for 9 days. These results accordingly indicate that members of the SlCA gene family may play important roles in responding to salt stress.
Figure 8. Expression patterns of Solanum lycopersicum carbonic anhydrase (SlCA) genes in leaves of the cultivar micro-TOM in response to different salt treatments. Note: As salt treatments, seedlings were grown in nutrient solution containing 0 (control), 50, 75, or 100 mM NaCl, and samples were collected for analysis at 0, 3, 5, 7 and 9 days after the initiation of treatment. The cluster analysis heat map was drawn using TBtools. The expression levels of the SlCA genes are presented as fold-change values converted to the Log2 format. The data represent the relative expression levels normalized to that of the housekeeping gene Actin2 and are the mean values of three independent biological repetitions. The expression values were mapped using a color gradient from low (white) to high (red).
In concert with the continual rise in global temperatures, the concentrations of atmospheric CO2 are gradually increasing, and this will in turn have certain repercussions on the photosynthesis of plants. Previous studies have shown that the difference in photosynthesis between C3 and C4 plants may be of considerable significance. Given that in C4 plants, CO2 is concentrated in the vicinity of the RuBisCO enzyme, the light respiration of C4 plants is limited compared to that of C3 plants, and accordingly, C4 plants can attain higher biomass yields and utilize water and nitrogen more efficiently [Citation32,Citation33]. In model plants such as Arabidopsis, CA enzymes catalyze the reversible interconversion of CO2 to HCO3- and regulate CO2 homeostasis. Studies have shown that CAs are localized in the mesophyll cell cytoplasm of both C3 and C4 plants, and that they play key roles in plant growth and development [Citation6,Citation34,Citation35].
Globally, tomato is one of the most economically important vegetables and is also an extensively studied model plant. Accordingly, in-depth studies of the roles of CAs in tomato can provide potentially new insights for the selection and breeding of excellent tomato varieties. Whole-genome sequences can be used as an effective tool to investigate and identify gene families, analyze genetic relationships and determine gene distributions across chromosomes. In this regard, the availability of high-quality sequence data from the S. lycopersicum “Heinz 1706” genome has made a considerable contribution to the study of tomato.
In the present study, we aimed to characterize the carbonic anhydrase family of genes in tomato and accordingly identified 14 CA genes via BLAST searches and HMMER analysis. Of these 14 genes, we found that six, four and four were classified in the α, β and γ clades, respectively (Supplementary material Table S1). These S1CA genes were subjected to bioinformatics analyses, including determinations of chromosomal location, gene structure, conserved motifs, phylogenetic evolution and subcellular localization prediction. The 14 SlCA genes were named based on the e value of their homologous genes in Arabidopsis and were mapped on chromosomes 2, 3, 4, 5, 6, 9, 10, and 11. Among these, the ΑSlCA7e/7d pair were closely linked as a tandem repeat on chromosome 6 (). All the SlCA protein sequences were found to contain a typical CA domain characterized by Zn-liganded histidine residues ( and ). The predicted subcellular localizations of SlCA proteins are diverse and include chloroplastic, endoplasmic reticular, cytosolic, extracellular, vacuolar and mitochondrial inner membrane sites. Among the identified genes, the γ-clade members are mainly present in mitochondria. With the exception of ΑSlCA1, 7a, 7b and 7e, most of the SlCA proteins lack a transmembrane domain, suggesting that these SlCAs may act primarily on the membrane surface. Consistently, previous studies have shown that αCA1 is located on the Golgi membrane and that the αCA1 gene is expressed in all parts of the plant except the roots [Citation3,Citation10].
On the bases of our analyses of phylogeny, gene structure and conserved motifs, we were able to establish that the different clades of SlCA genes have remained relatively independent in evolutionary terms. Studies to date have also shown that all animal CAs belong to the αCA clade, whereas those of higher plants and algae are distributed among the three major α, β and γ clades. Moreover, although the members all CA families contain zinc, these families appear to have evolved independently [Citation7,Citation8]. Our phylogenetic analysis revealed that the 16 SlCA genes, together with other well-studied CAs from Arabidopsis and rice were divided into the aforementioned three major clades, and that the SlCAs grouped with AtCAs and OsCAs in each clade (), indicating a close relationship between the CAs of these three species, and that these proteins have been highly conserved across lineages.
Plants in the family Solanaceae, of which there are more than 3,000 known species worldwide, are some of the most morphologically diverse [Citation36]. Bioinformatics studies that have used the tomato genome as a reference genome for other Solanaceae species, have indicated that the tomato genome constitutes a valid reference genome for closely related species and may thus facilitate studies focusing on orthologous genes and gene families both within tomato and in other more diverse plants [Citation37]. This was indeed confirmed in the present study, in which we used SlCA protein sequences as query sequences to identify 16 and 24 CAs from two other typical Solanaceae plants, potato and tobacco, respectively. Moreover, our results indicated that these CAs can also be divided into the aforementioned three major CA clades. We accordingly believe that the comprehensive data generated in this study will facilitate functional genomics studies that will enable us to elucidate the roles of CA proteins in plant development, in both tomato and related Solanaceae species.
Our analysis of SlCA duplication revealed that the Ka/Ks ratios of the SlCA homologous pairs were all less than 0.4, thereby indicating that subsequent to segmental and genome-wide duplications, the SlCA genes have undergone purification selection ( and ).
In the present study, we also identified 38 cis elements in the promoter sequences of SlCA genes, of which 23, 9 and 6 are involved in light responsiveness, hormonal responses and environment responses, respectively (Supplementary material Table S2). The observation that more than three-fifths of these cis-acting elements are involved light responsiveness, suggests that the SlCAs may principally play important roles in photosynthesis. Early studies on Arabidopsis CAs demonstrated that the induction of CA1 at low CO2 concentrations can promote the balance between CO2 and HCO3-, such that CO2 on the cell surface can diffuse across the cell membrane and thereby provide inorganic carbon for photosynthesis [Citation11]. Consistently, αca1 mutants have been found to exhibit reduced photosynthetic activity and starch accumulation [Citation9]. The βCAs have been shown to maintain the concentration of CO2 in the vicinity of RuBisCO, promote the diffusion of CO2 through chloroplast membranes, rapidly remove HCO3- and release CO2 [6]. The βCAs also facilitate the exploitation of soil HCO3- ions as a substrate for photosynthesis in leaves and play key roles in regulating the homeostasis of both PSII and cell death via RuBisCO-dependent metabolic pathways [Citation5]. Our analyses of SlCA promoters also revealed that these sequences harbor a number of cis elements involved hormonal and environmental responses. In this regard, it has previously been demonstrated that overexpression of OsCA1, which responds to saline and osmotic stresses, can enhance salt tolerance in Arabidopsis [Citation38]. Furthermore, a tobacco chloroplast-localized βCA (also referred to as salicylic acid-binding protein 3; SABP3) has been shown to exhibit antioxidant activity and to play key roles in hypersensitive defense responses [Citation39]. Similarly, it has been found that AtβCA1 (also named AtSABP3) is highly expressed in response to pathogen infection [Citation40]. We suspect that αSlCA1 may play a comparable role, as we also detected the WUN-motif element in its promoter region.
RNA-seq databases effectively facilitate the mining of gene families in plants [Citation31], and in the present study, we analyzed the expression patterns of SlCAs in two tomato varieties (Heinz 1706 and LA1589). Compared with βSlCAs and γSlCAs, we found that αSlCAs were expressed in low amounts in tomato. Most of the SlCA genes have higher expression levels in leaves, thereby indicating that the CAs may directly affect the physiological processes associated with these source organs. We also analyzed the expression patterns of SlCAs in hydroponically grown tomato seedlings subjected to a simulated salt stress environment. Our results revealed a high variability in the abundance of SlCA gene transcripts in tomato. The expression level of αSlCA7e was significantly increased in the late stage of high NaCl concentration treatment, whereas the expression levels of αSlCA7c and βSlCA2b were increased in the early stage of low NaCl concentration treatment. Other SlCAs also exhibited diverse expression patterns in response to salt stress. These results accordingly indicate that the SlCA family of genes may play important roles in the salt stress response.
Conclusions
Although considerable progress has been made in understanding the function of CA enzymes in animals, progress in higher plants has been somewhat less pronounced. In this study, we identified a total of 14 SlCA genes in a genome-wide analysis of the tomato genome and subsequently sought to characterize these SlCA genes at multiple levels, including chromosomal localization, gene structure, conserved motifs, amino acid composition and predicted subcellular localization. Our analysis of evolutionary relationships revealed that these SlCAs can be classified into three major clades, namely α, β and γ, and that the SlCA genes appear to have undergone purification selection subsequent to segmental and genome-wide duplications. Furthermore, our examination of the patterns of SlCA expression based on RNA-seq data indicated that these enzymes may play crucial roles in stress responses. Our results accordingly provide a valuable foundation for further studies on the CA gene family in tomato and other Solanaceae plants.
Supplemental Material
Download PDF (835.6 KB)Acknowledgements
Authors acknowledge the use of tomato genome sequence, which was generated by the International Tomato Genome Sequencing Consortium (http://solgenomics.net/tomato).
Disclosure statement
The authors report no conflict of interest.
Additional information
Funding
Related Research Data
References
- Frommer WB. CO2mmon sense. Science 2010;327(5963):275–276.
- Smith KS, Ferry JG. Prokaryotic carbonic anhydrases. FEMS Microbiol Rev. 2000;24(4):335–366.
- Fabre N, Reiter IM, Becuwe-Linka N, et al. Characterization and expression analysis of genes encoding α and β carbonic anhydrases in Arabidopsis. Plant Cell Environ. 2007;30:617–629.
- Tiwari A, Kumar P, Singh S, et al. Carbonic anhydrase in relation to higher plants. Photosynthetica 2005;43(1):1–11.
- Dąbrowska-Bronk J, Komar DN, Rusaczonek A, et al. β-carbonic anhydrases and carbonic ions uptake positively influence Arabidopsis photosynthesis, oxidative stress tolerance and growth in light dependent manner. J Plant Physiol. 2016;203:44–54.
- Ignatova L, Rudenko N, Zhurikova E, et al. Carbonic anhydrases in photosynthesizing cells of C3 higher plants. Metabolites 2019;9(4):73.
- Hewett-Emmett D, Tashian RE. Functional diversity, conservation, and convergence in the evolution of the α-, β-, and γ-carbonic anhydrase gene families. Mol Phylogenet Evol. 1996;5(1):50–77.
- Tripp BC, Smith K, Ferry JG. Carbonic anhydrase: new insights for an ancient enzyme. J Biol Chem. 2001;276(52):48615–48618.
- Burén S, Ortega-Villasante C, Blanco-Rivero A, et al. Importance of post-translational modifications for functionality of a chloroplast-localized carbonic anhydrase (CAH1) in Arabidopsis thaliana. PLoS One 2011;6(6):e21021.
- Villarejo A, Burén S, Larsson S, et al. Evidence for a protein transported through the secretory pathway en route to the higher plant chloroplast. Nat Cell Biol. 2005;7(12):1224.
- Van K, Spalding MH. Periplasmic carbonic anhydrase structural gene (Cah1) mutant in Chlamydomonas reinhardtii. Plant Physiol. 1999;120(3):757–764.
- Sun Q, Zybailov B, Majeran W, et al. PPDB, the plant proteomics database at Cornell. Nucleic Acids Res. 2009;37(suppl_1):D969–D974.
- Zhurikova E, Ignatova L, Semenova G, et al. Effect of knockout of α-carbonic anhydrase 4 gene on photosynthetic characteristics and starch accumulation in leaves of Arabidopsis thaliana. Russ J Plant Physiol. 2015;62(4):564–569.
- Mitra M, Lato SM, Ynalvez RA, et al. Identification of a new chloroplast carbonic anhydrase in Chlamydomonas reinhardtii. Plant Physiol. 2004;135(1):173–182.
- Ludwig M. Evolution of carbonic anhydrase in C4 plants. Curr Opin Plant Biol. 2016;31:16–22.
- Hu H, Rappel W-J, Occhipinti R, et al. Distinct cellular locations of carbonic anhydrases mediate carbon dioxide control of stomatal movements. Plant Physiol. 2015;169(2):1168–1178.
- Hu H, Boisson-Dernier A, Israelsson-Nordström M, et al. Carbonic anhydrases are upstream regulators of CO 2-controlled stomatal movements in guard cells. Nat Cell Biol. 2010;12(1):87–93.
- Sunderhaus S, Dudkina NV, Jänsch L, et al. Carbonic anhydrase subunits form a matrix-exposed domain attached to the membrane arm of mitochondrial complex I in plants. J Biol Chem. 2006;281(10):6482–6488.
- Soto D, Córdoba JP, Villarreal F, et al. Functional characterization of mutants affected in the carbonic anhydrase domain of the respiratory complex I in Arabidopsis thaliana. Plant J. 2015;83(5):831–844.
- Finn RD, Clements J, Eddy SR. HMMER web server: interactive sequence similarity searching. Nucleic Acids Res. 2011;39(suppl):W29–W37.
- El-Gebali S, Mistry J, Bateman A, et al. The Pfam protein families database in 2019. Nucleic Acids Res. 2019;47(D1):D427–D432.
- Letunic I, Bork P. 20 years of the SMART protein domain annotation resource. Nucleic Acids Res. 2018;46(D1):D493–D496.
- Chen C, Xia R, Chen H, et al. TBtools, a Toolkit for Biologists integrating various biological data handling tools with a user-friendly interface. BioRxiv 2018.
- Sievers F, Wilm A, Dineen D, et al. Fast, scalable generation of high-quality protein multiple sequence alignments using Clustal Omega. Mol Syst Biol. 2011;7(1):539–511.
- McWilliam H, Li W, Uludag M, et al. Analysis tool web services from the EMBL-EBI. Nucleic Acids Res. 2013;41(W1):W597–W600.
- Jones DT, Taylor WR, Thornton JM. The rapid generation of mutation data matrices from protein sequences. Bioinformatics 1992;8(3):275–282.
- Kumar S, Stecher G, Li M, et al. MEGA X: molecular evolutionary genetics analysis across computing platforms. Mol Biol Evol. 2018;35(6):1547–1549.
- Lynch M, Conery JS. The evolutionary fate and consequences of duplicate genes. Science 2000;290(5494):1151–1155.
- Xu G, Guo C, Shan H, et al. Divergence of duplicate genes in exon–intron structure. Proc Natl Acad Sci USA 2012;109(4):1187–1192.
- Lescot M, Déhais P, Thijs G, et al. PlantCARE, a database of plant cis-acting regulatory elements and a portal to tools for in silico analysis of promoter sequences. Nucleic Acids Res. 2002;30(1):325–327.
- Wang Z, Gerstein M, Snyder M. RNA-Seq: a revolutionary tool for transcriptomics. Nat Rev Genet. 2009;10(1):57–63. https://doi.org/10.1038/nrg2484
- Sage RF. The evolution of C4 photosynthesis. New Phytol. 2004;161(2):341–370.
- Sage RF, Sage TL, Kocacinar F. Photorespiration and the evolution of C4 photosynthesis. Annu Rev Plant Biol. 2012;63(1):19–47.
- Kachru RB, Anderson LE. Chloroplast and cytoplasmic enzymes. Planta 1974;118(3):235–240.
- Ku S, Edwards G. Photosynthesis in mesophyll protoplasts and bundle sheath cells of various types of C4 plants. IV. Enzymes of kespiratory metabolism and energy utilizing enzymes of photosynthetic pathways. Z Pflanzenphysiol. 1975;77(1):16–32.
- Knapp S, Bohs L, Nee M, et al. Solanaceae—a model for linking genomics with biodiversity. Int J Genom. 2004;5:285–291.
- Menda N, Strickler SR, Mueller LA. Advances in tomato research in the post-genome era. Plant Biotechnol. 2013;30(3):243–256.
- Yu S, Zhang X, Guan Q, et al. Expression of a carbonic anhydrase gene is induced by environmental stresses in rice (Oryza sativa L.). Biotechnol Lett. 2006;29(1):89–94.
- Slaymaker DH, Navarre DA, Clark D, et al. The tobacco salicylic acid-binding protein 3 (SABP3) is the chloroplast carbonic anhydrase, which exhibits antioxidant activity and plays a role in the hypersensitive defense response. Proc Natl Acad Sci USA 2002;99(18):11640–11645.
- Wang Y-Q, Feechan A, Yun B-W, et al. S-nitrosylation of AtSABP3 antagonizes the expression of plant immunity. J Biol Chem. 2009;284(4):2131–2137.