
Abstract
Sugar transporter proteins (STPs) play an important role in plant growth and development and stress resistance. Pepper (Capsicum annuum L.) is a significant economic crop and is widely cultivated worldwide. However, the evolution and the roles of STP genes in the growth and development and in coping with abiotic stresses in pepper are poorly known. Here, we characterized STP gene family in pepper through integration of chromosomal location, gene structure, conserved motif, phylogeny, expression patterns in different tissues and abiotic stresses. Using bioinformatics-based methods, we identified 17 putative STP genes in pepper. Chromosome mapping indicated that they are unevenly distributed on 9 chromosomes and there are tandem duplication events. Gene structure analysis revealed that intron numbers among these CaSTP genes ranged from 2 to 5, except that CaSTP12 and CaSTP13 genes contained no introns. The phylogenetic tree of STP genes from pepper and other plant species revealed that STP genes were grouped into 4 subfamilies, suggesting that these gene subfamilies may have diverged from a single common ancestor prior to the mono-dicot split. Gene expression analysis based on RNA-seq data showed that three genes were expressed constitutively in all the tissues analyzed, implying that these genes might have specific function in pepper. Stress data analysis showed that the expression profiles of some members of the CaSTP gene family were altered under cold, heat, salt and hormone stress conditions. The present results will provide valuable information into the evolutionary relationships and functional divergence of the STP family in the future.
Introduction
In plants, soluble sugars (e.g. sucrose, monosaccharides, polyols, and oligosaccharides) are crucial components in plant growth, development and stress response as carbohydrate substrate, energy source for growth and development, components of cell walls, signal transduction molecules and main components of cell compounds [Citation1]. Sugars are mainly synthesized in source organs (e.g. leaves) and then translocated via phloem sap into the sink organs, such as roots, fruits, seeds and other reproductive organs [Citation2]. Multiple transporters have evolved in plants, including sugars will eventually be exported transporters (SWEETs), monosaccharide transporters (MSTs) and sucrose transporters (SUTs) [Citation3, Citation4]. These transporters can not only carry out the loading and unloading of complexes, but also control the distribution of sugars in ‘sink’ and ‘source’ tissues by regulating sucrose transport and reducing monosaccharide content [Citation5, Citation6].
Sugar transporter proteins that belong to the family of MSTs superfamily, commonly contain 12 transmembrane domains and are localized in the cell membrane [Citation7]. STPs are regarded as H+/sugar symporters, and can transport fructose, glucose, galactose, pentose, xylose, mannose and ribose [Citation8, Citation9]. In recent years, with the rapid development of whole genome sequencing, genome-wide identification of the STP gene family has been completed in many plants, such as Arabidopsis thaliana [Citation10], tomato (Solanum lycopersicum) [Citation11], rice (Oryza sativa) [Citation12], pear (Pyrus bretschneideri Rehd) [Citation13], woodland strawberry (Fragaria vesca) [Citation14] and cabbage (Brassica oleracea var. capitata L) [Citation15]. Most members of STPs act with a broad spectrum of substrates in Arabidopsis [Citation16]. However, AtSTP9 and AtSTP14 are specific for the transport of glucose and galactose, respectively [Citation17]. In addition, cumulative previous reports have also shown that the expression patterns of STP genes are very diverse in different tissues/organs, different developmental stages, and even different environmental conditions. For example, the first identified monosaccharide transporter is AtSTP1, which is expressed in guard cells of rosette leaves, stems, cotyledons and ovaries [Citation18]. AtSTP4 gene is expressed in leaves, roots and pollen tubes, whereas the highest expression is found in roots [Citation19]. It has also been found that the expression level of AtSTP4 increased significantly with the invasion and injury of pathogenic bacteria [Citation19].AtSTP2, AtSTP6, AtSTP9 and AtSTP11 are expressed in different stages of pollen development [Citation8]. Furthermore, OsSTP4, OsSTP11, OsSTP19 and OsSTP28 reportedly respond to osmotic, salt and drought stresses [Citation7]. For the past few years, with the continuous development of bioinformatics, the study on the expression profile and function of AtSTP genes in Arabidopsis thaliana has been continuously deepened. However, the extensive expression profiles of the CaSTP genes in pepper remain poorly characterized.
Recently, the availability of whole plant genome sequences provided an opportunity for identifying members of gene families [Citation20–23]. Pepper is an important solanaceous vegetable crop, which has rich edible and medicinal value and is one of the most significant cash crops in China [Citation24]. Although the STPs have been well studied in many plants, its function in pepper is still unclear. To comprehensively understand the putative roles of STPs in pepper, a systematic analysis of the STPs family was necessary at the whole-genome level. In recent years, the whole-genome sequence of pepper was made available, which provided opportunities to further analyze the regulation mechanisms and expression patterns of the pepper STPs family in response to environment stresses [Citation25, Citation26]. In the present study, the members of STPs family in peppers were identified using a bioinformatics method and characterized by sequence characteristics, phylogenetic relationships, intron/exon structure, conserved motif analysis, chromosomal location and tissue expression patterns. These results can help us understand the evolution of STPs family in pepper and further better understand the functional characterization of the CaSTPs family in the future.
Materials and methods
Retrieval and identification of CaSTP genes in pepper
The pepper genome sequences were downloaded from the pepper genome database (http://passport.pepper.snu.ac.kr/?t=PGENOME and https://solgenomics.net/) and were used to set up a local database by the software DNATOOLs. The Hidden Markov Model (HMM) profile of CaSTP domain (PF00083) from PFam (http://pfam.sanger.ac.uk/) was employed to search against the local database using BlastP method (e < 1e − 5). Name search using CaSTP as a keyword was also applied to retrieve from plant genome databases. Then, incomplete candidate genes were further identified and redundant sequences were manually removed. Finally, all predicted CaSTP genes were tested and those without the common CaSTP domain were excluded. Molecular weight (Mw) and protein isoelectric point (pI) were calculated using the online tools ExPasy (https://web.expasy.org/compute_pi/) [Citation27].
Chromosomal location and gene duplication
The physical location information was obtained from the Tartary buckwheat genomic database by Circos, and all CaSTP genes were mapped to the chromosomes of pepper with the MapDraw tool. Tandemly duplicated CaSTP genes were identified according to research methods reported by previous researchers [Citation28].
Gene structure and conserved motifs gene structure analysis
Gene structures (intron/exon) were determined by alignment of genome DNA and full-length cDNA sequence using GSDS 2.0 (http://gsds.cbi.pku.edu.cn/) [Citation29]. Conserved motifs of all CaSTP proteins were analyzed by Multiple Expectation Maximization for motif Elicitation (MEME, http://meme-suite.org/tools/meme) program with the following parameters: the maximum number of 20 motifs with motif length between 6 wide and 50 wide amino acids [Citation15]. Then, TBtools was used to visualize the gene structure and conserved motifs of CaSTP genes [Citation30].
Phylogenetic tree construction of CaSTPs
To investigate the phylogenetic relationships of STP genes, the representative STP genes from Arabidopsis, tomato, rice, potato, together with STP genes from pepper, were selected for constructing a phylogenetic tree [Citation31]. Multiple sequence alignment of STP proteins was conducted using Clustal X. An un-rooted Neighbor-joining phylogenetic tree was constructed using MEGA 7.0 software with default settings [Citation32]. In the phylogenetic tree, the bootstrap test was performed by 1000 replications.
Tissue-specific expression analysis
In this study, RNA-seq data from Pepper Functional Genomics Database (PFGD, http://pepperhub.hzau.edu.cn/pegnm/) were used to investigate expression patterns of putative CaSTP genes in different tissues. Eight different tissues were selected: flower, petal, ovary, stamens, leaf, fruit, seed, placenta and seed. RPKM (Reads Per Kilo bases per Million mapped Reads) values of CaSTP genes were log2-transformed. Heat maps of the putative CaSTP gene in different tissues were generated using software MultiExperiment Viewer (MeV) (http://mev.tm4.org/#/welcome).
Expression patterns of CaSTP genes under different stress conditions
To get insight into the expression patterns of the CaSTP gene family under different environmental stresses, histogram analysis was performed. Genome-wide RNA-seq data for diverse environment stresses such as cold, heat, salt and hormone was downloaded from database PFGD (http://pepperhub.hzau.edu.cn/pegnm/). The treated materials were taken from pepper seedlings at 40 d, and the expression levels of 6 h and 12 h after stresses were compared with those of untreated pepper seedlings and the histogram was completed.
Results and discussion
Genome-wide identification of CaSTPs family in pepper
More and more evidence suggests that STP genes play significant roles in regulating plant growth and development [Citation20]. With the development of biotechnology and bioinformatics in recent years, the functions of the STP family genes have been identified and analyzed in many plants, including the model plants tomato [Citation11], rice [Citation12], and Arabidopsis [Citation8], as well as other plants, including Chinese cabbage [Citation15]. However, no systematic investigations on the STP gene family of pepper have been reported, and the expression profiles and functional differentiation of the CaSTP genes should be further investigated. The availability of the pepper genome sequence has provided significant opportunity to explore the short-term evolutionary dynamics of the STP gene family, and to investigate their phylogenetic relationships and potential functional roles. In the present study, we systematically analyzed the STP gene family in pepper. A total of 17 STP genes were obtained from the pepper genome. For convenience, we named these STP genes. Details on gene name, locus name, chromosome location, intron number, open reading frame (ORF) length, isoelectric point (pI), molecular weight and protein length were listed in .
Table 1. Features of CaSTPs in pepper.
The physicochemical analysis showed that Molecular weight of the CaSTP genes ranged from 51.35 to 62.65 kDa, except for CaSTP1 that were less than 51 kDa (). Molecular weights of these STPs had a small variation. Isoelectric points ranged from 8.38 (CaSTP1) to 9.53 (CaSTP3 and CaSTP4), and these genes correspond to proteins whose isoelectric point is greater than 7, indicating that these proteins are alkaline. The length of the STPs ranged from 461 (CaSTP2) to 524 aa (CaSTP15). The length of the CaSTP1 sequence was significantly shorter than that of other proteins, and it was found that its sequence was not complete. The corresponding open reading frames (ORFs) ranged from 1386 bp to 1575 bp. In addition, the number of STP genes in peppers is different from that in other plants. The number of STP genes in C. annuum is higher than that in A. thaliana (14), close to that in S. lycopersicum (18) and S. tuberosum(16), and less than that in Brachypodium distachyon (26), Hordeum vulgare(27), Setaria italica (25), Sorghum bicolor (23), Zea mays (22), O. rufipogon (26), and O. sativa (28) [Citation33]. The difference of STP genes quantity among different species may be related to WGT and fractionation events [Citation34]. Earlier studies reported that gene duplication is the main driving force for the expansion of gene families, resulting in functional divergence and diversification [Citation35].
Chromosomal distribution of CaSTP genes
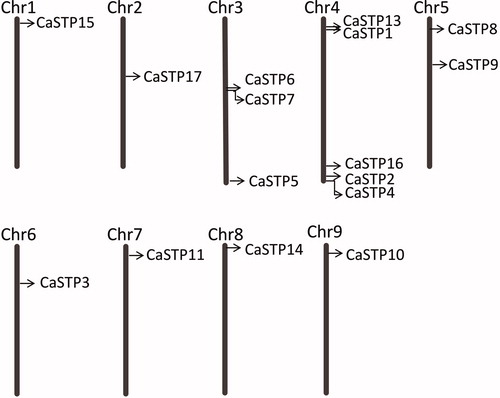
The chromosomal distributions of 17 CaSTP genes were determined. As shown in , sixteen STP genes are distributed on nine chromosomes, except for CaSTP12. Chromosome 3, 4 and 5 had three, five and two CaSTP genes, respectively, while each of the remaining six chromosomes (chromosome 1, 2, 6, 7, 8, and 9) contained only one CaSTP gene. In short, all STP genes were unevenly distributed across all 9 chromosomes. Notably, chromosome 3 had a gene cluster (CaSTP 6 and CaSTP 7) and chromosome 4 had two gene clusters (CaSTP 1, CaSTP13 and CaSTP2, CaSTP4), which was identified as a tandem duplication event. During the course of the evolution, some tandem duplications played essential roles in the expansion of the STP family. Furthermore, the majority of the CaSTP genes were situated on the distal ends of the chromosomes and were mainly distributed on the upper arms.
Figure 1. Chromosomal locations of 16 CaSTP genes on 9 chromosomes of pepper. The CaSTP genes positions are shown as black lines. Chromosome numbers are shown at the top of each bar.
Gene structure of the CaSTP genes
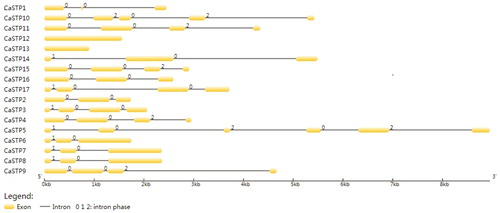
The exon/intron structures are thought to play significant roles in the evolution of multigene families. Meanwhile, earlier studies also show the diversity of gene structure as a crucial driving force of multiple gene families evolution [Citation35]. To gain insights into the structural evolution of the CaSTP genes, the exon and intron structures of the STP genes were determined by aligning the cDNA sequences with the corresponding genomic DNA sequences (). The results indicated that the intron numbers among these CaSTP genes ranged from 2 to 5, except for CaSTP12 and CaSTP13 genes, which contained no introns. The CaSTP5 gene exhibited the highest intron number (5), whereas six CaSTP genes (CaSTP1, CaSTP2, CaSTP6, CaSTP7, CaSTP8 and CaSTP14) only had two introns. In addition, four groups of CaSTP genes (CaSTP1 and 2, CaSTP3 and CaSTP17, CaSTP6, CaSTP7, CaSTP8 and CaSTP14, CaSTP4, CaSTP9, CaSTP11 and CaSTP15) exhibited similar intron/exon organization patterns, respectively. The rest of the CaSTP genes exhibited diverse intron/exon organization patterns.
Figure 2. Intron/exon configurations of CaSTP genes. Exons and introns are shown as yellow boxes and thin lines, respectively. 0 = intron phase 0; 1 = intron phase 1; 2 = intron phase 2.
Conserved motif analysis of CaSTP proteins
The conserved motifs of CaSTP genes were identified by the MEME tool, and 20 were found (motif 1 to motif 20). The lengths of these conserved motifs varied from 6 to 50 amino acids. Details of the 20 putative motifs are outlined in . Among the 20 motifs (), motif 17 only appeared in CaSTP2, CaSTP3 and CaSTP4 genes. Also, the same scenario found that motif 19 only appeared in CaSTP1, CaSTP12, and CaSTP13 genes. Interestingly, we also found that these motifs appeared in the N-terminal regions generally. In addition, Motif18 was absent from the six CaSTP genes (CaSTP2, CaSTP3, CaSTP4, CaSTP6, CaSTP7 and CaSTP13) except for the CaSTP1 incomplete sequence. Upon closer inspection, it is noteworthy that motif 20 only appeared in CaSTP7 and CaSTP8 genes. Furthermore, it was distributed between motif 4 and motif 7. Conserved motifs of pepper STP genes showed similar characteristics with Arabidopsis, cassava, and other species [Citation15]. These results suggested that STP genes have high conservation among different species. Nevertheless, the functions of these highly conserved motifs still remain elusive.
Figure 3. Motifs of the CaSTP protein identified using MEME online tools. Note: In total, 20 motifs were identified and are indicated by increasing numbers from 1 to 20. Twenty putative motifs are indicated in different colored boxes.
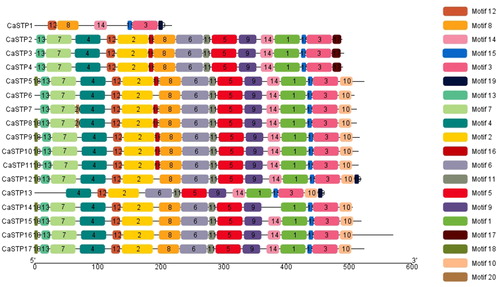
Table 2. List of the putative motifs of CaSTP proteins.
Phylogenetic analysis of STP genes in plants
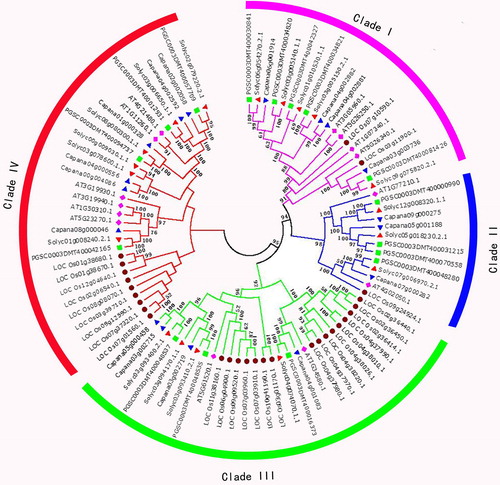
To investigate the phylogenetic relationships of STP genes between pepper and other plant species, a total of 93 STP genes were identified from Oryza sativa, Solanum tuberosum, Arabidopsis thaliana and S. lycopersicum. We found that O. sativa, S. lycopersicum and C. annuum have more STP genes than S. tuberosum and A. thaliana. It was speculated that the number of imparities of STP genes in these species is a result of gene expansion of different clades among these species. Thus, an unrooted phylogenetic tree was constructed to elucidate their evolutionary relationships based on the 93 STP genes using the program MEGA7.0. Phylogenetic analysis revealed that all STP genes were clustered into four distinct clades, which include Clade I, Clade II, Clade III, and Clade IV (). The clades I, II, III, and IV contained 20, 13, 29, and 31 members, respectively. The STP subfamily expanded significantly in pepper compared to Arabidopsis [Citation36]. This result supported previous reports [Citation15, Citation37]. Meanwhile, Clade I, Clade III, and Clade IV displayed significant expansion compared to Clade II. Clade I and Clade II differed greatly among these tested species, while Clade III and Clade IV showed more STP genes copies in O. sativa than in S. lycopersicum, C. annuum, A. thaliana and S. tuberosum. This study also found that the gene quantity and structures of the four clades were greatly different, which indicates that the STP genes were amplified and functionally differentiated.
Figure 4. Phylogenetic tree of Capsicum annuum, Oryza sativa, Solanum lycopersicum, Arabidopsis thaliana and Solanum tuberosum STP genes. Phylogenetic analysis of 93 STP genes from Capsicum annuum (17), Arabidopsis thaliana (14), Solanum tuberosum (16), Solanum lycopersicum (18) and Oryza sativa (28) showing similar groups in the three species. Four clades were marked with different background colors.
Expression analysis of CaSTP genes in different tissues
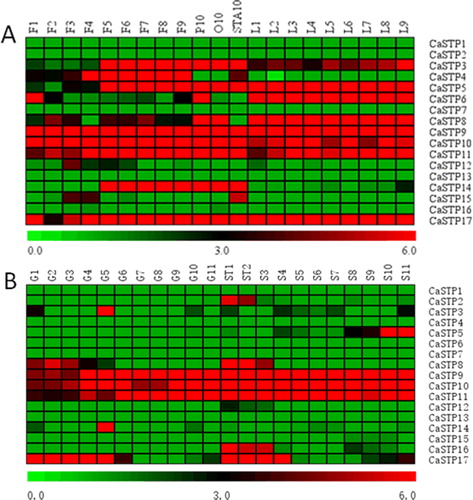
Tissue/organ-specific expression analysis can provide vital clues about the function differentiation of the genes in different tissue/organs [Citation38–43]. We, thus, analyzed RNA seq data about the expression patterns of 17 pepper STP genes during the development of various tissues (flowers, leaves, fruit and seeds) (). In the present study, we found that pepper STP genes showed diversified expression patterns in different tissues and stages. Furthermore, some CaSTP genes were organ-specific. For instance, several CaSTP genes were expressed in only one or two organs and were highly expressed, such as CaSTP 3, CaSTP 4 and CaSTP14 in flowers, CaSTP6 in leaves, CaSTP5 in flowers and leaves, and CaSTP 8 in leaves (). In addition, during pepper growth and development, three genes (CaSTP9, CaSTP10 and CaSTP11) sustained high expression in all the tested tissues. We concluded that the three highly expressed CaSTP genes might be significant regulatory factors in pepper development, although further studies are required to explore the function of these genes. Two genes (CaSTP5 and CaSTP17) demonstrated similarity tissue-specific expression pattern, being mainly expressed in flowers and leaves. These results were consistent with previous findings on other species [Citation8, Citation37]. In addition, we found that the CaSTP3 and CaSTP5 genes, which are expressed in vegetative organs, are not expressed in reproductive organs (). Although the functionality of these transporters is unknown, they might have a determinant function in the development of flowers and leaves. The different expression patterns of STP genes in pepper suggested different roles in growth and development, so the CaSTP genes need further investigations to elucidate their function.
Figure 5. Heat map of the expression pattern of STP genes in different tissues of pepper. (A) F1-F9 represents flower buds of different stages; P10: petals; O10: ovary; STA10: stamens; L1-L9 indicates the expression of CaSTPs in leaves at 2, 5, 10, 15, 20, 25, 30, 40 and 50 days after emergence. (B) G1-G11 indicated the expression of CaSTPs in fruits at 3, 7, 10, 15, 20, 25, 30, 35, 40, 45 and 50 days after flowering, respectively; ST1 and ST2 represent seeds and placenta in fruits 10 and 15 days after flowering, respectively; S3-S11 indicates the expression of CaSTPs in leaves at 20, 25, 30, 35, 40, 45, 50, 55 and 60 days after flowering. Heat maps are presented in red/black/green colors that represent high/medium/low expression, respectively.
Expression changes of STP genes in pepper seedlings under cold and high temperature stress
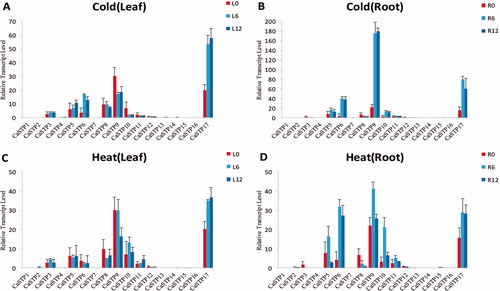
The plant growth and development are seriously affected by abiotic stress [Citation44–46], including high temperature and low temperature [Citation47–57]. In the present study, based on available genome-wide RNA-seq data, we analyzed the expression profile of pepper STP genes under cold and high temperature stress treatments. We found that CaSTP genes suggested different expression patterns between leaves and roots (). In leaves and roots, CaSTP5, CaSTP6, CaSTP9, and CaSTP17 were clearly up-regulated under cold temperature treatments (). Under high temperature stress, CaSTP6 and CaSTP9 were significantly up-regulated in roots but down-regulated in leaves (). It should be noted that CaSTP17 showed significant up-regulation in both leaves and roots after treatment (cold and high temperature). These results imply some functional differentiation of CaSTP genes. In addition, the expression of the majority of other STP genes did not change significantly during these treatments. CaSTP11 was relatively highly expressed in all tested tissues in our study, but responded to cold and high temperature stress treatments very slowly, which indicated that CaSTP11 might be involved in the routine work but not in the response to environment change [Citation16].
Figure 6. Expression profiles of CaSTP genes under cold and high temperature stress. (A and C) Expression level of CaSTP genes in leaves after 0 h, 6 h and 12 h at low temperature and high temperature treatment, respectively.(B and D)the expression level of CaSTP genes in roots after 0 h, 6 h and 12 h at low temperature and high temperature treatment, respectively.
Expression changes of STP genes in pepper seedlings under salt stress
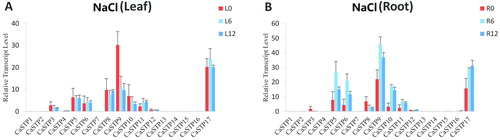
Salt stress is another major abiotic stress limiting crop production [Citation58–66]. To gain further insight into the role of CaSTP genes under salt stress, we analyzed the expression profiles of CaSTP genes under salt stress treatments based on available genome-wide RNA-seq data. As shown in , the expression of some CaSTP genes was significantly altered under salt stress treatments. We found that in response to salt treatment, there was decreased expression of CaSTP 9 and CaSTP 10 in leaves and an enhanced transcript level of CaSTP 11 (). In roots, CaSTP5, CaSTP6, CaSTP9, CaSTP10, CaSTP11, and CaSTP17 were clearly up-regulated under salt stress treatments, whereas there was a decreased transcript level of CaSTP 8 (). Furthermore, CaSTP9 and CaSTP17 expression increased about twofold. It should be noted that CaSTP9 and CaSTP10 were significantly up-regulated in roots but down-regulated in leaves. Previous studies also indicated that some STP genes play significant roles in stresses responses [Citation7, Citation8, Citation37]. In addition, the expression of most other STP genes did not change significantly under salt stress.
Figure 7. Expression profiles of CaSTP genes under salt stress. (A and B) Expression of CaSTP genes in leaves (A) and roots (B) after salt treatment at 0 h, 6 h and 12 h, respectively.
Expression patterns of CaSTP genes under different exogenous phytohormone treatments
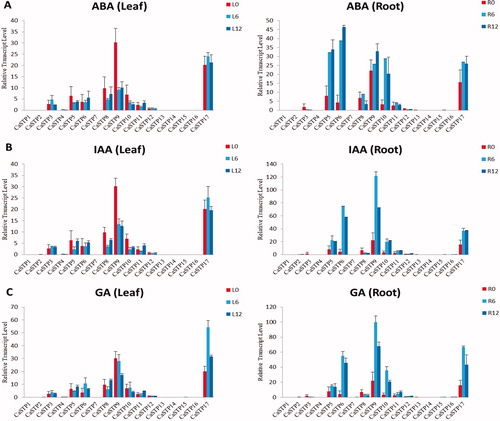
Phytohormones, such as ABA, IAA and GA, are involved in various stress signaling pathways, and play significant roles in alleviating adverse abiotic stresses in plants, along with multiple other biological functions [Citation67–73]. To elucidate the potential functions of CaSTP genes in response to exogenous phytohormones, we analysed available data about the expression profiles of CaSTP genes in leaves and roots treated with these exogenous substances (). We found that CaSTP 5, CaSTP 6, CaSTP 9, CaSTP 10 and CaSTP 17 in the roots were up-regulated under ABA, IAA, and GA treatments, and these genes exhibited higher expression by 6 h after treatment. Furthermore, CaSTP 6 showed higher up-regulation under ABA treatment than under other phytohormones treatments. In leaves, CaSTP6 was clearly up-regulated under ABA and IAA treatments, while CaSTP 5, CaSTP 8, CaSTP 9 and CaSTP 10 were down-regulated. The expression of the CaSTP genes was significantly induced in response to GA treatment compared to controls. For example, in leaves, CaSTP5, CaSTP6, and CaSTP17 were clearly up-regulated, while CaSTP 9 was clearly down-regulated. Interestingly, following GA treatment, the CaSTP8 gene in the leaves was down-regulated during the early time periods and clearly up-regulated during the later time periods. In addition, the other 11 CaSTP genes were unregulated by phytohormones treatment, and there was no significant change in the expression. These results suggested that CaSTP5 might also be a crucial emergency response gene, but the specific regulatory mechanism needs to be further explored in the future.
Figure 8. Expression profiles of CaSTP genes under exogenous phytohormone treatment. (A, B and C) Expression of CaSTP genes in leaves and roots after treatment by ABA (A), IAA (B) and GA (C) at 0 h, 6 h and 12 h, respectively.
Conclusions
Here, a genome-wide analysis of pepper CaSTP family was performed, and 17 CaSTP genes were confirmed. Subsequently, analyses of CaSTP genes on gene structures, conserved motifs, chromosomal location, phylogeny, expression patterns in different tissues and abiotic stresses (cold, heat, salt and hormone stress), were conducted based on bioinformatics methods. This study provided a comprehensive understanding of the CaSTP gene family in pepper and made a basis for working out the functional roles of the CaSTP genes in pepper in the future.
Author contributions
H.W., J.L., and J.Z. conceived and designed the research. R.Z., Y.C., M.R., Q.Y., and R.W. performed the experiments. Z.Y., G.Z., and M.D., analyzed the data and wrote the paper. Y.C. and H.W. revised the manuscript. All authors read and approved the final manuscript. All authors read and approved the final manuscript.
Disclosure statement
The authors declare no conflict of interest.
Additional information
Funding
References
- Rolland F, Baena-Gonzalez E, Sheen J. Sugar sensing and signaling in plants: Conserved and novel mechanisms. Annu Rev Plant Biol. 2006;57(1):675–709.
- Lemoine R, La Camera S, Atanassova R. Source-to-sink transport of sugar and regulation by environmental factors. Front Plant Sci. 2013; 4:272.
- Chen LQ, Hou BH, Lalonde S, et al. Sugar transporters for intercellular exchange and nutrition of pathogens. Nature. 2010;468(7323):527–532.
- Doidy J, Grace E, Kühn C, et al. Sugar transporters in plants and in their interactions with fungi. Trends Plant Sci. 2012;17(7):413–422.
- Martinoia E, Massonneau A, Frang N. Transoprt processes of solutes across the vacuolar membrane of higher plants. Plant Cell Physiol. 2000; 41(11):1175–1186.
- Wang HX, Weerasinghe RR, Perdue TD, et al. A golgi localized hexose transporter is involved in heterotrimeric G protein-mediated early development in Arabidopsis. MBoC. 2006; 17(10):4257–4269.
- Deng X, An B, Zhong H, et al. A novel insight into functional divergence of the MST gene family in rice based on comprehensive expression patterns. Genes. 2019;10(3):239.
- Büttner M. The Arabidopsis sugar transporter (AtSTP) family: An update. Plant Biol. 2010; 12:35–41.
- Julius BT, Leach KA, Tran TM, et al. Sugar transporters in plants: new insights and discoveries. Plant Cell Physiol. 2017;58(9):1442–1460.
- Alexandra W, Oliver T, Ingmar F, et al. Molecular identification and physiological characterization of a novel monosaccharide transporter from Arabidopsis involved in vacuolar sugar transport. Plant Cell. 2006; 18:3476–3490.
- Reuscher S, Akiyama M, Yasuda T, et al. The sugar transporter inventory of tomato: genome-wide identification and expression analysis. Plant Cell Physiol. 2014;55(6):1123–1141.
- Toyofuku K, Kasahara M, Yamaguchi J. Characterization and expression of monosaccharide transporters (OsMSTs) in rice. Plant Cell Physiol. 2000;41(8):940–947.
- Li J, Zheng D, Li L, et al. Genome-wide function evolutionary characterization and expression analysis of sugar transporter family genes in pear (Pyrus bretschneideri Rehd). Plant Cell Physiol. 2015;56(9):1721–1737.
- Jiu S, Haider MS, Kurjogi MM, et al. Genome-wide characterization and expression analysis of sugar transporter family genes in woodland strawberry. Plant Genome. 2018;11(3):1–16.
- Zhang W, Wang S, Yu F, et al. Genome-wide identification and expression profiling of sugar transporter protein (STP) family genes in cabbage (Brassica oleracea var capitata L) reveals their involvement in clubroot disease responses. Genes. 2019;10(1):71.
- Büttner M, Truernit E, Baier K, et al. AtSTP3 a green leaf-specific low affinity monosaccharide-H+symporter of Arabidopsis thaliana. Plant Cell Environ. 2000;23(2):175–184.
- Poschet G, Hannich B, Büttner M. Identification and characterization of AtSTP14 a novel galactose transporter from Arabidopsis. Plant Cell Physiol. 2010;51(9):1571–1580.
- Stadler R, Büttner M, Ache P, et al. Diurnal and light-regulated expression of AtSTP1 in guard cells of Arabidopsis. Plant Physiol. 2003;133(2):528–537.
- Truernit E, Schmid J, Epple P, et al. The sink-specific and stress-regulated Arabidopsis STP4 gene: Enhanced expression of a gene encoding a monosaccharide transporter by wounding elicitors and pathogen challenge. Plant Cell. 1996;8(12):2169–2182.
- Lu T, Zhang G, Sun L, et al. Genome-wide identification of CBL family and expression analysis of CBLs in response to potassium deficiency in cotton. Peer J. 2017; 5:e3653.
- Chen MY, Li K, Li HP, et al. The Glutathione peroxidase gene family in Gossypium hirsutum: genome-wide identification classification gene expression and functional analysis. Sci Rep. 2017;7(1):44743.
- Sun Q, Wang GH, Zhang X, et al. Genome-wide identification of the TIFY gene family in three cultivated Gossypium species and the expression of JAZ genes. Sci Rep. 2017;7(1):42418.
- Zhang G, Lu T, Miao W, et al. Genome-wide identification of ABA receptor PYL family and expression analysis of PYLs in response to ABA and osmotic stress in Gossypium. Peer J. 2017; 5:e4126.
- Mueller LA, Solow TH, Taylor N, et al. The SOL genomics network: a comparative resource for Solanaceae biology and beyond. Plant Physiol. 2005;138(3):1310–1317.
- Qin C, Yu CS, Shen Y, et al. Whole-genome sequencing of cultivated and wild peppers provides insights into Capsicum domestication and specialization. Proc Natl Acad Sci USA. 2014; 111(14):5135–5140.
- Kim S, Park J, Yeom SI, et al. New reference genome sequences of hot pepper reveal the massive evolution of plant disease-resistance genes by retroduplication. Genome Biol. 2017;18(1):210.
- Bjellqvist B, Basse B, Olsen E, et al. Reference points for comparisons of two-dimensional maps of proteins from different human cell types defined in a pH scale where isoelectric points correlate with polypeptide compositions. Electrophoresis. 1994; 15(1):529–539.
- Yang X, Kalluri UC, Jawdy S, et al. The F-box gene family is expanded in herbaceous annual plants relative to woody perennial plants. Plant Physiol. 2008;148(3):1189–1200.,
- Hu B, Jin J, Guo AY, et al. GSDS 20: an upgraded gene feature visualization server. Bioinformatics. 2015;31(8):1296–1297.
- Chen C, Xia R, Chen H, et al. TBtools a Toolkit for Biologists integrating various HTS-data handling tools with a user-friendly interface. BioRxiv. 2018; 28:9660.
- Lopes-Caitar VS, de Carvalho MC, Darben LM, et al. Genome-wide analysis of the Hsp20 gene family in soybean: comprehensive sequence genomic organization and expression profile analysis under abiotic and biotic stresses. BMC Genomics. 2013;14(1):577.
- Kumar S, Stecher G, Tamura K. MEGA7: molecular evolutionary genetics analysis version 70 for bigger datasets. Mol Biol Evol. 2016;33(7):1870–1874.
- Kong WL, An BG, Zhang Y, et al. Sugar transporter proteins (STPs) in gramineae crops: comparative analysis phylogeny evolution and expression profiling. Cells. 2019;8(6):560.
- Wang X, Wang H, Wang J, et al. The genome of the mesopolyploid crop species Brassica rapa. Nat Genet. 2011;43(10):1035–1039.
- Kong W, Zhong H, Deng X, et al. Evolutionary analysis of GH3 genes in six Oryza species/subspecies and their expression under salinity stress in Oryza sativa ssp japonica. Plants. 2019;8(2):30.
- Johnson DA, Hill JP, Thomas MA. The monosaccharide transporter gene family in land plants is ancient and shows differential subfamily expression and expansion across lineages. BMC Evol Biol. 2006;6(1):64.
- Liu Q, Dang H, Chen Z, et al. Genome-wide identification expression and functional analysis of the sugar transporter gene family in cassava (Manihot esculenta). IJMS. 2018;19(4):987.
- Liang JY, Xia JY, Liu LL, et al. Global patterns of the responses of leaf-level photosynthesis and respiration in terrestrial plants to experimental warming. J Plant Ecol. 2013; 6(6):437–447.
- Zhao X, Wang YL, Qiao XR, et al. Phototropins function in high-intensity blue light-induced hypocotyl phototropism in Arabidopsis by altering cytosolic calcium. Plant Physiol. 2013; 162(3):1539–1551.
- Han YJ, Wang XH, Chen WC, et al. Differential expression of carotenoid-related genes determines diversified carotenoid coloration in flower petal of Osmanthus fragrans. Tree Genet Genomes. 2014; 10(2):329–338.
- Han Y, Wu M, Cao L, et al. Characterization of OfWRKY3 a transcription factor that positively regulates the carotenoid cleavage dioxygenase gene OfCCD4 in Osmanthus fragrans. Plant Mol Biol. 2016; 91(4–5):485–496.
- Guo S, Dai S, Singh PK, et al. A membrane-bound NAC-like transcription factor OsNTL5 represses the flowering in Oryza sativa. Front Plant Sci. 2018; 9:555.
- Shang B, Zang Y, Zhao X, et al. Functional characterization of GhPHOT2 in chloroplast avoidance of Gossypium hirsutum. Plant Physiol Biochem. 2019; 135:51–60.
- Gao ZY, Liu H, Wang HL, et al. Generation of the genetic mutant population for the screening and characterization of the mutants in response to drought in maize. Chin Sci Bull. 2014;59(8):766–775.
- Wang DJ, Yang CL, Dong L, et al. Comparative transcriptome analyses of drought-resistant and-susceptible Brassica napus L. and development of EST-SSR markers by RNA-Seq. J Plant Biol. 2015;58(4):259–269.
- Wang P, Yang CL, Chen H, et al. Transcriptomic basis for drought-resistance in Brassica napus L. Sci Rep. 2017;7(1):40532.
- Qi J, Song CP, Wang B, et al. Reactive oxygen species signaling and stomatal movement in plant responses to drought stress and pathogen attack. J Integr Plant Biol. 2018; 60(9):805–826.
- Zhao Q, Chen W, Bian J, et al. Proteomics and phosphoproteomics of heat stress-responsive mechanisms in spinach. Front Plant Sci. 2018; 9:800.
- Li L, Hou M, Cao L, et al. Glutathione S-transferases modulate Cu tolerance in Oryza sativa. Environ Exp Bot. 2018; 155:313–320.
- Pang Y, Li J, Qi B, et al. Aquaporin AtTIP5,1 as an essential target of gibberellins promotes hypocotyl cell elongation in Arabidopsis thaliana under excess boron stress. Funct Plant Biol. 2018; 45(3):305–314.
- Sun L, Ma L, He S, et al. AtrbohD functions downstream of ROP2 and positively regulates waterlogging response in Arabidopsis. Plant Signal Behav. 2018; 13(9):1–5.
- Wang TP, Liu H, Hua HJ, et al. A vacuole localized beta-glucosidase contributes to drought tolerance in Arabidopsis. Chin Sci Bull. 2011;56(33):3538–3546.
- Lü D, Wang W, Miao C. ATHK1 acts downstream of hydrogen peroxide to mediate ABA signaling through regulation of calcium channel activity in Arabidopsis guard cells. Chin Sci Bull. 2013; 58(3):336–343.
- Ma XN, Zhang XR, Yang L, et al. Hydrogen peroxide plays an important role in PERK4-mediated abscisic acid-regulated root growth in Arabidopsis. Funct Plant Biol. 2019; 46(2):165–174.
- Zhou HR, Xu M, Hou RX, et al. Thermal acclimation of photosynthesis to experimental warming is season dependent for winter wheat (Triticum aestivum L.). Environ Exper Bot. 2018; 150:249–259.
- Zhang H, Yue MX, Zheng XK, et al. The role of promoter-associated histone acetylation of haem oxygenase-1 (HO-1) and giberellic acid-stimulated like-1 (GSL-1) genes in heat-induced lateral root primordium inhibition in maize. Front Plant Sci. 2018; 9:1520.
- Lin DL, Xia JY, Wan SQ. Climate warming and biomass accumulation of terrestrial plants: a meta-analysis. New Phytol. 2010;188(1):187–198.
- Han S, Wang CW, Wang WL, et al. Mitogen-activated protein kinase 6 controls root growth in Arabidopsis by modulating Ca2+-based Na+ flux in root cell under salt stress. J Plant Physiol. 2014; 171(5):26–34.
- Xu LH, Wang WY, Guo JJ, et al. Zinc improves salt tolerance by increasing reactive oxygen species scavenging and reducing Na+ accumulation in wheat seedlings. Biol Plant. 2014; 58(4):751–757.
- Gao W, Xu FC, Guo DD, et al. Calcium-dependent protein kinases in cotton: insights into early plant responses to salt stress. BMC Plant Biol. 2018; 18(1):15.
- Li W, Zhao F, Fang W, et al. Identification of early salt stress responsive proteins in seedling roots of upland cotton (Gossypium hirsutum L) employing iTRAQ-based proteomic technique. Front Plant Sci. 2015; 11(6):732.
- Zhao X, Wang YJ, Wang YL, et al. Extracellular Ca2+ alleviates NaCl-induced stomatal opening through a pathway involving H2O2-blocked Na+ influx in Vicia guard cells. J Plant Physiol. 2011; 168(9):903–910.
- Ma L, Zhang H, Sun L, et al. NADPH oxidase AtrbohD and AtrbohF function in ROS-dependent regulation of Na+/K+ homeostasis in Arabidopsis under salt stress. J Exp Bot. 2012; 63(1):305–317.
- Xu F, Liu H, Xu Y, et al. Heterogeneous expression of the cotton R2R3-MYB transcription factor GbMYB60 increases salt sensitivity in transgenic Arabidopsis. Plant Cell Tiss Organ Cult. 2018;133(1):15–25.
- Lv S, Yu D, Sun Q, et al. Activation of gibberellin 20-oxidase 2 undermines auxin-dependent root and root hair growth in NaCl-stressed Arabidopsis seedlings. Plant Growth Regul. 2018;84(2):225–236.
- Zhang J, Wang F, Zhang C, et al. A novel VIGS method by agroinoculation of cotton seeds and application for elucidating functions of GhBI-1 in salt-stress response. Plant Cell Rep. 2018; 37(8):1091–1100.
- Li K, Yang FB, Miao YC, et al. Abscisic acid signaling is involved in regulating the mitogen-activated protein kinase cascade module AIK1-MKK5-MPK6. BMC Plant Biol. 2017; 12(5):e1321188.
- Liu LY, Li N, Yao CP, et al. Functional analysis of the ABA-responsive protein family in ABA and stress signal transduction in Arabidopsis. Chin Sci Bull. 2013;58(31):3721–3730.
- Hao F, Zhao S, Dong H, et al. Nia1 and Nia2 are involved in exogenous salicylic acid-induced nitric oxide generation and stomatal closure in Arabidopsis. J Integr Plant Biol. 2010; 52(3):298–307.
- Song Y, Xiang F, Zhang G, et al. Abscisic acid as an internal integrator of multiple physiological processes modulates leaf senescence onset in Arabidopsis thaliana. Front Plant Sci. 2016; 7:181.
- Zhao X, Li YY, Xiao HL, et al. Nitric oxide blocks blue light-induced K(+) influx by elevating the cytosolic Ca2+concentration in Vicia faba L. guard cells. J Integr Plant Biol. 2013; 55(6):527–536.
- Wang K, He JN, Zhao Y, et al. EAR1 negatively regulates ABA signaling by enhancing 2C protein phosphatase activity. Plant Cell. 2018;30(4):815–834.
- Li W, de Ollas C, Dodd IC. Long-distance ABA transport can mediate distal tissue responses by affecting local ABA concentrations. J Integr Plant Biol. 2018; 60(1):16–33.