
Abstract
Boron (B) is an essential plant micronutrient but studies regarding its transport are still limited to a few plants. This work identified two major B transport sequences in plants, NIP5;1 boric acid channel protein and BOR1 transporter. 80 BOR1 and 34 NIP5;1 homologs were identified in 18 different plant genomes. BOR1 homologs had a HCO3-transporter domain, 649–737 amino-acid residues with mainly basic nature, putative 8–11 transmembrane domains (TMDs) and 11–13 exons. NIP5;1 homologs had a MIP family domain, 294–311 amino-acid residues with basic nature, 5–6 putative TMDs and 3–5 exons. Tyrosine-based motif, acidic di-leucine motif and lysine residue, reported for polarity, vacuolar sorting and B-dependent degradation, were identified in BOR1 homologs. Two NPA motifs and an ar/R selectivity filter with AIGR residues, reportedly essential in B transport, were also found in NIP5;1 homologs. Two NPA motifs in AtNIP5;1 and OsNIP3;1 homologs were NPS and NPV, whereas in sequences homologous to AtNIP6;1 were NPA/V. Besides, ar/R selectivity filters were identified with A(N/S/T)IGR residues in NIP5;1 and NIP3;1 homologs. The BOR1 and NIP5;1 model structures were mainly conserved. Under different perturbations, Arabidopsis thaliana NIP5;1 and NIP6;1 genes demonstrated similar expression patterns although they act in different tissues, suggesting a common regulatory mechanism, whereas BOR1 showed a different expression pattern. BOR1 was substantially expressed in primary root, radicle and flower; NIP5;1 in primary root and roots, and NIP6;1 in petiole. NIP5;1, 6;1 and BOR1 expression in other plant organs implied their involvement in different pathways in addition to B uptake and its mobilization.
Introduction
Boron (B) is an essential micronutrient for plant life cycle and its deficiency or toxicity can cause significant reductions in crop yield and quality [Citation1,Citation2]. It is involved in many metabolic processes, including control of cell wall porosity and tensile strength [Citation3,Citation4], regulation of membrane potential and permeability [Citation5,Citation6], cytoskeleton polymerization [Citation7], nitrogen and ammonium assimilation [Citation8,Citation9], quantitative and qualitative changes of phenolic compounds [Citation10,Citation11] and cellular signaling [Citation12]. In soil solution, it is present as borate or boric acid (B(OH)3) but the latter is the most accepted form by plants. Based on its availability, boric acid can be taken up by three different mechanisms; via diffusion, by major intrinsic proteins (MIP) and by BOR transporters [Citation13,Citation14]. Passive diffusion and MIP transport are employed under the B-sufficient conditions, whereas BOR transporters take role in the B-deficient conditions [Citation15]. In model Arabidopsis thaliana, two transport molecules NIP5;1 and BOR1 have been reported in the B transport [Citation14].
NIP5;1 is a boric acid channel in the MIP family, and it is localized to the plasma membranes of root cap and epidermal cells with outside/soil-facing polarity [Citation16,Citation17]. It was significantly upregulated in the B-deficient roots [Citation18] and from the same family NIP6;1 was also reported to be involved in B distribution but in shoots [Citation14]. The members of MIP/aquaporin family were characterized with six putative transmembrane domains (TMDs) and an Asn-Pro-Ala/Ser/Val (NPA) motif signature [Citation19].
BOR1 transporter was first identified in the B-deficient A. thaliana roots. The AtBOR1 gene includes 12 exons encoding a protein of 704 amino-acid residues with 10 putative TMDs. In addition, six other A. thaliana sequences AtBOR2-7 were also reported to show similarities to AtBOR1 [20]. In rice, NIP3;1 and BOR1 are involved in the B uptake under B-deficiency [Citation20,Citation21] and they also show high similarities to the AtNIP5;1 and AtBOR1 respectively [Citation22]. In grapevine, VvBOR1, an AtBOR1 grapevine orthologue, encodes a 720 amino acid residue protein in the plasma membranes [Citation23]. Moreover, functional BOR1 homologs have also been characterized in some other species such as Saccharomyces cerevisiae [Citation24], Eucalyptus sp. [Citation25] and Brassica napus [Citation26]. Furthermore, maize mutant tls1 was reported to encode a NIP3;1 protein, an AtNIP5;1 orthologue and similarly maize mutant rte was demonstrated to encode a B transporter homologous to AtBOR1 with some vegetative and inflorescence/reproductive defects similar to B-deficiency [Citation27–29].
In the light of the above knowledge, B transport molecules NIP5;1 and BOR1 stood out as significant candidates from agricultural perspective to ameliorate the effects of B-deficiency/toxicity and improve the B tolerance in plants. So, this work identified the homologs of these two molecules in the genomes of 18 different plant species, investigated them at primary, secondary and tertiary structural levels, and evaluated the expression profiles under different perturbations and in different plant tissues/organs.
Materials and methods
Retrieval of boron transport sequences
Two functionally characterized B transport sequences, a boric acid channel AtNIP5-1 (Q9SV84.1) and a BOR transporter AtBOR1 (Q8VYR7.1) were obtained from UniProtKB/Swiss-Prot database of NCBI [Citation30]. These sequences were queried as references in proteome datasets of 18 selected plant species in Phytozome [Citation31] database with an ≤ e−98 threshold, except Chlamydomonas reinhardtii (≤ e−15). Studied plants included Arabidopsis thaliana, Brachypodium distachyon, Brassica rapa, C. reinhardtii, Cucumis sativus, Eucalyptus grandis, Glycine max, Gossypium raimondii, Medicago truncatula, Oryza sativa, Phaseolus vulgaris, Physcomitrella patens, Populus trichocarpa, Prunus persica, Solanum lycopersicum, Sorghum bicolor, Vitis vinifera and Zea mays. Then, genomic, transcript, coding and peptide sequences of those identified B transporters were retrieved for further bioinformatics analyses.
Analysis of boron transport sequences
Physicochemical properties of sequences including sequence length, molecular weight and isoelectric point were calculated using ProtParam tool [Citation32]. Subcellular localizations were predicted by CELLO server [Citation33]. Protein domain families were checked in Pfam database [Citation34]. Exon/intron organizations of genes were analyzed in GSDS 2.0 server [Citation35]. TMDs were predicted using TMHMM server [Citation36]. Conserved motif sequences were predicted using MEME suite [Citation37] with parameters: max motif number, 5 and min-max motif width, 6–50. Protein sequences were aligned by ClustalW [Citation38] and edited by BioEdit Sequence Alignment Editor [Citation39]. Phylogenetic trees were constructed using MEGA 5 [Citation40] with maximum likelihood (ML) method for 1000 bootstraps and visualized using FigTree [Citation41]. 3 D models of protein sequences were predicted by Phyre2 server [Citation42] and visualized by using Pymol [Citation43]. Models were validated with Ramachandran analysis [Citation44]. Secondary structural features of models were analyzed using SOPMA server [Citation45]. Expression profiles of B transport genes BOR1, NIP5;1 and NIP6;1 were investigated using Genevestigator platform in A. thaliana [Citation46].
Results and discussion
Sequence analysis of B transporters
Using a channel protein NIP5;1 and a transporter BOR1 sequence from A. thaliana, a total of 114 B transport genes, including 80 BOR1 () and 34 NIP5;1 () homologs were identified in the genomes of 18 different plant species by homology search. Identified genes were distributed as per species, C. reinhardtii and P. patens (two genes each), B. distachyon, C. sativus, O. sativa, P. persica, S. lycopersicum, Z. mays and S. bicolor (four genes each), P. vulgaris (seven genes), E. grandis, M. truncatula and V. vinifera (eight genes each), A. thaliana, B. rapa and G. raimondii (nine genes each), G. max (11 genes) and P. trichocarpa (13 genes). All BOR1 homologs were characterized with a HCO3-transporter family (PF00955) domain. BOR1 genes possessed 11–13 exons encoding proteins of 649–737 amino acid residues with 73.2–81.4 kDa molecular weight and 6.27–9.37 pI value, except C. reinhardtii (). C. reinhardtii had a 1032-residue protein with 104 kDa molecular weight. BOR1 homologs were also predicted to localize in the plasma membranes with putative 8–11 TMDs. Earlier works reported that the A. thaliana BOR1 gene has 12 exons encoding a polypeptide of 704 amino-acid residues with 10 putative TMDs and localized to the plasma membrane of pericycle cells [Citation24]. Rice BOR1 encodes 711 amino-acid residues with putative 10 TMDs localized to the plasma membrane [Citation20]. VvBOR1, a grapevine orthologue of AtBOR1, encodes a protein of 720 amino acid residues in the plasma membranes [Citation23]. In a different study, maize mutant rte was reported to encode a membrane-localized B efflux transporter, which demonstrates high similarity to the AtBOR1 protein [Citation27]. Thus, herein BOR1 homologs showed compliance with findings of the previous works. So, we may report that plant BOR1 homologs could be characterized with 11–13 exons encoding 649–737 amino-acid residues with a HCO3-transporter family domain and putative 8–11 TMDs.
Table 1. Putative BOR1 homologs in 18 different plant species and their gene/protein features.
Table 2. Putative NIP5;1 homologs in 18 different plant species and their gene/protein features.
Besides, homologs of boric acid channel NIP5;1 proteins were characterized with a MIP family (PF00230) domain [Citation47]. NIP5;1 genes possessed 3–5 exons encoding a protein of 294–311 amino-acid residues with 30.2–32.2 kDa molecular weight and 8.26–9.22 pI value, except a V. vinifera (GSVIVT01034224001) member with 354 amino-acid residues and 37.3 kDa molecular weight (). NIP5;1 homologs were predicted to be localized in the plasma membranes with putative 5–6 TMDs. In previous studies, NIP5;1 was reported to be a boric acid channel in the MIP family [Citation18]. It is localized to the plasma membranes of root cap and epidermal cells with outside/soil-facing polarity [Citation17]. MIP members were characterized with six putative TMDs and an NPA motif signature [Citation19]. NIP5;1 sequences were identified in a number of species with common NPA motif, including Z. mays (NCBI access: AFW61239; 296 amino acids), S. lycopersicum (access: BAO18646; 295 aa), A. thaliana (access: AEE82874; 304 aa), Nicotiana tabacum (access: AIL50151; 297 aa), Glycine soja (access: KHN46385; 299 aa), Gossypium arboreum (access: KHG22884; 298 aa), Lotus japonicus (access: ABY19373; 302 aa) and Morus notabilis (access: EXB56000; 298 aa). Thus, we mention that NIP5;1 homologs in plants could be identified with a MIP family domain, 294–311 residues protein with basic nature, putative 5–6 TMDs, 3–5 exons and a NPA motif.
Conserved motifs in B transport sequences
To figure out the conserved sequences in B transporters, most conserved five motifs were identified in the BOR1 and NIP5;1 homologs (). In BOR1 homologs, motifs 1–4 were related with the HCO3-transporter (PF00955) family domain, whereas motif 5 did not relate to any protein family. Besides, five motifs were present in all BOR1 sequences. In NIP5;1 homologs, motif 1, 2 and 4 were associated with the MIP family (PF00230) domain, whereas motif 3 and 5 did not relate to any protein family. Except for motifs 3–5 in C. reinhardtii, five motifs were conserved in all NIP5;1 sequences. In addition, the width of the identified motifs in both BOR1 and NIP5;1 homologs were relatively long, giving clues about the well conserved nature of B transport sequences in plants (also refer to Supplemental Figures S1 and S2).
Table 3. Five most conserved motifs in BOR1 and NIP5;1 homologs in 18 different plant species.
To further investigate the protein sequence conservancy, BOR1 and NIP5;1 homologs in 18 plant species were aligned by ClustalW, and identical and similar residues were shaded in black and gray respectively. In aligned BOR1 homologs (Supplemental Figure S1), residues Val (V), Leu (L), Met (M), His (H), Pro (P), Arg (R), Gly (G), Gln (Q), Glu-Gln-Arg (EQR), Gly-Tyr-Phe (GYF), Phe-Thr (FT), Phe-Pro (FP) and Leu-Asp (LD) were found to be fully preserved in sequences of all 18 plant species. It has been reported that three motif sequences such as tyrosine-based motif (YxxM/L; Y/FxxML), acidic di-leucine motif (D/ExxxLL) and lysine residue (N/FKx) are required for polarity and vacuolar sorting in AtBOR1 [Citation17,Citation48–50]. In BOR1 sequences, we have identified two tyrosine-based motifs similar to the sequences identified by Wakuta et al. [Citation50]. In first tyrosine-based motif, YxxM signature was present in all AtBOR1 homologs, whereas YxxL was in homologs of AtBOR4-7. However, a second tyrosine-based motif, Y/F/IxxM was present in BOR1 homologs with some displacements. In addition, acidic di-leucine motif and lysine residue were also identified in BOR1 sequences. Thus, given motifs may also be responsible for polarity and vacuolar sorting in some homologs.
In aligned NIP5;1 homologs (Supplemental Figure S2), residues Ile (I), His (H), Tyr (Y), Gln (Q), Pro (P), Leu (L), Glu (E), Phe (F), Ala (A), Gly (G), Gly-Thr (GT), Trp/Phe-Val/Ile/Leu-Tyr (WVY), Ile-Ser-Gly-Ala-His-Leu/Val-Asn-Pro-Ser/Ala-Leu/Val/Ile-Thr (ISGAHLNPSLT) and Ser-Met/Leu-Asn-Pro-Val/Ala-Arg-Thr/Ser-Leu/Ile-Gly-Pro-Ala-Val/Ile/Leu (SMNPVRTLGPAV) were highly conserved in all aligned sequences. Studies showed that two Asn-Pro-Ala (NPA) motifs and an ar/R selectivity filter are essential in B transport in boric acid channels. NPA motifs were reported to form one of the major constriction pores in MIP proteins [Citation19,Citation51–53]. Hanaoka et al. [Citation21] demonstrated that in cereals and eudicots, two NPA motifs such as NPS and NPV were identical among OsNIP3;1 and AtNIP5;1 orthologues. However, two NPA motifs in OsNIP3;1 paralogs such as OsNIP3;2 and 3;5 were NPA, whereas in AtNIP6;1 paralogs were NPA and NPV. In this study, NPA motifs in AtNIP5;1 and OsNIP3;1 homologs were NPS and NPV, whereas in sequences homologous to AtNIP6;1 were NPA and NPV. Besides, an ar/R selectivity filter was also reported to form another constriction region with four residues in boric acid channels [Citation51]. Residues A, I, G and R were shown to be conserved in NIP5;1 and NIP3;1 orthologues in eudicots and major cereals [Citation21]. Herein, similar residues of ar/R selectivity filter in NIP5;1 and NIP3;1 homologs were also identified. Overall indicated that two NPA motifs and an ar/R selectivity filter are also preserved in the studied sequences, showing their essentiality in B transport of boric acid channels. Furthermore, all given motifs in BOR1 and NIP5;1 homologs could be also used as signatures in characterization of B transporter and boric acid channels in other uncharacterized plants.
Phylogenetic distribution of B transport sequences
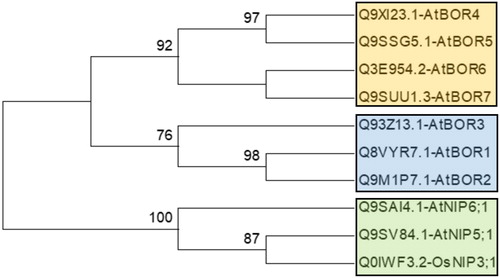
The BOR1 and NIP5;1 homologs identified in 18 plant species herein were phylogenetically analyzed using MEGA 6 with the ML method. In the phylogenies, sequences were annotated along with their respective homologs in A. thaliana or O. sativa since B transport sequences in those two species were well characterized. Homology information was used as benchmark to figure out the clustering pattern of the studied sequences. Initially, a preliminary phylogeny was constructed with known B transport sequences of A. thaliana and O. sativa to have insights about their phylogenetic relationship, thereby the sequence similarities among them ().
Figure 1. Phylogenetic distribution of known BOR transporter and boric acid channel proteins in Arabidopsis thaliana and Oryza sativa. Phylogeny was constructed by MEGA 6 using ML method for 1000 bootstraps. This tree is used as benchmark to determine the clustering pattern of studied sequences.
The phylogenetic tree of BOR1 homologs demonstrated three major clusters (), namely group A (blue segment), B (green segment) and C (red segment). Group A included the AtBOR1-3 homologs without any monocot/dicot separation. Besides, the sequences homologous to AtBOR1 and AtBOR2 were clustered more relatedly than AtBOR3. Preliminary phylogeny also corroborated this (), in which AtBOR1 and AtBOR2 sequences demonstrated more similarity to each other and were closely related with AtBOR3. Group B included the AtBOR4-7 homologs without any monocot/dicot separation. In addition, AtBOR4 and AtBOR5 homologs in this group were similar to each other more than the homologs of AtBOR6 and AtBOR7. Preliminary phylogeny () also showed similar distribution, thereby explaining the clustering pattern of the sequences in this group. However, group C only included sequences from the lower plants C. reinhardtii (green algae) and P. patens (moss) although they showed some similarities to AtBOR1 and AtBOR2 respectively. This indicated the presence of a separation between lower and higher plants for BOR1 transporters. Many previous works also made indications similar to the above. Nakagawa et al. [Citation20] demonstrated that AtBOR1-3 are more closely related than AtBOR4-7. AtBOR1-3, OsBOR1 and TaBOR1.1-3 sequences were more closely related than AtBOR4-7 and OsBOR2-4 [Citation54]. Pérez-Castro et al. [Citation23] reported similar findings for VvBOR1 compared to the A. thaliana BOR sequences.
Figure 2. Phylogenetic distribution of BOR1 homologs in 18 different plants. Sequences were annotated along with respective homologs in Arabidopsis thaliana. Homology information is used as benchmark to determine the clustering pattern of the studied sequences. Circular phylogeny was constructed by MEGA 6 with ML method for 1000 bootstraps and visualized by FigTree. Blue, green and red segments respectively represent group A, B and C.
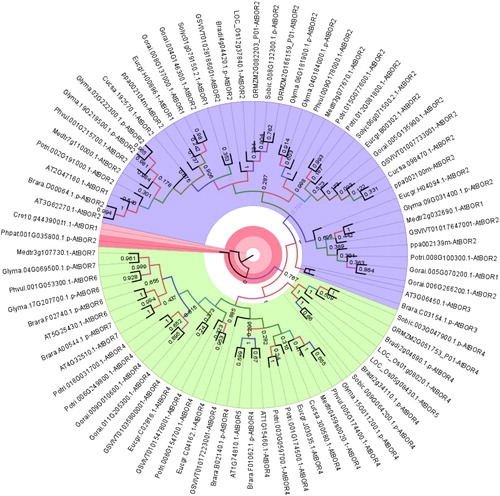
Furthermore, AtBOR4, a BOR1 paralog of A. thaliana, demonstrated B transport activity in transgenic lines [Citation55]. It was also suggested that BOR4 could not be degraded in the posttranslational BOR1 system [Citation56]. Miwa et al. [Citation57] reported that in high B-availability, BOR4-overexpressing plants have more capability to expand their leaves and accumulate chlorophyll in shoot tissues. This suggested that group B members, including AtBOR4-7 homologs could be involved in various metabolic functions. Moreover, three different clades of B transporters were reported by Wakuta et al. [Citation50]. Clade I included AtBOR1, 2 and OsBOR1 proteins functioning in B-limited conditions [Citation20,Citation24,Citation57]. Clade II had AtBOR4 and HvBot1 sequences involved in high B tolerance [Citation56,Citation58] and this clade also included OsBOR4, which is required for pollen germination and/or tube elongation [Citation59]. Clade III included PpBOR1 and PpBOR2. In the light of these studies, the distribution of the BOR1 homologs studied here () also made similar indications, in which the AtBOR1-3 homologs were in group A and the AtBOR4-7 homologs in group B, and group C only had lower plants. It was also implied that plants could acquire two types of B transport mechanisms, one for the low B-availability and another for the high B-tolerance conditions.
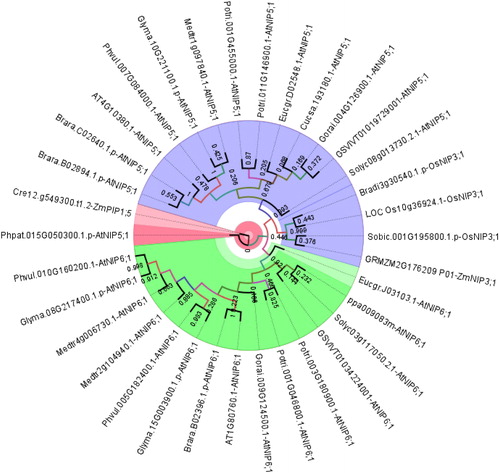
Phylogeny of NIP5;1 homologs also showed three major clusters (), namely group A (blue segment), B (green segment) and C (red segment). Group A included sequences homologues to AtNIP5;1, OsNIP3;1 and ZmNIP3;1 without any monocot/dicot separation, whereas group B only had AtNIP6;1 homologs with dicots. Preliminary phylogeny () indicated that AtNIP5;1 and OsNIP3;1 are more similar to each other and closely related with AtNIP6;1. This also explains the sequence distribution in group A and B. In studies, from NIP genes of 10 O. sativa and nine A. thaliana entries, AtNIP5;1 was more similar to OsNIP3;1 [Citation60]. In a different study, OsNIP3;1 was highly similar to AtNIP5;1 and AtNIP6;1, with 86.2% and 80.0% similarity respectively [Citation21]. Besides, group C only had sequences of lower plants P. patens (moss) and C. reinhardtii (green algae), indicating a lower/higher plant separation in plants for boric acid channels.
Figure 3. Phylogenetic distribution of NIP5;1 homologs in 18 different plants. Sequences were annotated along with respective homologs in Arabidopsis thaliana or Oryza sativa. Homology information is used as benchmark determine the clustering pattern of the studied sequences. Circular phylogeny was constructed by MEGA 6 with the ML method for 1000 bootstraps and visualized by FigTree. Blue, green and red segments respectively represent group A, B and C.
Homology modeling of B transport sequences
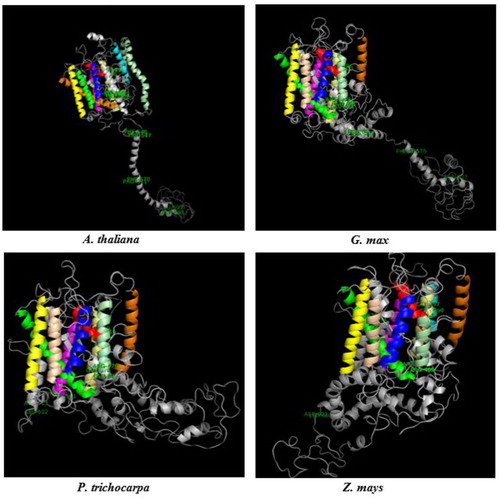
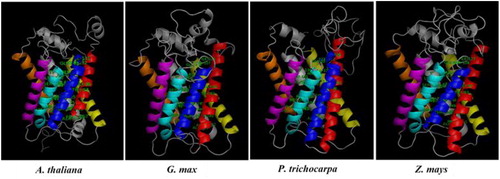
Putative 3 D models were constructed by Phyre2 server using sequences from the selected four plants, including dicots A. thaliana and G. max, monocot Z. mays, and tree species P. trichocarpa. BOR1 models were generated from sequences, AT2G47160.1 (A. thaliana), Glyma.06G181900.1.p (G. max), Potri.002G191000.1 (P. trichocarpa) and GRMZM2G082203_P01 (Z. mays) based on a single template 4YZF, whereas NIP5;1 models were generated from sequences, AT4G10380.1 (A. thaliana), Glyma.10G221100.1.p (G. max), Potri.001G455000.1 (P. trichocarpa) and GRMZM2G176209_P01 (Z. mays) based on the templates 2B6P, 2W2E, 1J4N, 2F2B, 1YMG, 1LDA and 1FX8. Model qualities were validated by Ramachandran plot analysis, the number of allowed residues in BOR1 and NIP5;1 models were calculated as ≥88.1 and ≥95.3% respectively. This implicated the fairly good structures of the generated models. In BOR1 models, 10 putative TMDs were predicted in 3 D structures, each indicated by a different color (). The fully conserved residues identified in the alignment analysis (Supplemental Figure S1) were mapped on the models to show their localization, thereby providing insight into their significance. These residues included Glu-Gln-Arg (EQR) located partially in the TMD9 and loop region, Gly-Tyr-Phe (GYF) in the TMD10, Phe-Thr (FT) in the non-TM helix, Phe-Pro (FP) in the non-TM helix or loop, and Leu-Asp (LD) in the loop. Protein domain analysis demonstrated that these conserved residues approximately correspond to the sites in the HCO3-transporter domain, thereby they may play important role/s in the B transport. In addition, secondary structural features in BOR1s, including α-helix, extended strand, β-turn and random coil respectively, were calculated as 48.15%, 13.64%, 6.68% and 31.53% in A. thaliana, 46.33%, 14.25%, 5.26% and 34.16% in G. max, 46.92%, 13.95%, 6.57% and 32.56% in P. trichocarpa, and 51.00%, 14.25%, 7.41% and 27.35% in Z. mays. Despite of some divergences in the secondary structural features and 3 D topologies, the analyzed BOR1 models seemed not to have substantial structural variations.
Figure 4. 3 D models of BOR1 transporters from Arabidopsis thaliana, Glycine max, Populus trichocarpa and Zea mays. TMDs were specified with different colors, TMD1 with red, TMD2 with blue, TMD3 with yellow, TMD4 with magenta, TMD5 with cyan, TMD6 with orange, TMD7 with green, TMD8 with wheat, TMD9 with pale green, TMD10 with pale yellow, and other structures with gray. Labeled residues show the potential motif signatures identified in alignment analysis.
However, NIP5;1 models were predicted to have six putative TMDs with very similar structures (). The fully conserved residues revealed in the alignment analysis (Supplemental Figure S2) were also mapped on the models. They comprised of residues Gly-Thr (GT) located in the TMD1, Trp/Phe-Val/Ile/Leu-Tyr (WVY) in the TMD6, Ile-Ser-Gly-Ala-His-Leu/Val-Asn-Pro-Ser/Ala-Leu/Val/Ile-Thr (ISGAHLNPSLT) in the TMD2, non-TM helix and loop, and Ser-Met/Leu-Asn-Pro-Val/Ala-Arg-Thr/Ser-Leu/Ile-Gly-Pro-Ala-Val/Ile/Leu (SMNPVRTLGPAV) in the non-TM helix and loop. These residues were also found to locate in a region of MIP family domain, thereby they might be inferred with a functional role in the transport of B or other molecules. In addition, α-helix, extended strand, β-turn and random coil respectively in the NIP5;1 models were calculated as 28.29%, 24.67%, 7.24% and 39.80% in A. thaliana, 33.44%, 21.40%, 7.36% and 37.79% in G. max, 38.46%, 16.39%, 6.69% and 38.46% in P. trichocarpa, and 33.44%, 15.23%, 7.62% and 43.71% in Z. mays. Some structural variations were also present in NIP5;1 models; however they were highly conserved compared to the BOR1 models.
Figure 5. 3 D models of NIP5;1 boric acid channels from Arabidopsis thaliana, Glycine max, Populus trichocarpa and Zea mays. TMDs were specified with different colors, TMD1 with red, TMD2 with blue, TMD3 with yellow, TMD4 with magenta, TMD5 with cyan, TMD6 with orange and other structures with gray. Labeled residues show the potential motif signatures identified in alignment analysis.
Expression profiles of B transport genes
The expression profiles of B transport genes BOR1, NIP5;1 and NIP6;1 were investigated in the model organism A. thaliana under various biotic/abiotic stress conditions () and in different anatomical plant parts () using “Affymetrix A. thaliana ATH1 Genome Array” from Genevestigator platform. Seventy-eight different perturbations from biotic, chemical, elicitor, hormone, light, nutrient, photoperiod and other stresses were analyzed with an applied threshold of -2 ≤ x ≥ 2 log2 fold-change. Some studied genes were previously reported for their involvement in B transport. For example, AtBOR1 gene was mainly expressed in the A. thaliana roots under B-deficiency [Citation24,Citation61]. The protein encoded by NIP5;1 was localized to the plasma membrane of the root cap and epidermal cells, and was significantly upregulated in B-deficient conditions, and the protein encoded by NIP6;1 was involved in B distribution but in the shoots [Citation14,Citation17,Citation18].
Figure 6. Gene expression profiles (A) and expressed anatomical parts (B) of Arabidopsis thaliana B transport genes BOR1, NIP5;1 and NIP6;1 under 78 different perturbations, including biotic, chemical, elicitor, hormone, light, nutrient, photoperiod and other stresses. In expression heatmap (A), conditions (left) and genes (top) with similar expression profiles were hierarchically clustered using Euclidean distance method. Green color indicates the downregulated genes and red color shows the upregulated genes. In anatomical part heatmap (B), blue circles with letter “i” indicate the presence of multiple hierarchical categories for related anatomical parts. For example, seedling > hypocotyl or shoot > hypocotyl.
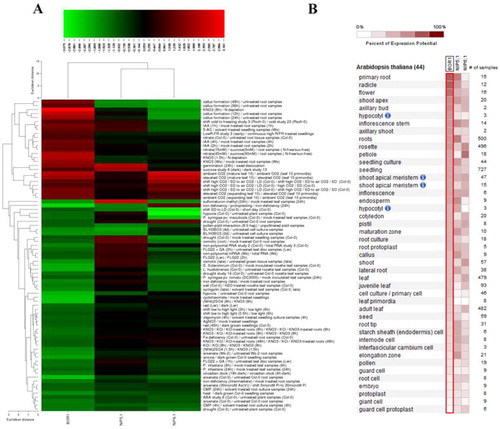
Herein, the expression profiles of NIP5;1 and NIP6;1 genes demonstrated similar expression pattern although they were implicated in different tissues. This suggests the presence of a common regulatory mechanism. However, BOR1 showed a different expression pattern; considering its function in B uptake against the concentration gradient [Citation14], it thus is reasonable to represent a different expression pattern compared to the NIP5;1 and NIP6;1. The given perturbations usually downregulated the NIP5;1, 6;1 and BOR1 genes. Especially, some chemical, biotic, deficiency, light, photoperiod and hormone stresses considerably downregulated these genes [Citation61]. However, it seemed that the intensity or the duration of the stress factor rather than its particular type is more effective in exciting the expression of B responsive genes. Moreover, it was interesting that NIP5;1 and BOR1 demonstrate different expression patterns although they collaboratively function in B uptake from soil and its loading into xylem under B-deficiency respectively. This implicates the possibility of involvement of other factors in B homeostasis. In plant parts, NIP5;1, 6;1 and BOR1 genes were expressed in 44 different anatomical parts in A. thaliana at different levels. BOR1 was substantially expressed in the primary root, radicle and flower; NIP5;1 showed high expression in the primary root and roots, and NIP6;1 was in petioles. In addition, all three genes also demonstrated some degree of expression in other plant organs, which may also infer different roles. However, the expression levels of these genes in different plant parts were mainly in agreement with the previous reports, in which BOR1 and NIP5;1 were reported to be mainly expressed in B-deficient plant roots, whereas NIP6;1 was involved in B-distribution in shoots [Citation14,Citation16,Citation18,Citation24]. Thus, the findings from this study suggested the roles of BOR1 and NIP5;1 in B uptake and its mobilization, and they also made implications about the possibility of NIP5;1, 6;1 and BOR1 involvement in some other stress responsive mechanisms.
Conclusions
B is an essential plant micronutrient and its deficiency/toxicity leads to significant reductions in crop yield and quality. However, studies about B transporters are limited to some species such as A. thaliana, O. sativa, V. vinifera and Z. mays. Thus, the present work identified and characterized 80 BOR1 and 34 NIP5;1 homologs from 18 different plant species. Using known B transport sequences from A. thaliana and O. sativa at cross-translational way made substantial contributions in interpretation of the identified BOR1 and NIP5;1 homologs. BOR1 and NIP5;1 sequences preserved the earlier reported motif signatures, which inferred roles in polarity and vacuolar sorting, and B transport. Some structural divergences were present in BOR1 and NIP5;1 models but they appeared not to be subjected to substantial changes. Temporal and spatial expression of A. thaliana NIP5;1, 6;1 and BOR1 genes implicated their involvement in the stress responsive mechanisms. This work provided knowledge about the primary, secondary and tertiary structures of B transport sequences in various plants, thereby it is thought to contribute to further manipulations of those genes for molecular or agricultural purposes.
Supplemental Material
Download PDF (78.2 KB)Supplemental Material
Download PDF (211.6 KB)Disclosure statement
No potential conflict of interest was reported by the authors.
Related Research Data
References
- Camacho‐Cristóbal JJ, Rexach J, González‐Fontes A. Boron in plants: deficiency and toxicity. J Integr Plant Biol. 2008;50(10):1247–1255.
- Matthes MS, Robil JM, McSteen P. From element to development: the power of the essential micronutrient boron to shape morphological processes in plants. J Exp Bot. 2020;71(5):1681–1693.
- Fleischer A, O'Neill MA, Ehwald R. The pore size of nongraminaceous plant cell walls is rapidly decreased by borate ester cross-linking of the pectic polysaccharide rhamnogalacturonan II. Plant Physiol. 1999;121(3):829–838.
- Ryden P, Sugimoto-Shirasu K, Smith AC, et al. Tensile properties of Arabidopsis cell walls depend on both a xyloglucan cross-linked microfibrillar network and rhamnogalacturonan II-borate complexes. Plant Physiol. 2003;132(2):1033–1040.
- Ferrol N, Donaire JP. Effect of boron on plasma membrane proton extrusion and redox activity in sunflower cells. Plant Sci. 1992;86(1):41–47.
- Wang ZY, Tang YL, Zhang FS, et al. Effect of boron and low temperature on membrane integrity of cucumber leaves. J Plant Nutr. 1999;22(3):543–550.
- Bassil E, Hu H, Brown PH. Use of phenylboronic acids to investigate boron function in plants. Possible role of boron in transvacuolar cytoplasmic strands and cell-to-wall adhesion. Plant Physiol. 2004;136(2):3383–3395.
- Shen ZG, Liang YC, Shen K. Effect of boron on the nitrate reductase-activity in oilseed rape plants. J Plant Nutr. 1993;16(7):1229–1239.
- Camacho-Cristóbal JJ, González-Fontes A. Boron deficiency decreases plasmalemma H+-ATPase expression and nitrate uptake, and promotes ammonium assimilation into asparagine in tobacco roots. Planta. 2007;226(2):443–451.
- Camacho-Cristóbal JJ, Anzellotti D, González-Fontes A. Changes in phenolic metabolism of tobacco plants during short-term boron deficiency. Plant Physiol Biochem. 2002;40(12):997–1002.
- Pasković I, Soldo B, Talhaoui N, et al. Boron foliar application enhances oleuropein level and modulates volatile compound composition in olive leaves. Sci Hortic. 2019;257:108688.
- Gonzalez-Fontes A, Rexach J, Navarro-Gochicoa MT, et al. Is boron involved solely in structural roles in vascular plants? Plant Signal Behav. 2008;3(1):24–26.
- Aibara I, Hirai T, Kasai K, et al. Boron-dependent translational suppression of the borate exporter BOR1 contributes to the avoidance of boron toxicity. Plant Physiol. 2018;177(2):759–774.
- Tanaka M, Fujiwara T. Physiological roles and transport mechanisms of boron: perspectives from plants. Pflugers Arch. 2008;456(4):671–677.
- Dannel F, Pfeffer H, Romheld V. Update on boron in higher plant-uptake, primary translocation and compartmentation. Plant Biol. 2002;4(2):193–204.
- Sabir F, Gomes S, Loureiro-Dias MC, et al. Molecular and functional characterization of grapevine nips through heterologous expression in aqy-null Saccharomyces cerevisiae. IJMS. 2020;21(2):663–682.
- Takano J, Tanaka M, Toyoda A, et al. Polar localization and degradation of Arabidopsis boron transporters through distinct trafficking pathways. Proc Natl Acad Sci Usa. 2010;107(11):5220–5225.
- Takano J, Wada M, Ludewig U, et al. The Arabidopsis major intrinsic protein NIP5;1 is essential for efficient boron uptake and plant development under boron limitation. Plant Cell. 2006;18(6):1498–1509.
- Kruse E, Uehlein N, Kaldenhoff R. The aquaporins. Genome Biol. 2006;7(2):206–212.
- Nakagawa Y, Hanaoka H, Kobayashi M, et al. Cell-type specificity of the expression of OsBOR1, a rice efflux boron transporter gene, is regulated in response to boron availability for efficient boron uptake and xylem loading. Plant Cell. 2007;19(8):2624–2635.
- Hanaoka H, Uraguchi S, Takano J, et al. OsNIP3;1, a rice boric acid channel, regulates boron distribution and is essential for growth under boron-deficient conditions. Plant J. 2014;78(5):890–902.
- Takano J, Miwa K, Fujiwara T. Boron transport mechanisms: collaboration of channels and transporters. Trends Plant Sci. 2008;13(8):451–457.
- Pérez-Castro R, Kasai K, Gainza-Cortés F, et al. VvBOR1, the grapevine ortholog of AtBOR1, encodes an efflux boron transporter that is differentially expressed throughout reproductive development of Vitis vinifera L. Plant Cell Physiol. 2012;53(2):485–494.
- Takano J, Noguchi K, Yasumori M, et al. Arabidopsis boron transporter for xylem loading. Nature. 2002;420(6913):337–340.
- Domingues DS, Leite SMM, Farro APC, et al. Boron transport in Eucalyptus. 2. Identification in silico of a putative boron transporter for xylem loading in eucalypt. Genet Mol Biol. 2005;28(3 suppl):625–629.
- Sun J, Shi L, Zhang C, et al. Cloning and characterization of boron transporters in Brassica napus. Mol Biol Rep. 2012;39(2):1963–1973.
- Chatterjee M, Tabi Z, Galli M, et al. The boron efflux transporter ROTTEN EAR is required for maize inflorescence development and fertility. Plant Cell. 2014;26(7):2962–2977.
- Durbak AR, Phillips KA, Pike S, et al. Transport of boron by the tassel-less1 aquaporin is critical for vegetative and reproductive development in maize. Plant Cell. 2014;26(7):2978–2995.
- Leonard A, Holloway B, Guo M, et al. Tassel-less1 encodes a boron channel protein required for inflorescence development in maize. Plant Cell Physiol. 2014;55(6):1044–1054.
- Romiti M. Entrez nucleotide and entrez protein FAQs. Gene. 2010;1:270.
- Goodstein DM, Shu S, Howson R, et al. Phytozome: a comparative platform for green plant genomics. Nucleic Acids Res. 2012;40:1178–1186.
- Gasteiger E, Hoogland C, Gattiker A, et al. Protein identification and analysis tools on the ExPASy server. In: Walker John M., editor. The proteomics protocols handbook. NJ, USA: Humana Press; 2005. p. 571–607.
- Yu CS, Chen YC, Lu CH, et al. Prediction of protein subcellular localization. Proteins. 2006;64(3):643–651.
- Sonnhammer EL, Eddy SR, Durbin R. Pfam: a comprehensive database of protein domain families based on seed alignments. Proteins. 1997;28(3):405–420.
- Guo AY, Zhu QH, Chen X, et al. GSDS: a gene structure display server. Yi Chuan. 2007;29(8):1023–1026.
- Krogh A, Larsson B, von Heijne G, et al. Predicting transmembrane protein topology with a hidden markov model: application to complete genomes. J Mol Biol. 2001;305(3):567–580.
- Timothy L, Mikael BB, Buske FA, Frith M, et al. MEME SUITE: tools for motif discovery and searching. Nucleic Acids Res. 2009;37:202–208.
- Thompson JD, Higgins DG, Gibson TJ. CLUSTAL W: improving the sensitivity of progressive multiple sequence alignment through sequence weighting, position-specific gap penalties and weight matrix choice. Nucleic Acids Res. 1994;22(22):4673–4680.
- Hall T. BioEdit: An important software for molecular biology. GERF Bull Biosci. 2011;2:60–61.
- Tamura K, Peterson D, Peterson N, et al. MEGA5: Molecular evolutionary genetics analysis using maximum likelihood, evolutionary distance, and maximum parsimony methods. Mol Biol Evol. 2011;28(10):2731–2739.
- Rambaut A. FigTree. Tree figure drawing tool, v.1.4.0. Institute of Evolutionary Biology, University of Edinburg. 2012. Available from: http://tree.bio.ed.ac.uk/software/figtree/
- Kelley LA, Sternberg MJ. Protein structure prediction on the Web: a case study using the Phyre server. Nat Protoc. 2009;4(3):363–371.
- DeLano WL. The PyMOL molecular graphics system. San Carlos, CA, USA: DeLano Scientific; 2002.
- Lovell SC, Davis IW, Arendall WB, et al. Structure validation by Cα geometry: ϕ, ψ and Cβ deviation. Proteins. 2003;50(3):437–450.
- Combet C, Blanchet C, Geourjon C, et al. NPS@: network protein sequence analysis. Trends Biochem Sci. 2000;25(3):147–150.
- Hruz T, Laule O, Szabo G, et al. Genevestigator v3: a reference expression database for the meta-analysis of transcriptomes. Adv Intel Soft Compu. 2008;2008:1–5.
- Gómez-Soto D, Galván S, Rosales E, et al. Insights into the role of phytohormones regulating pAtNIP5;1 activity and boron transport in Arabidopsis thaliana. Plant Sci. 2019;287:110198
- Kasai K, Takano J, Miwa K, et al. High boron-induced ubiquitination regulates vacuolar sorting of the BOR1 borate transporter in Arabidopsis thaliana. J Biol Chem. 2011;286(8):6175–6183.
- Ou Y, Wu X, Gao Y, et al. Analysis of physiological responses and expression profiling of boron transporter-like genes in response to excess boron in Populus russkii. Chemosphere. 2019;224:369–378.
- Wakuta S, Mineta K, Amano T, et al. Evolutionary divergence of plant borate exporters and critical amino acid residues for the polar localization and Boron-Dependent Vacuolar Sorting of AtBOR1. Plant Cell Physiol. 2015;56(5):852–862.
- de Groot BL, Grubmuller H. Water permeation across biological membranes: mechanism and dynamics of aquaporin-1 and GlpF. Science. 2001;294(5550):2353–2357.
- Gomes D, Agasse A, Thiebaud P, et al. Aquaporins are multifunctional water and solute transporters highly divergent in living organisms. Biochim Biophys Acta. 2009;1788(6):1213–1228.
- Zhu Y-X, Yang L, Liu N, et al. Genome-wide identification, structure characterization, and expression pattern profiling of aquaporin gene family in cucumber. BMC Plant Biol. 2019;19(1):345–368.
- Leaungthitikanchana S, Fujibe T, Tanaka M, et al. Differential expression of three BOR1 genes corresponding to different genomes in response to boron conditions in hexaploid wheat (Triticum aestivum L.). Plant Cell Physiol. 2013;54(7):1056–1063.
- Tahghighi H, Erskine W, Bennett RG, et al. Genetic diversity linked to haplotype variation in the world core collection of Trifolium subterraneum for boron toxicity tolerance provides valuable markers for pasture breeding. Front Plant Sci. 2019;10:1043–1054.
- Miwa K, Takano J, Omori H, Seki M, et al. Plants tolerant of high boron levels. Science. 2007;318(5855):1417–1417.
- Miwa K, Wakuta S, Takada S, et al. Roles of BOR2, a boron exporter, in cross linking of rhamnogalacturonan II and root elongation under boron limitation in Arabidopsis. Plant Physiol. 2013;163(4):1699–1709.
- Sutton T, Baumann U, Hayes J, et al. Boron-toxicity tolerance in barley arising from efflux transporter amplification. Science. 2007;318(5855):1446–1449.
- Tanaka N, Uraguchi S, Saito A, et al. Roles of pollen-specific boron efflux transporter, OsBOR4, in the rice fertilization process. Plant Cell Physiol. 2013;54(12):2011–2019.
- Wallace IS, Choi WG, Roberts DM. The structure, function and regulation of the nodulin 26-like intrinsic protein family of plant aquaglyceroporins. Biochim Biophys Acta. 2006;1758(8):1165–1175.
- Luo J, Liang Z, Wu M, et al. Genome-wide identification of BOR genes in poplar and their roles in response to various environmental stimuli. Environ Exp Bot. 2019;164:101–113.