
Abstract
The evolutionary speed hypothesis (ESH) states that the molecular evolutionary rates of plants in the warm areas are higher than that in the cool areas. Nevertheless, largely due to the scarcity of molecular data from lower taxonomic lineages, ESH remains elusive in plants. In this study, we comprehensively conducted genome-wide comparative analyses of a total of 76 chloroplast (cp) genomes of the bamboos (Poaceae: Bambusoideae), with 10 of them newly generated, to test the ESH via investigating the potential association between their cp genome evolutionary rate and geographical distribution pattern. The results showed extreme heterogeneity of the evolutionary rate within the bamboos, with the lowest value found in temperate bamboos (tribe Arundinarieae) being approximately 1/4 of that in the tropical ones (tribe Olyreae). All the 91 non-coding loci and 75 coding loci evolve consistently faster in tribe Olyreae than that in tribe Arundinarieae. Most of the non-coding (82 out of 91) and coding (73 out of 75) loci in the tropical woody bamboos (tribe Bambuseae) also evolve faster than those in the temperate woody bamboos (tribe Arundinarieae). Moreover, the split of tropical and temperate bamboos was apparently accompanied with the change of cp genome evolutionary rate. This is by far the first case using cp genome data to support the ESH via showing the tropical plants evolve faster than their closely related temperate ones, and will shed new light on our understanding of ESH and the adaptation of plants.
Introduction
It has been historically and ecologically well known for centuries that the plant biodiversity decreases along with the increasing of latitude from the equator to the poles [Citation1,Citation2]. With the advent of high through-put sequencing storm, seeking the causal mechanisms of this so-called common phenomenon at the molecular level becomes urgent [Citation3]. Geographical distribution as an important trait of species reflects the adaptation and evolution of specific species, which is in general imprinted in molecular evolution [Citation4,Citation5]. The evolutionary speed hypothesis (ESH) states that the molecular evolutionary rates are higher among species in the tropics than in other territories [Citation6,Citation7], which influences the biogeographical patterns of diversity associated with latitude, elevation, and ocean depth [Citation8,Citation9]. The ESH is in line with the rate of variation of molecular evolution within several animal lineages, such as mammals, teleost fishes, turtles and hummingbirds [Citation7]. Nonetheless, only very limited studies in plants up until now have indicated the ESH. For example, Davis et al. [Citation10] compared 18S rDNA, plastid rbcL and atpB genes among 86 angiosperm families; Gillman et al. [Citation11] compared ITS and 18S rRNA genes among 45 phylogenetically independent pairs of spermatophytes.
In the plant tree of life, molecular evolutionary rate varies vigorously from interspecific [Citation12,Citation13] to interfamily [Citation14,Citation15] level. Most studies attempting to reveal the association between the evolutionary rate and life-history traits found out that the metabolic rate [Citation16], growth form [Citation17] and body size [Citation18] were potential causes of the rate variation during molecular evolution. Unfortunately, largely due to the scarcity of genome data from a lower plant taxonomic lineage, the association between geographical distribution and molecular evolution remains elusive [Citation6,Citation19]. Whether there is a general trend that tropical plants have faster rate of genome evolution than their closely related temperate ones needs practical data [Citation20,Citation21].
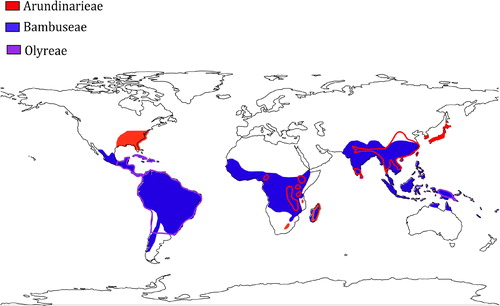
The bamboos, a monophyletic subfamily in the grass family (Poaceae: Bambusoideae), are one optimal group to test the ESH for their large number of species (1,482 species) and broad distribution across the tropical and temperate areas () [Citation22–24]. The best-known bamboos are the woody bamboos that are further divided into two tribes, i.e. tribe Arundinarieae (temperate woody bamboos) and tribe Bambuseae (tropical woody bamboos) according to their distribution [Citation23,Citation25]. The tribe Arundinarieae, containing 546 species, natively occurs in temperate region and alpine regions of the tropics and the tribe Bambuseae, with 812 species, is restricted to tropical areas () [Citation26,Citation27]. Less well studied is the tribe Olyreae (herbaceous bamboos), which grows like perennial grasses and is mainly distributed in neotropics () [Citation13,Citation23]. Discussions about the molecular evolutionary rates and the life-history traits in the bamboos have been ongoing. For instance, negative correlation between molecular evolutionary rates and flowering cycles was argued in Arundinarieae [Citation28]. In addition, the occurrence of long and slender leptomorph rhizome in the Arundinarieae is thought to be related to their long flowering cycles and slow rates of molecular evolution [Citation29,Citation30]. Nevertheless, substitution rate heterogeneity has not yet been investigated among the three bamboo tribes (Arundinarieae, Bambuseae and Olyreae) at the genome level.
Figure 1. Native geographical distribution of the bamboos. Temperate woody bamboos (Arundinarieae), tropical woody bamboos (Bambuseae), and herbaceous bamboos (Olyreae) are colored in red, blue and purple respectively. Areas with red- and purple-line circled are the overlapping area of tribe Arundinarieae (red) and tribe Bambuseae (blue), and the overlapping area of tribe Olyreae (purple) and tribe Bambuseae (blue), respectively. Source: Author.
In the era of high through-put sequencing, obtaining whole chloroplast (cp) genome sequences is convenient and cost-effective [Citation31,Citation32]. In this study, we newly sequenced and assembled 10 complete cp genomes of species in tribe Arundinarieae, and collected another 66 publicly-downloadable bamboo cp genome sequences to characterize the evolutionary rate heterogeneity of their cp genomes among the three bamboo tribes and then to further test the ESH in the bamboos.
Materials and methods
Plant materials and genome sequencing
A total of 76 bamboos were sampled here for comparative genomic analyses, including 43 temperate woody bamboos (Arundinarieae), 20 tropical woody bamboos (Bambuseae) and 13 herbaceous bamboos (Olyreae) (Supplemental Table S1). Ten cp genomes of Ampelocalamus were newly sequenced in this study and the other 66 ones were downloaded from GenBank database. Fresh healthy leaves of A. luodianensis (specimen no.: MPF10052), A. melicoideus (specimen no.: MPF10142) and A. microphyllus (specimen no.: MPF10123) were collected from Kunming Botanic Garden, in Kunming City, Yunnan Province, China in November 2015. Fresh leaves of A. mianningensis (specimen no.: ZXZ11051), A. patellaris (specimen no.: GC138), A. scandens (specimen no.: ZXZ11029), A. hirsutissimus (specimen no.: ZXZ11069), A. breviligulatus (specimen no.: ZXZ11039), A. saxatilis (specimen no.: ZXZ11047) and A. yongshanensis (specimen no.: ZXZ11062) were collected from Sichuan, Yunnan and Guizhou Provinces in June 2011 through field work. After collection, the leaves were immediately dried in silica gel and then stored at -80 °C until use. The voucher specimens were deposited at the Herbarium, Kunming Institute of Botany, Chinese Academy of Sciences.
Total genomic DNA was extracted from silica-dried leaves using the CTAB method [Citation33] for each species. Paired-end (PE) libraries with insert size about 500 base-pair (bp) were constructed upon randomly fragmented genomic DNA, as stated in standard Illumina protocols (Illumina Inc., San Diego, CA, USA). Then the libraries were sequenced on Illumina HiSeq 4000 platform at Novogene (Beijing, China) to generate PE reads with a length of 150 bp.
Chloroplast genome assembly and annotation
After filtration of raw PE reads, CLC Genomics Workbench v7.5 (CLC Bio, Aarhus, Denmark) was used to assemble the 10 newly sequenced cp genomes. De novo and reference-guided assembly strategies were applied according to the following three steps successively: firstly, clean PE reads were assembled into contigs; secondly, contigs with coverage >50 and sequences length >300 bp were further assembled into scaffods; thirdly, the obtained scaffods were aligned to the published cp genome of Phyllostachys edulis (GenBank accession number HQ337796) as a reference by BLAST software (http://blast.ncbi.nlm.nih.gov/) [Citation34] under e-value <10−5. Aligned scaffods with ≥90% similarity and query coverage were further ordered according to the reference genome. Small gaps were filled via PE clean reads mapping, as performed in previous studies [Citation13].
The assembled cp genomes were firstly annotated using DOGMA software [Citation35]. The start/stop codons and intron/exon boundaries were then examined carefully with manual corrections where necessary referring to the P. edulis cp genome (HQ337796). We also used tRNAscan-SE 1.21 [Citation36] to further confirm the annotated tRNA genes.
Phylogenomic analyses
Four closely related grasses, i.e. Agrostis stolonifera (NC_008591), Brachypodium distachyon (NC_011032), Lolium perenne (NC_009950) and Oryza sativa (NC_027678) were used as outgroups to infer the phylogenomic framework of Bambusoideae [Citation24,Citation37]. Full-length cp genomes were aligned with MAFFT program [Citation38] using default settings. The aligned sequences were then checked and adjusted manually where necessary in MEGA v5.2 [Citation39]. Unreliably aligned sequences, long gaps (>3,000 bp) and one of the two identical inverted repeats (IRb) were omitted from the matrix [Citation13].
We conducted phylogenomic analyses using two different methods i.e. ML and Bayesian separately on the CIPRES Science Gateway v3.3 [Citation40]. Firstly, the ML tree was estimated by RAxML v.8.2.8 [Citation41], with cp genome dataset partitioned into three parts corresponding to the large single-copy region (LSC), the small single-copy region (SSC) and the IRa region [Citation42]. We used the GTR + G model of nucleotide substitution following the RAxML manual. Branch supports (MLBS) were calculated by 1,000 fast bootstrap ML replicates. Next, Bayesian inference (BI) was carried out by MrBayes 3.2.6 [Citation43] based on the model GTR + G. We performed two independent Markov Chain Monte Carlo (MCMC) runs with four chains for 100,000,000 generations, sampling once every 1,000 generations, until convergence i.e. the average standard deviation of split frequencies <0.01. The first 25% of trees were discarded as ‘burn in’ and the remaining trees were combined to estimate a 50% majority-rule consensus tree with posterior probabilities (PP).
Rate heterogeneity estimation among lineages
A Bayesian approach was used to further investigate the substitution rate heterogeneity among bamboo lineages in detail. The full cp genome dataset was analysed in BEAST software under a relaxed clock model, the random local clock (RLC) [Citation44,Citation45]. Based on the phylogenetic results of our analysis and previous studies [Citation37,Citation46], four taxon sets were enforced as monophyly: all Bambusoideae taxa, and all taxa of the three tribes Arundinarieae, Bambuseae and Olyreae, respectively. Since relative substitution rates are our target, we fixed the average clock rate at 1.0 and did not use fossil calibrations to estimate the absolute divergence times [Citation28]. Nucleotide substitution model was set as unpartitioned GTR + Γ+I, tree prior as Yule, and other priors as default values. Four independent MCMC runs were implemented, each for 200 million generations with a sampling every 2,000 generations. Tracer v1.5 [Citation47] was used to assess convergence between the runs, with effective sampling size (ESS) exceeding 200 for all parameters. After discarding the first 80 million generations in individual runs as ‘burn in’, the remaining trees were combined with LogCombiner (within BEAST) and summarized in TreeAnnotator (within BEAST).
Consistent evolutionary pattern detection
Since all the 76 bamboos sampled here (Supplemental Table S1) have had the same length of time to evolve from their shared common ancestor with outgroups, e.g. Oryza sativa [Citation37,Citation46], the sequence variations between each tribe and O. sativa can thus reflect their relative evolutionary rates [Citation20,Citation28]. To determine whether patterns of rate heterogeneity are correlated among different cp DNA regions, we partitioned the cp genome into five parts, i.e. LSC, SSC, IRs (here in terms of IRa), coding and non-coding regions, and estimated their substitution rates, respectively. We firstly used Geneious v10.0 [Citation48] to extract the LSC, SSC, IRa, coding and non-coding region, respectively from each bamboo cp genome. Then multiple alignments were constructed between the three bamboo tribes (Arundinarieae, Bambuseae and Olyreae) and O. sativa individually, for each cp genome region. A total of 15 matrices were finally obtained and imported into MEGA v5.2 [Citation39] one by one to count the numbers of constant and variable sites. The relative substitution rate was calculated as: rate = (NS/L) × 100, where NS is the number of nucleotide substitutions, in terms of single nucleotide polymorphisms (SNPs), and L is the aligned sequence length [Citation49–51].
Furthermore, to investigate the pattern of rate variation in more detail, the cp genome was divided into individual coding loci (exon) and non-coding loci (intergenic regions and introns). We compared each cp DNA locus of Arundinarieae, Bambuseae and Olyreae to its homologous locus of O. sativa, respectively. Both the coding and non-coding loci in each cp genome were firstly extracted separately in DOGMA software by using the ‘Extract Sequences’ option [Citation35]. Then homologous loci were aligned individually using MUSCLE program [Citation52] in Geneious v10.0 [Citation48]. Each generated alignment was examined carefully and adjusted manually where necessary in Geneious v10.0 [Citation48]. The number of SNPs in each locus was finally tallied using MEGA v5.2 [Citation39]. We calculated the relative substitution rate for each coding and non-coding locus, respectively as the above.
Geographical distribution mapping
The state of geographical distribution for bamboos was grouped into two categories, tropical and temperate (Supplemental Table S1), and determined based on published literature [Citation23,Citation53,Citation54]. We scored tropical distribution as 0 and temperate distribution as 1 [Citation27,Citation55]. The alpine distribution of two temperate woody bamboos (Arundinarieae) in Africa, i.e. Bergbambos tessellata and Oldeania alpine, was simply treated as temperate distribution for analogous environment [Citation27,Citation54,Citation55]. Ancestral geographical distribution was subsequently reconstructed in Mesquite v2.75 [Citation56] by using the ‘Trace character history’ option. Geographical distribution was optimized on the ML tree of Bambusoideae with outgroups being trimmed.
Results and discussion
Remarkable rate heterogeneity in subfamily bambusoideae
About 4.6 gigabase (Gb) data, circa 20 million clean PE reads in the length of 150 bp were generated on the Illumina HiSeq 4000 platform for each species. Based on the combination of de novo and reference-assisted assembly strategy, cp genomes of 10 temperate woody bamboos were successfully obtained and circular maps of cp genomes were subsequently made without gaps. Sequences of the 10 newly assembled cp genomes have been deposited in GenBank (accession numbers: MK393365- MK393374, Supplemental Table S1). The structure of cp genome is highly conserved in bamboos [Citation49], showing a typical quadripartite organization consisting of LSC, SSC, IRa and IRb [Citation57]. Here we found simialr genome size (1,39,311 bp–1,39,643 bp), and same number of genes (129) and GC content (38.9%) in the 10 newly sequenced cp genomes of Arundinarieae (), consistent with results of previous studies [Citation58,Citation59].
Table 1. Genome assembly, annotation and characters of the 10 newly sequenced bamboo chloroplast genomes.
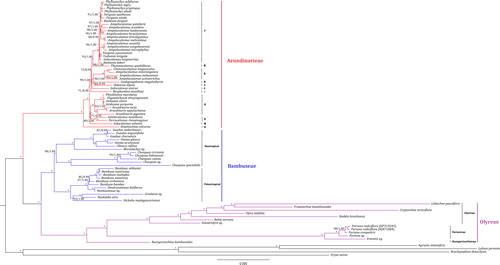
Seventy-six cp genomes of Bambusoideae (Supplemental Table S1), including the newly assembled 10 bamboos, were used to reconstruct the phylogenomic framework of Bambusoideae and infer the evolutionary pattern of cp genome. ML and BI analyses generated a congruent phylogenomic tree (). The monophyly of the three bamboo tribes, i.e. Arundinarieae, Bambuseae and Olyreae, and the sister relationship between Bambuseae and Olyreae were all highly supported (100/1.00) as stated previously [Citation23,Citation26,Citation60]. In tribe Arundinarieae, 11 accepted lineages (I to XI) were revealed, among which lineage XI (Hsuehochloa calcarea) diverged first (100/1.00), similar to previous findings [Citation27,Citation42,Citation55]. In tribe Bambuseae, two major clades corresponding to the paleotropical and neotropical woody lineages were uncovered (98–100/1.00), consistent with previous studies [Citation61,Citation62]. Tribe Olyreae was resolved into three subtribes, i.e. Buergersiochloinae, Parianinae and Olyrinae, each having high statistic supports (100/1.00), in agreement with recent studies [Citation13,Citation46].
Figure 2. Maximum likelihood (ML) phylogram for Bambusoideae based on whole chloroplast genomes of 76 bamboos and four outgroups. Values above the branches are maximum likelihood bootstrap (MLBS)/Bayesian inference posterior probability (PP). * indicates nodes with both maximum ML and Bayesian support values.
Interestingly, highly heterogeneous branch lengths were exhibited for the three Bambusoideae tribes (), implying lineage-specific rates of cp genome evolution. Relative substitution rates of cp genome were further reconstructed for each Bambusoideae lineage to quantify the rate heterogeneity. The result () confirmed the branch length variations we observed in the ML tree (). The number of rate shifts across the Bambusoideae was estimated to be 33 with 95% highest posterior density (HPD) interval of 31–36. Different evolutionary rates were estimated for Arundinarieae, Bambuseae and Olyreae, respectively, showing that woody bamboos (Arundinarieae and Bambuseae) have lower evolutionary rates but herbaceous Olyreae have a higher rate (), agreeing with the result obtained from two plastid genes (rbcL and ndhF) [Citation22]. The highest rate value (2.42) was found in tribe Olyreae, whereas the lowest rate value (0.60) occurred in tribe Arundinarieae, with about four-fold difference (). Likewise, a circa three-fold rate variation was also found between the earliest diverging lineage XI and the most species-rich lineage V within tribe Arundinarieae (), in agreement with a recent study focusing on the temperate woody bamboos [Citation28].
Figure 3. Relative evolutionary rate of chloroplast genome among the major lineages of Bambusoideae from Bayesian analysis. Values above the branches are the estimated median rate of each corresponding branch. Branch thickness is proportional to the evolutionary rate.
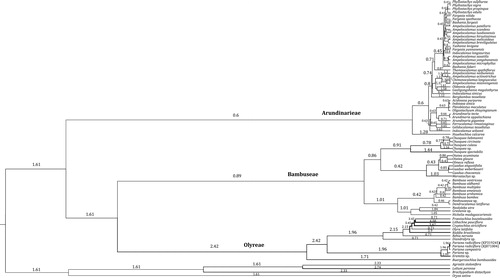
Although many studies revealed rate heterogeneity of molecular evolution in a broad range of plant groups from above the family level [Citation14,Citation15,Citation63,Citation64], understanding this phenomenon at a lower taxonomic level in plants, e.g. within a subfamily, remains challenging [Citation21,Citation65]. Here we uncovered extensive rate variation in the extraordinary grass subfamily Bambusoideae by the combination of visualized branch length differences in the cp genome phylogenomic tree () and quantitative estimation of the relative substitution rates (). Moreover, it is noteworthy that the rate variation (3–4 times) at the subfamily level of Bambusoideae to some extent is close to those observed in higher taxonomic levels, e.g. in the commelinids (about 3.5 times) [Citation14] and the Caryophyllales (about 3.1 times) [Citation63]. The lower molecular evolutionary rate of the woody bamboos (Arundinarieae and Bambuseae) ( and ) may contribute largely to the incapability of resolving the phylogenetic relationship of their own [Citation26,Citation27].
Distinct geographical pattern of chloroplast genome evolution in the bamboos
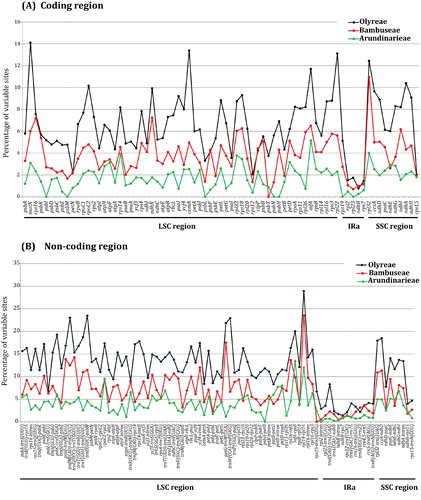
The estimate of relative evolutionary rate for different cp genome regions (LSC, SSC, IRs (here in terms of IRa), coding and non-coding regions) showed that although evolutionary rates changed vastly among the five cp genome regions of each tribe (Arundinarieae, Bambuseae and Olyreae), the rate values of each region were overall gradually decreasing from Olyreae to Bambuseae to Arundianrieae (). For instance, in the LSC region, the rate values decreased from tribe Olyreae (10.33%) to Bambuseae (5.84%), and to Arundinarieae (2.87%). We further estimated the relative evolutionary rate of each cp genome locus for each bamboo tribe (). It showed that the rates of all the 91 non-coding loci in both the woody tribes (Arundinarieae and Bambuseae) uniformly had lower rate values in comparison to the herbaceous tribe Olyreae (). Likewise, almost all the genes (71 out of 75) displayed a congruent evolutionary pattern, except four genes, i.e. clpP, ndhB, petN and psbF (). Moreover, the molecular evolutionary rates of tropical woody bamboos (Bambuseae) were faster than that of the temperate ones (Arundinarieae) in 73 out of 75 genes () and 82 out of 91 non-coding loci (). Two genes (ndhE and psbT) exceptionally showed higher rates in Arundinarieae than that in its counterpart (Bambuseae) ().
Figure 4. Sequence variations of partitioned chloroplast genome regions among Arundinarieae, Bambuseae and Olyreae in comparison with Oryza sativa. IRs is represented by IRa.
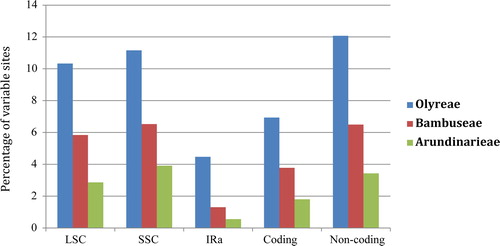
Figure 5. Percentage of single nucleotide polymorphisms (SNPs) among chloroplast DNA loci of Arundinarieae, Bambuseae and Olyreae in comparison with Oryza sativa. (A) Coding region. (B) Non-coding region. Homologous loci are ordered according to their locations in the chloroplast genome.
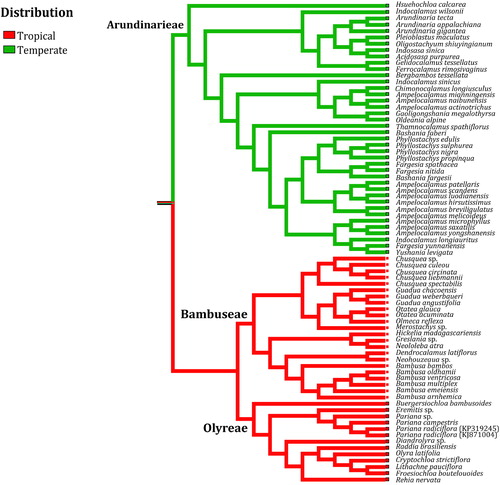
The globally consistent rate pattern of cp genome ( and ) was also mapped on the biogeography of bamboos (). The result revealed that character optimization of geographical distribution did not allow an unambiguous inference of the ancestral state of Bambusoideae, probably due to the split of tropical and temperate bamboos at the crown node of Bambusoideae (). Even so, it was so impressive that the transition from tropical to temperate distribution in the Bambusoideae () was apparently accompanied by the change of molecular evolutionary rate (). Overall, almost all facets of our data seem to conform to the widely discussed evolutionary-speed-hypothesis (ESH) [Citation7,Citation66], which suggests that molecular evolutionary rates of species in the warm areas are higher than that in the cool areas [Citation6,Citation67]. Intraspecific genetic diversity among mammals, birds, reptiles and insects [Citation68–70] has been shown to increase towards the tropics, consistent with the interspecific patterns of evolutionary speed [Citation7]. Population divergence in plant species [Citation71] and interspecific variation among plant families [Citation10,Citation11] implied the ESH. To our best knowledge, this is the first case by using cp genome data to show the distinct geographical pattern of molecular evolution in plants [Citation19,Citation21].
Figure 6. Geographical distribution optimized onto the phylogeny of Bambusoideae reconstructed using whole chloroplast genome sequences. Outgroups are trimmed out from the ML tree.
Geographical distribution per se is an integrated reflection of latitude, elevation, ocean depth [Citation72], and its resulting environmental factors, such as temperature, water, light and so on, influence the molecular evolution of species [Citation73]. In the bamboos, geographical distribution is suggested to be associated with generation times, i.e. flowering intervals; that is, the tropical bamboos have shorter generation times than those in the temperate areas [Citation23,Citation74–76]. According to the neutral theory, organisms with shorter generation times can frequently pass more germ line cell divisions per unit time, thereby leading to higher neutral mutation rate and faster evolution [Citation77]. Herbaceous bamboos (Olyreae) are annual flowering plants, whereas woody bamboos have a long vegetative stage, usually longer than 10 years, and flower periodically [Citation23]. Additionally, in the woody lineages, there are averagely longer generation times (50–60 years) in the temperate tribe Arundinarieae than those (30–40 years) in the tropical tribe Bambuseae [Citation12,Citation28,Citation76,Citation78]. As expected, it is indeed the tribe Olyreae that have the fastest substitution rate and the Bambuseae that have consistently faster substitution rate than the Arundinarieae across the cp genome ( and ). Furthermore, there is leptomorph rhizome in the temperate tribe Arundinarieae but pachymorph rhizome in the tropical tribes (Bambuseae and Olyreae) [Citation23,Citation53,Citation54]. The complex rhizome system in the temperate woody bamboos (Arundinarieae) [Citation55] may also contribute to their choice of longer flowering interval [Citation29,Citation30], and hence, slower cp genome evolution ( and ).
In spite of an apparent association between cp genome evolution and geographical distribution in Bambusoideae, supporting the EHS, we should also keep it in mind that there are some outliers of geographical trend, such as clpP, ndhB, petN and psbF genes between Bambuseae and Olyreae, as well as ndhE and psbT genes between Arundinarieae and Bambuseae (). Further detection uncovered non-synonymous SNPs which changed translated amino acids in the above six genes, indicating that selection pressure may also impact their evolutionary rates [Citation13]. Accelerated substitution rates have been reported for several cp genes, such as clpP in Silene [Citation79], ndhF in S. vulgaris [Citation80] and psb in Poaceae [Citation81]. The elevated evolution rates of clpP, ndhB, petN, psbF, ndhE and psbT genes in woody bamboos may reflect relaxed selection. Abnormal DNA replication, repair and/or recombination that have been proposed for the speeded divergence of coding genes [Citation82,Citation83] may be the likely mechanism for this phenomenon. In addition, infA-rps8, petB-petD, petD intron, petD-rpoA, psbC-trnS(UGA), ndhE-ndhG, ndhH-rps15, rpl33-rps18 and rps19-trnH(GUG) also display faster rates in Arundinarieae than that in Bambuseae (). Other factors such as organellar dividing during cell division [Citation84] and population size [Citation85] could potentially be involved. Moreover, unbalanced taxon sampling may have affected our genetic distance estimation too [Citation86] as we sampled 40, 23 and 13 species, only accounting for 7.3%, 2.8% and 10.5% of Arundinarieae, Bambuseae and Olyreae, respectively (Supplemental Table S1). To comprehensively understand the cp genome evolution in bamboos more data are thus needed in the future.
Conclusions
In the present study, a total of 76 Bambusoideae cp genomes (43 Arundinarieae, 20 Bambuseae and 13 Olyreae) including 10 newly generated ones were comprehensively analysed and compared. Lineage-specific evolutionary rates of cp genome were revealed in each of the three tribes by phylogenomic inference and the biggest difference (about four-fold) of evolutionary rate was detected between Arundinarieae and Olyreae via the relative rate estimation. A globally consistent pattern of cp genome evolution was further uncovered, with the relative evolutionary rate of different cp genome regions (LSC, SSC, IRs, coding and non-coding regions) and almost all the coding and non-coding loci across the cp genome gradually decreasing from Olyreae to Bambuseae to Arundianrieae. The apparent geographical trend that tropical bamboos (Bambuseae and Olyreae) evolved faster than their closely related temperate counterparts (Arundianrieae) at the cp genome level strongly supported the ESH (evolutionary-speed-hypothesis). The varied life-history traits, e.g. flowering intervals among the Arundianrieae, Bambuseae and Olyreae, may lead to the interesting biogeographical pattern of cp genome evolution in Bambusoideae. We believe that the data presented here will aid further evolutionary genomic studies of bamboos and facilitate our understanding of the ESH and plant adaptation in the context of global climate change.
Supplemental Material
Download PDF (59.8 KB)Acknowledgements
We would like to thank Dr. Cen Guo and Dr. Pengfei Ma for the help in samples collection. We are also grateful to Prof. Dezhu Li and Prof. Zhenhua Guo for the help in molecular data generation.
Disclosure statement
The authors report no conflict of interest.
Additional information
Funding
References
- Kreft H, Jetz W. Global patterns and determinants of vascular plant diversity. Proc Natl Acad Sci USA. 2007;104(14):5925–5930.
- Keil P, Chase JM. Global patterns and drivers of tree diversity integrated across a continuum of spatial grains. Nat Ecol Evol. 2019;3(3):390–399.
- Burivalova Z, Miteva D, Salafsky N, Butler RA, et al. Evidence types and trends in tropical forest conservation literature. Trends Ecol Evol (Amst). 2019;34(7):669–679.
- Bromham L. Why do species vary in their rate of molecular evolution?. Biol Lett. 2009;5(3):401–404.
- Brown JH. Why are there so many species in the tropics?. J Biogeogr. 2014;41(1):8–22.
- Gillman LN, Wright SD. Patterns of evolutionary speed: in search of a causal mechanism. Diversity. 2013;5(4):811–823.
- Orton MG, May JA, Ly W, et al. Is molecular evolution faster in the tropics? Heredity (Edinb)). 2019;122(5):513–524.
- Wright SD, Gray RD, Gardner RC. Energy and the rate of evolution: inferences from plant rDNA substitution rates in the western Pacific. Evolution. 2003;57(12):2893–2898.
- Gillman LN, Wright SD. Species richness and evolutionary speed: the influence of temperature, water and area. J Biogeogr. 2013;41(1):39–51.
- Davies TJ, Savolainen V, Chase MW, et al. Environmental energy and evolutionary rates in flowering plants. Proc Biol Sci. 2004;271(1553):2195–2200.
- Gillman LN, Keeling DJ, Gardner RC, et al. Faster evolution of highly conserved DNA in tropical plants. J Evol Biol. 2010;23(6):1327–1330.
- Wang W, Franklin SB, Lu Z, et al. Delayed flowering in bamboo: evidence from Fargesia qinlingensis in the Qinling Mountains of China. Front Plant Sci. 2016;7:151.
- Wang W, Chen S, Zhang X. Whole-genome comparison reveals divergent IR borders and mutation hotspots in chloroplast genomes of herbaceous bamboos (Bambusoideae: Olyreae). Molecules. 2018;23(7):1537.
- Barrett CF, Baker WJ, Comer JR, et al. Plastid genomes reveal support for deep phylogenetic relationships and extensive rate variation among palms and other commelinid monocots. New Phytol. 2016;209(2):855–870.
- Williams AM, Friso G, van Wijk KJ, et al. Extreme variation in rates of evolution in the plastid Clp protease complex. Plant J. 2019;98(2):243–259.
- Zervas A, Petersen G, Seberg O. Mitochondrial genome evolution in parasitic plants. BMC Evol Biol. 2019;19(1):87.
- Smith SA, Donoghue MJ. Rates of molecular evolution are linked to life history in flowering plants. Science. 2008;322(5898):86–89.
- Lanfear R, Ho SY, Davies TJ, et al. Taller plants have lower rates of molecular evolution. Nat Commun. 2013;4:1879.
- Shrestha B, Weng ML, Theriot EC, et al. Highly accelerated rates of genomic rearrangements and nucleotide substitutions in plastid genomes of Passiflora subgenus Decaloba. Mol Phylogenet Evol. 2019;138:53–64.
- Lanfear R, Welch JJ, Bromham L. Watching the clock: studying variation in rates of molecular evolution between species. Trends Ecol Evol (Amst). 2010;25(9):495–503.
- Gaut BS, Yang L, Takuno S, et al. The patterns and causes of variation in plant nucleotide substitution rates. Annu Rev Ecol Evol Syst. 2011;42(1):245–266.
- Gaut BS, Clark LG, Wendel JF, et al. Comparisons of the molecular evolutionary process at rbcL and ndhF in the grass family (Poaceae). Mol Biol Evol. 1997;14(7):769–777.
- Clark LG, Londoño X, Ruiz-Sanchez E. Bamboo taxonomy and habitat. In: Liese W, Kohl M, editors. Bamboo, tropical forestry. Switzerland: Springer International Publishing; 2015. p. 1–30.
- Soreng RJ, Peterson PM, Romaschenko K, et al. A worldwide phylogenetic classification of the Poaceae (Gramineae). J Syst Evol. 2015;53(2):117–137.
- Canavan S, Richardson DM, Visser V, et al. The global distribution of bamboos: assessing correlates of introduction and invasion. AoB Plants. 2017;9:plw078. DOI:.
- Kelchner SA, BPG (Bamboo Phylogeny Group). Higher level phylogenetic relationships within the bamboos (Poaceae: Bambusoideae) based on five plastid markers. Mol Phylogenet Evol. 2013;67(2):404–413.
- Zhang X-Z, Zeng C-X, Ma P-F, et al. Multi-locus plastid phylogenetic biogeography supports the Asian hypothesis of the temperate woody bamboos (Poaceae: Bambusoideae). Mol Phylogenet Evol. 2016;96:118–129.
- Ma P-F, Vorontsova MS, Nanjarisoa OP, et al. Negative correlation between rates of molecular evolution and flowering cycles in temperate woody bamboos revealed by plastid phylogenomics. BMC Plant Biol. 2017;17(1):260.
- Makita A. The significance of the mode of clonal growth in the life history of bamboos. Plant Species Biol. 1998;13(2–3):85–92.
- Tachiki Y, Makita A, Suyama Y, et al. A spatially explicit model for flowering time in bamboos: long rhizomes drive the evolution of delayed flowering. J Ecol. 2015;103(3):585–593.
- Wicke S, Schneeweiss GM. Next-generation organellar genomics: potentials and pitfalls of high-throughput technologies for molecular evolutionary studies and plant systematics. In: Hörandl E, Appelhans MS, editors. Next-generation sequencing in plant systematics. Bratislava: International Association for Plant Taxonomy (IAPT); 2015. p. 1–35.
- Li HT, Yi TS, Gao LM, et al. Origin of angiosperms and the puzzle of the Jurassic gap. Nat Plants. 2019;5(5):461–470.
- Doyle JJ. A rapid DNA isolation procedure for small quantities of fresh leaf tissue. Phytochem Bull. 1987;19:11–15.
- Altschul SF, Gish W, Miller W, et al. Basic local alignment search tool. J Mol Biol. 1990;215(3):403–410.
- Wyman SK, Jansen RK, Boore JL. Automatic annotation of organellar genomes with DOGMA. Bioinformatics. 2004;20(17):3252–3255.
- Schattner P, Brooks AN, Lowe TM. The tRNAscan-SE, snoscan and snoGPS web servers for the detection of tRNAs and snoRNAs. Nucleic Acids Res. 2005;33(Web Server issue):W686–W689.
- Saarela JM, Burke SV, Wysocki WP, et al. A 250 plastome phylogeny of the grass family (Poaceae): topological support under different data partitions. Peer J. 2018;6:e4299.
- Katoh K, Standley DM. MAFFT multiple sequence alignment software version 7: improvements in performance and usability. Mol Biol Evol. 2013;30(4):772–780.
- Tamura K, Peterson D, Peterson N, et al. MEGA5: molecular evolutionary genetics analysis using maximum likelihood, evolutionary distance, and maximum parsimony methods. Mol Biol Evol. 2011;28(10):2731–2739.
- Miller MA, Pfeiffer W, Schwartz T. Creating the CIPRES Science Gateway for inference of large phylogenetic trees. In Proceedings of the Gateway Computing Environments Workshop (GCE); 2010 November 14; New Orleans, LA, USA; 2010. p. 1–8.
- Stamatakis A. RAxML version 8: a tool for phylogenetic analysis and post-analysis of large phylogenies. Bioinformatics. 2014;30(9):1312–1313.
- Ma P-F, Zhang Y-X, Zeng C-X, et al. Chloroplast phylogenomic analyses resolve deep-level relationships of an intractable bamboo tribe Arundinarieae (Poaceae). Syst Biol. 2014;63(6):933–950.
- Ronquist F, Teslenko M, Van Der Mark P, et al. MrBayes 3.2: efficient Bayesian phylogenetic inference and model choice across a large model space. Syst Biol. 2012;61(3):539–542.
- Drummond AJ, Rambaut A. BEAST: Bayesian evolutionary analysis by sampling trees. BMC Evol Biol. 2007;7:214.
- Drummond AJ, Suchard MA, Xie D, et al. Bayesian phylogenetics with BEAUti and the BEAST 1.7. Mol Biol Evol. 2012;29(8):1969–1973.
- Wysocki WP, Clark LG, Attigala L, et al. Evolution of the bamboos (Bambusoideae; Poaceae): a full plastome phylogenomic analysis. BMC Evol Biol. 2015;15:50.
- Rambaut A, Drummond A. 2009. Tracer v1. 5: MCMC trace analyses tool. Available from http://beast.bio.ed.ac.uk/Tracer.
- Kearse M, Moir R, Wilson A, et al. Geneious Basic: an integrated and extendable desktop software platform for the organization and analysis of sequence data. Bioinformatics. 2012;28(12):1647–1649.
- Zhang Y-J, Ma P-F, Li D-Z. High-throughput sequencing of six bamboo chloroplast genomes: phylogenetic implications for temperate woody bamboos (Poaceae: Bambusoideae). PLoS One. 2011;6(5):e20596.
- Wang W, Chen S, Zhang X. Chloroplast genome evolution in Actinidiaceae: clpP loss, heterogenous divergence and phylogenomic practice. PLoS One. 2016;11(9):e0162324.
- Wang W, Chen S, Zhang X. Whole-genome comparison reveals heterogeneous divergence and mutation hotspots in chloroplast genome of Eucommia ulmoides Oliver. IJMS. 2018;19(4):1037.
- Edgar RC. MUSCLE: multiple sequence alignment with high accuracy and high throughput. Nucleic Acids Res. 2004;32(5):1792–1797.
- Judziewicz EJ, Clark LG, Londoño X, et al. American bamboos. Washington, DC: Smithsonian Institution Press; 1999. p. 1–60.
- Li DZ, W ZP, Zhu ZD, et al. Bambuseae (Poaceae). Beijing and St. Louis: Science Press and Missouri Botanical Garden Press; 2006. p. 1–60.
- Attigala L, Wysocki WP, Duvall MR, et al. Phylogenetic estimation and morphological evolution of Arundinarieae (Bambusoideae: Poaceae) based on plastome phylogenomic analysis. Mol Phylogenet Evol. 2016;101:111–121.
- Maddison WP, Maddison DR. 2015. Mesquite: a modular system for evolutionary analysis. Version 2.75. Available from http://mesquiteproject.org.
- Wu F-H, Kan D-P, Lee S-B, et al. Complete nucleotide sequence of Dendrocalamus latiflorus and Bambusa oldhamii chloroplast genomes. Tree Physiol. 2009;29(6):847–856.
- Zhang X-Z, Chen S-Y. Genome skimming reveals the complete chloroplast genome of Ampelocalamus naibunensis (Poaceae: Bambusoideae: Arundinarieae) with phylogenomic implication. Mitochondrial DNA B. 2016;1(1):635–637.
- Zhang X-Z, Chen S-Y, Chen P, et al. The complete chloroplast genome of Ampelocalamus actinotrichus (Bambusoideae: Arundinarieae). Mitochondrial DNA B. 2019;4(1):145–146.
- Sungkaew S, Stapleton CM, Salamin N, et al. Non-monophyly of the woody bamboos (Bambuseae; Poaceae): a multi-gene region phylogenetic analysis of Bambusoideae s.s. J Plant Res. 2009;122(1):95–108.
- Vieira LDN, Anjos KGD, Faoro H, et al. Phylogenetic inference and SSR characterization of tropical woody bamboos tribe Bambuseae (Poaceae: Bambusoideae) based on complete plastid genome sequences. Curr Genet. 2016;62(2):443–411.
- Wu M, Lan S, Cai B, et al. The complete chloroplast genome of Guadua angustifolia and comparative analyses of neotropical-paleotropical bamboos. PLoS One. 2015;10(12):e0143792.
- Yang Y, Moore MJ, Brockington SF, et al. Dissecting molecular evolution in the highly diverse plant clade Caryophyllales using transcriptome sequencing. Mol Biol Evol. 2015;32(8):2001–2014.
- Igea J, Tanentzap AJ. Angiosperm speciation speeds up near the poles. bioRxiv. 2020; 619064. DOI:. Accessed 2020 Feb.
- Nie Y, Foster CS, Zhu T, et al. Accounting for uncertainty in the evolutionary timescale of green plants through clock-partitioning and fossil calibration strategies. Syst Biol. 2020;69(1):1–16.
- Lin G, Huang Z, Wang L, et al. Evolutionary rates of bumblebee genomes are faster at lower elevations. Mol Biol Evol. 2019;36(6):1215–1219.
- Sebastián-González E, Barbosa JM, Pérez-García JM, et al. Scavenging in the Anthropocene: human impact drives vertebrate scavenger species richness at a global scale. Glob Chang Biol. 2019;25(9):3005–3017.
- Adams RI, Hadly EA. Genetic diversity within vertebrate species is greater at lower latitudes. Evol Ecol. 2013;27(1):133–143.
- Oppold A-M, Pedrosa JAM, Bálint M, et al. Support for the evolutionary speed hypothesis from intraspecific population genetic data in the non-biting midge Chironomus riparius. Proc Biol Sci. 2016;283(1825):20152413.
- Loeza-Quintana T, Carr CM, Khan T, et al. Recalibrating the molecular clock for Arctic marine invertebrates based on DNA barcodes 1. Genome. 2019;62(3):200–216.
- Eo SH, Wares JP, Carroll JP. Population divergence in plant species reflects latitudinal biodiversity gradients. Biol Lett. 2008;4(4):382–384.
- Pennell MW. What explains latitudinal diversity gradients? Trends Ecol Evol. 2019;34(5):390–392.
- Hu J. Evolution of body mass in Coleoptera: insights from museum specimens and DNA barcodes [doctoral dissertation]. Guelph, Canada: University of Guelph; 2019.
- Janzen DH. Why bamboos wait so long to flower. Annu Rev Ecol Syst. 1976;7(1):347–391.
- Campbell J. Bamboo flowering patterns: a global view with special reference to East Asia. J Am Bamboo Soc (USA). 1985;6:17–35.
- Guerreiro C. Flowering cycles of woody bamboos native to southern South America. J Plant Res. 2014;127(2):307–313.
- Bradburd GS, Ralph PL. Spatial population genetics: it’s about time. Annu Rev Ecol Evol Syst. 2019;50(1):427–449.
- Veller C, Nowak MA, Davis CC. Extended flowering intervals of bamboos evolved by discrete multiplication. Ecol Lett. 2015;18(7):653–659.
- Sloan DB, Alverson AJ, Wu M, et al. Recent acceleration of plastid sequence and structural evolution coincides with extreme mitochondrial divergence in the angiosperm genus Silene. Genome Biol Evol. 2012;4(3):294–306.
- Krüger M, Abeyawardana OA, Juříček M, et al. Variation in plastid genomes in the gynodioecious species Silene vulgaris. BMC Plant Biol. 2019;19(1):1–15.
- Shahzadi I, Mehmood F, Ali Z, et al. Comparative analyses of chloroplast genomes among three Firmiana species: identification of mutational hotspots and phylogenetic relationship with other species of Malvaceae. Plant Gene. 2019;19:100199.
- Henriquez CL, Ahmed I, Carlsen MM, et al. Evolutionary dynamics in chloroplast genome of subfamily Aroideae (Araceae). Genomics. 2020. DOI:.
- Zhao DN, Ren Y, Zhang JQ. Conservation and innovation: Plastome evolution during rapid radiation of Rhodiola on the Qinghai-Tibetan Plateau. Mol Phylogenet Evol. 2020;144:106713.
- Osteryoung KW, Nunnari J. The division of endosymbiotic organelles. Science. 2003;302(5651):1698–1704.
- Charlesworth B. Fundamental concepts in genetics: effective population size and patterns of molecular evolution and variation. Nat Rev Genet. 2009;10(3):195–205.
- Han TS, Zheng QJ, Onstein RE, et al. Polyploidy promotes species diversification of Allium through ecological shifts. New Phytol. 2020;225(1):571–583.