
Abstract
Chinese wild pepper (Capsicum frutescens L.) acts as a source of genetic variability for cultivated pepper breeding. High-resolution quantitative train locus (QTL) mapping is essential for identifying genetic regions related to important phenotype variation. In this study, a set of 120 F2 populations derived from a cross between cultivar Capsicum annuum ‘007EA’ and the wild relative Capsicum frutescens ‘P1512’ (Chinese wild pepper) were generated, and genotyping was performed with genotyping-by-sequencing. Next, an interspecific high-density genetic map containing 3708 bins was constructed using a sliding window approach. The genetic distance of the total map was 5601.79 cM, and the average interval between bins was 1.51 cM. Based on the genetic map, a QTL analysis of the pepper horticultural traits was performed. A total of 25 significant QTLs controlling nine horticultural traits were detected on 12 linkage groups (LGs), and contributed values of phenotypic variance explained (PVE) ranging from 1.90% to 59.03%, with LOD scores ranging from 4.2 to 24.6. In addition, the QTLs for the main stem length, flowering date and numbers of leaves were observed at the same position. Next, we mapped a set of significant QTLs for yield-related traits and other horticultural traits in pepper, based on a high-density genetic linkage map, using GBS. These genetic map and markers are valuable genomic resources for marker-assisted selection (MAS) of excellent agronomic traits and will provide a basis for further fine mapping and comparative genomics research involving pepper.
Background
Pepper (Capsicum spp.) is a typical cross-pollinated diploid (2n = 2x = 24) crop. It is a member of the Solanaceae family and is native to the tropics and subtropics of the Americas. Pepper is an important economic crop, as it supplies the body with energy and relieves pain, due to its richness in vitamin C, capsaicinoid and other antioxidants [Citation1,Citation2]. Capsicum encompasses approximately 35 species, including five important domesticated species: C. annuum, C. frutescens, C. chinense, C. baccatum and C. pubescens [Citation3,Citation4]. These species show abundant morphological diversity in terms of plant architecture, flower-, leaf- and fruit-related traits, which is a basis for pepper breeding [Citation5–7]. In pepper breeding, achieving the greatest yield and best fruit quality have been the major targets for breeders over the past several decades [Citation8,Citation9]. Many quantitative traits are controlled by multiple genetic loci; thus, the construction of a genetic map is a necessity for discovering quantitative trait genes for application in breeding research.
Various molecular markers, such as RFLP (Restriction Fragment Length Polymorphism), AFLP (Amplified Fragment Length Polymorphism), RAPD (Random Amplified Polymorphic DNA) and SSR (Simple Sequence Repeat) markers, have been developed and widely applied in Capsicum and other plant species genetic mapping and QTL mapping [Citation10–13]. The first interspecific genetic linkage map for pepper was constructed between C. annuum and C. chinense [Citation14], whereas the first intraspecific genetic linkage map was established with RAPD and RFLP markers in three doubled haploids (DHs) from F1 in 1995 [Citation15]. Due to the fact that inter-species crosses show significantly greater heredity differences compared to intra-species ones, the construction of inter-specific genetic maps may be easier. Traditional molecular markers such as RFLP, AFLP and RAPD can easily cause distorted segregation due to their inherent limitations, and because the large genome size of pepper poses a challenge to the construction of high-density genetic maps [Citation16,Citation17]. It was not until recently that the first SSR-based genetic map in pepper was constructed, which consists of 12 LGs, and one QTL related to fruit traits identified with the genetic mapping [Citation18].
Along with the rapid development of next-generation sequencing (NGS), the third-generation marker system, such as the single-nucleotide polymorphism (SNP) marker, has arisen in genomics and genetic breeding [Citation19–21]. The SNP marker possesses clear advantages compared to traditional molecular markers, as it is more accurate and co-dominant, and can be uniformly distributed across the genome in a high-throughput manner [Citation22]. Meanwhile, new SNP genotyping methods, such as restriction site-associated DNA sequencing (RAD-seq) [Citation23] and genotyping-by-sequencing (GBS) [Citation24], have been developed. Among these, GBS is a method that could simultaneously perform sequencing, discovery and genotyping of thousands of SNPs with a single step [Citation25,Citation26]. The use of NGS technology for GBS renders this tool increasingly important, efficient and cost-effective in low-coverage sequencing; thus, it has been widely utilized for genetic application in a variety of species [Citation24]. However, data analysis for GBS is complex since one sequencing run can produce thousands or even millions of short reads. In addition, there are also some other drawbacks of GBS, such as a relatively high proportion of missing data and unavoidable sequencing errors. Therefore, it is necessary that advanced analysis pipelines are used to handle missing SNP data. These include steps to filter out reads with poor quality, and classify and align the sequence data [Citation27,Citation28]. Furthermore, a sliding window approach was adopted to overcome genotype calling errors or missing data. The consecutive SNPs with the same genotype are combined into one bin, and recombination locations are demarcated across all the individuals [Citation29]. This method has been applied for the construction of bin maps in cotton, watermelon and sweet Osmanthus, so as to greatly increase the accuracy of mapping for further detecting QTLs [Citation30–32].
In this study, a large pepper genome with a narrow genetic base necessitated the construction of high-resolution inter-specific genetic linkage maps. Chinese wild pepper belongs to the species C. frutescens, which is closely related to the cultivated pepper C. annuum [Citation33]. Chinese wild pepper is a small and abundant fruit with fragrant pulp. Moreover, variations in some excellent characteristics have been developed as a result of long-term natural selection. For these reasons, it is able to grow at barren and low light conditions. Additionally, it is well known that abiotic and biotic stresses, such as salt [Citation34–41], drought [Citation42–48], high and low temperature [Citation49–53], downy mildew [Citation54] and heavy metal [Citation55–56], severely affect plant growth, development and yield [Citation57–64]. Thus, the strong resistance to abiotic and biotic stresses may help cultivated pepper to survive in high-temperature and high-humidity surroundings [Citation65–67]. In this study, a high-resolution inter-specific bin map of a pepper interspecific cross between C. annuum ‘007EA’ and C. frutescens ‘P1512’ was constructed using GBS and a modified sliding window approach. The total length of the linkage map was 5601.79 cM, and the average distance of the bins was 1.51 cM. Based on the bin map, we identified QTLs controlling horticultural traits using F2 populations generated from the cross between C. annuum ‘007EA’ and C. frutescens ‘P1512’. A total of 25 major QTLs controlling nine traits were detected, which were mainly distributed in the pepper LGs 3, 4, 6, 7, 9, 10, 11 and 12.
Materials and methods
Plant materials and experimental design
A set of 120 F2 plants were obtained from the self-crossing of F1 hybrids between the inbred pepper lines Capsicum annuum-007EA (the maternal line) and C. frutescens-P1512 (the paternal line). 007EA is a cultivar with long, red and non-pungent fruits, characterized by the absence of branches. It was provided by the Institute of Vegetables, Zhejiang Academy of Agricultural Sciences. P1512 is a wild relative of cultivated pepper with slim, small and pungent fruits, and typically has branches. It was offered by Yunnan University. Overall, there are significant differences in plant height, fruit weight and branches between the parental lines.
Two parental lines and 120 F2 plants were grown in a greenhouse in 2017. The sowing box specifications were 60 cm × 42 cm × 12 cm. The seedlings were transplanted from the sowing boxes to a plastic greenhouse at the three-leaf stage. The spacing between rows was 70 cm, and the plant space was 60 cm. Only one plant was fixed in each hole. Fertilizer and water management and disease control were consistent with the field growing plants. Young leaves were taken from the surviving transplanted seedlings before flowering with foil and labels, and frozen in liquid nitrogen for DNA extraction.
Phenotypic evaluation
A total of nine horticultural characters were evaluated for C. annuum-007EA, C. frutescens-P1512 and 120 F2 individuals. These traits were then evaluated in three measurements per plant using their relevant units. The average value was calculated for each trait. The evaluated traits included initial blooming time (IBT), leaf length (LL), leaf width (LW), main stem length (MSL), main stalk pitch number (NMS), internode length (IL), number of offshoots (ON), fruit length (FL) and fruit weight (FW). These traits were then determined according to the following definitions: BFD: the opening date of the first flower for each individual plant. LL: the range from the base to the tip of a leaf. LW: the maximum blade width of a leaf. MSL: the range from the base to the first crotch of a plant. NMS: the effective number from cotyledonary node to main stem tip. IL: the ratio length and number with the main stem. ON: the number of lateral branches growing from a main branch. FL: the range from the base to the top of the fruit. FW: the weight of fresh fruit after harvest. The Pearson correlation coefficients were calculated to analyse the relationship between morphological traits.
DNA extraction and genotyping
Genomic DNA was extracted from young pepper leaf tissue of 120 F2 individuals and their parents using cetyltriethylammnonium bromide (CTAB) [Citation68]. Next, a library was constructed for GBS analysis. High-molecular genomic DNA from each F2 plant and the two parents was digested using a specific restriction enzyme ApeKI, followed by ligating to the sticky ends with barcoded adapters. The DNA samples were collected in 96-well plates after reaction and tagged using 96 different barcode sequences. Barcode adapters were connected and used for GBS library preparation. Purification was performed according to the instructions of the PCR purification kit (QIAquick PCR Purification Kit Cat No.28104, Qiagen, Valencia, CA). Amplified fragments (170–350 bp) were recovered using the Min Elute Gel Extraction Kit (Qiagen, 28704, Takara, Dalian, China). Genotyping was performed according to the directions outlined by Elshire et al. [Citation26]. Dual-terminal PE125 low-depth sequencing was performed on the Illumina HiSeq 150 Platform.
Raw data FASTQ files were obtained from sequencing, which were then processed and filtered using the GBS analysis pipeline implemented in TASSEL5.0 software [Citation69]. In brief, sequences from raw data were processed into sequence reads. The GBS pipeline’s first step is the demultiplexing according to these reads barcode adapters to further trim to additional sequences of 64 bp. Then, the filtered sequence reads were aligned using Burrows-Wheeler alignment (BWA) software to the already available reference genome of the pepper C. frutescens-P1512 (the data of the reference genome have yet to be disclosed). Pipeline parameters were used for SNP detection, and all of the identified SNPs were scored for various coverage, depth and genotyping.
Sequencing and bioinformatics analyses
High-throughput sequencing platforms and bioinformatics tools are essential for analysing the genotype. A total of 120 F2 individuals and two parents were sequenced by GBS using Illumina HiSeq 150. GBS reduced the representation sequencing using double end-labelling cycle sequence. In total, 800-bp reads and 8 × coverage were performed. The bioinformatics software used is as follows:
a. Quality detection of original sequencing reads: Fastqc (http://www.bioinformatics.babraham.ac.uk/projects/fastqc/). b. Trimming and filtration of sequencing reads: Trimmomatic (http://www.usadellab.org/cms/uploads/supplementary/Trimmomatic/Trimmomatic-0.36.zip), as it supports multi-threading, has the advantage of quick data processing and can wipe out the joint of Fastq sequencing in Illumina. c. Short-reads alignment: BWA [Citation27]; (https://nchc.dl.sourceforge.net/project/bio-bwa/bwa-0.7.15.tar.bz2). d. Nucleic acid sequence alignment: Blast [Citation70] (http://blast.ncbi.nlm.nih.gov/Blast.cgi). e. File format translator and mutation detection system: The same file was generated by sequence alignment; then, the file was handled and viewed by Samtools [Citation71] (http://samtools.sourceforge.net/samtools.shtml). f. Comparative genome tool: MUMmer software (http://www.tigr.org/software/mummer/). g. GBS with genotype detection tool: Tassel 5.0 (http://www.maizegenetics.net/tassel).
Construction of the genetic map
A sliding window approach was applied to modify potential genotyping errors for recombination breakpoints [Citation72], and to calculate the ratio of SNP polymorphism from the 007EA and P1512 genotypes. The genotype data were scanned, the window size was an SNP step size with 15 markers (5 Mb and step size of 0.5 Mb), and each window was referred to as the SNP genotype. The window was identified as homozygous when more than 11 of the SNPs had one of the parental genotypes, otherwise the window was identified as heterozygous. F2 population genotype was quantized based on the parental SNP genotype. Changes took place in the genotype between the adjacent windows. These adjacent regions were regarded as recombination breakpoints, and the same block was composed of genotype adjacent windows. A recombination bin map was constructed on the basis of the recombination breakpoint of each F2.
The Kosambi mapping function and Haldane's mapping function were used to calculate the distance (cM) from the recombination fraction between bins. Twelve linkage groups were drawn using the Perl SVG modules for the C. annuum × C. frutescens F2 population.
QTL analysis
Based on the constructed genetic maps, all of the field phenotyping traits were used for QTL mapping. The QTL analysis was performed using Windows QTL Cartographer 2.5 with the composite interval mapping (CIM) method. The window size was set to 10 cm, and operating parameters were set to default with the 0.05 significance level. The LOD threshold was determined by data simulation (permutation test, PT) for each phenotype. The threshold was obtained according to the previous permutation test, which estimated the location of the QTL for each trait.
Results and discussion
Variation of phenotype for nine agronomic traits
The cultivated pepper ‘007EA’ exhibits short plant height and plump fruits, whereas the wild relative ‘P1512’, belonging to C. frutescens, yields small and pungent fruits. There were many phenotypic differences between the parents; thus, the F2 individuals were quite different in morphology (see and ). A total of nine main agricultural traits with phenotypic variations from F2 individuals are listed in . The results showed that the nine traits segregated significantly in the F2 population. For the coefficient of variation, the phenotypic variations in offshoot number and fruit-related traits were the largest (). The values of the nine horticultural traits of the individuals in the F2 population showed normal distribution or biased distribution with the SPSS analysis software (). The results indicate that the nine traits were affected by quantitative genetic loci and controlled by polygenes, and satisfied the conditions for further QTL analysis. Positive and negative correlations were discovered from the statistical analysis of the nine traits (). In particular, the correlations of fruit-related traits were the highest among all traits. Fruit weight and fruit length were positively correlated, as were leaf length and leaf width. The main stem length was positively correlated with internode length and main stalk pitch number. The phenotypic correlation in the parents and F2 population indicated that one gene or several closely linked genes may control multiple traits.
Figure 1. Differences in phenotypic characters among the F2 generation groups. Fruit (A, B and C); offshoot number (D and E); leaf (F and G); plant height (H and I).
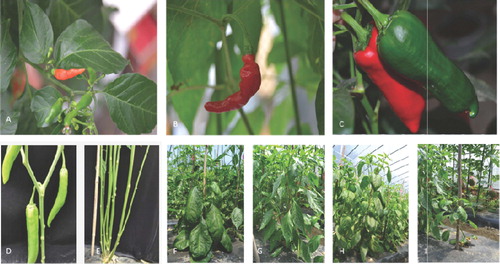
Figure 2. Nine horticultural traits distributions in the F2 population. Offshoot number (ON), fruit length (FL) and fruit weight (FW), initial blooming time (IBT), leaf width (LW), leaf length (LL), main stem length (MSL), number of main stalk pitch (NMS) and internode length (IL).
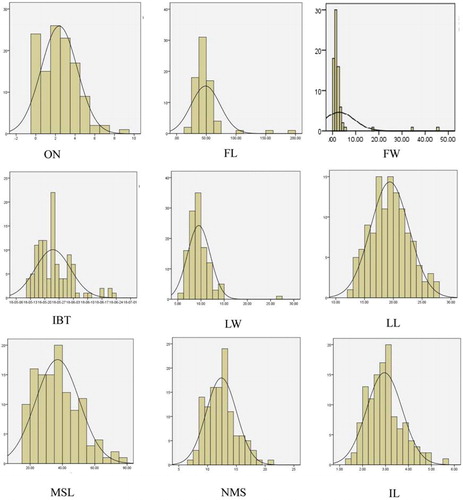
Table 1. Descriptive statistics of phenotypic characters in F2.
Table 2. Correlation between morphological traits evaluated in the F2 population. The phenotypic data were applied for the Spearman correlation test. The red and green blocks show positive and negative correlations, respectively. Offshoot number (ON), fruit length (FL) and fruit weight (FW), initial blooming time (IBT), leaf width (LW), leaf length (LL), main stem length (MSL), number of main stalk pitch (NMS) and internode length (IL).
As a general feature, the longitudinal data for plant traits and fruit traits both had significant correlations, but for the horizontal data, correlations were either non-significant or weak for fruit and plant traits. This result is very similar to those of previous reports [Citation9]. All of the leaf traits were positively correlated with one another, but there was a slightly negative correlation between the leaf width and number of offshoots. The correlation between leaf traits was detected by Chunthawodtiporn et al. [Citation73]. In addition, the correlation between main stem length and initial blooming time was observed in our study, which has also been reported in the previous publications [Citation74]. However, the correlation coefficient in this study was shown to be relatively low, perhaps due to the lack of replicates. Furthermore, it is worth noting that the initial blooming time displayed a significant yet weak positive correlation with NMS (). As the NMS was calculated from the node of the cotyledon to the first flower node on the main stem, according to the International Plant Genetic Resources Institute (IPGRI), NMS is regarded as NL (number of leaves). A previous study has suggested that the NL could directly affect the flowering time [Citation75], which is consistent with a previous view. Mimura et al. [Citation18] reported that the QTLs for MSL, IBT and NL were found at the same position on P12 in pepper. However, a decisive conclusion as to the relationship among MSL, IBT and NL requires further investigation.
SNP sequencing, genotyping and construction of genetic linkage map
‘007EA’ and ‘P1512’ were sequenced with 12× coverage, whereas the F2 populations were sequenced with 8× coverage using GBS. A total of 1,539,018 unfiltered SNPs were produced by SNP calling. Among these, 171,199 high-quality SNPs observed with the low-coverage sequencing were filtered and used for linkage analysis.
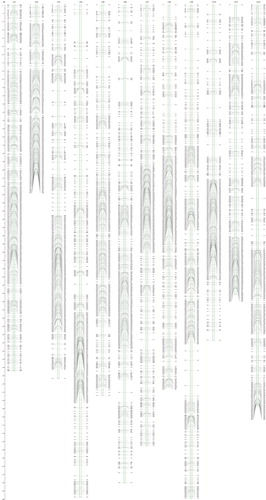
All SNPs were grouped into 3,708 bins and used for the construction of a genetic linkage map ( and ). The 3,708 bins formed 12 linkage groups, corresponding to the 12 chromosomes of pepper, which ranged from 206.22 to 599.26 cM. The linkage groups were named sequentially from LG1 to LG12. Among them, the longest one was LG9, whereas the shortest was LG2. The total length of the linkage map was 5,601.79 cM, with an average of 466.82 cM, and the average distance of the bins was 1.51 cM ().
Table 3. Summary statistics of the pepper inter-specific genetic linkage map constructed using the F2 population arising out of a cross of (Capsicum annuum 007EA ×C. frutescens P1512).
Although the cost of whole-genome sequencing continues to drop, sequencing of crops with large genomes, such as maize, barley and pepper, remains costly. Therefore, for the construction of the genetic map and QTL mapping, it is unnecessary for all individuals and parents of a mapping population to perform genome sequencing. GBS is a targeted genotyping and low-coverage sequencing approach which may be applied to large-scale SNP discovery and genotyping [Citation26]. Due to its high efficiency and high throughput, recently GBS has been applied to SNP identification and mapping in several plant species [Citation18,Citation24]. Due to the complexity of the pepper genome, its genetic map is not higher throughput compared with both tomato and Arabidopsis. At present, most of the genetic linkage maps in pepper have been constructed with traditional molecular markers [Citation10–13]. In recent years, several SNP-based genetic linkage maps of pepper have been constructed using NGS technology [Citation76]. In addition, missing data are inevitably generated, due to sequencing errors when conducting GBS. This problem may be solved with an SNP imputation in which consecutive SNPs are combined into one bin using a sliding window approach. The SNP imputation is able to greatly reduce genotype errors caused by low-quality SNP calling, and has been applied for constructing genetic linkage mapping and QTL analysis in cotton, watermelon and sweet Osmanthus [Citation30–32]. In this study, we utilized the GBS platform and a sliding window approach to construct an inter-specific genetic map based on 120 F2 plants derived from a crossing between C. annuum and C. frutescens. In total, we obtained 3,708 high-quality bin markers, and the map covered a genetic distance of 5,601.79 cM on 12 LGs. The length of the bin markers ranged from 0.1 to 3.3 Mb, with a mean of 279.5 Kb, so that one QTL could be narrowed down to a small interval harbouring several dozens of genes, or even fewer ().
Figure 3. High-density interspecific genetic bin map of pepper between Capsicum annuum-007EA and C. frutescens-P1512. This genetic map comprises 12 linkage groups (LG1-LG12) with 3,708 bin markers. Genetic distances (cM) are listed to the left of each linkage group, and bin markers to the right.
QTL analysis
The QTL mapping analyses of the nine horticultural traits were conducted using the phenotypic and genotypic data in the F2 population (, ). A total of 25 major QTLs controlling the nine traits were detected, and the LOD value of the detected QTLs ranged from 4.2 to 24.6 (, ). The phenotypic variance explained by these QTLs ranged from 1.90% to 59.03%. QTLs between 1 and 6 were detected for each morphological trait. The locations of these QTLs on the genetic map were mainly distributed in the pepper LGs 3, 4, 6, 7, 9, 10, 11 and 12 ( and ). On LG7, only one QTL was detected. Two and five QTLs were detected on LG6 and LG10, respectively. Three QTLs were detected on LG3, LG9 and LG11, and four were detected on LG4 and LG12.
Figure 4. Location of QTLs on the genetic linkage map of pepper developed from the cross Capsicum annuum-007EA and C. frutescens-P1512. The yellow vertical bars are depicted as the linkage groups. The QTLs for the nine horticultural traits are indicated by the black transverse lines, and bin markers by the coloured transverse lines. The bin markers areas are shown between the distances of same colour transverse lines, and genetic distances of QTL and bin marker are shown by the values on the genetic linkage map. The distances among markers are indicated in cM to the left of the linkage groups, and the names of markers and QTLs are shown on the right. Only those bin markers which were in and around the QTL region are shown. None of the QTL for the traits were detected on LG1, LG2, LG5 or LG8.
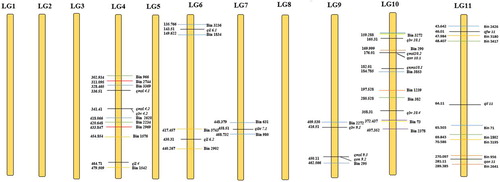
Table 4. QTL analysis of nine agricultural traits in pepper.
The consolidated QTLs were named in accordance with the abbreviation of each trait name and the linkage group. For example, one QTL controlling the IBT was detected on LG7, thus it was named qIBT7. For leaf length, two QTLs were located on LG4 and LG6, and were named qLL4 and qLL6, respectively. The additive effects of the 2 QTLs were negative, indicating that the leaf length was contributed from C. annuum 007EA. The QTL with the greatest effect on leaf length was qLL4, explaining 21.31% of phenotypic variation. Five QTLs controlling leaf width were located on LG4, LG9, LG10 and LG12, respectively, with LG10 harbouring two. In more detail, qLW4 was mapped to a region between the 328.5 cM and 418.1 cM of LG4 (bin 3369-2620); qLW9 was located in a small interval of 53.1 cM on LG9 (within the bin 2272-295); whereas two QTLs (qLW10.1 and qLW10.2) were located in the interval between 159.3 and 372.4 cM of LG10 (bin 3858-73), with qLW10.2 having the greatest effect, explaining 21.61% of the phenotypic variation. Four QTLs, qMSL4, qMSL9, qMSL10 and qMSL12, were detected for the main stem length trait. These QTLs all had positive additive effects, indicating that they were derived from the paternal line C. frutescens P1512. In particular, qMSL10 explained 59.03% of phenotypic variation, which suggested that a major gene may have been present to control the main stem length. For each QTL of the main stem length, both additive and dominant effects were detected, suggesting that they were derived from the male parent line P1512. The degree of dominance was complete dominant-negative effect. Only one QTL was detected for the number of main stems, which was located in a small interval of 27.5 cM on LG10 (bin 290-1239), and accounted for 38.12% of the phenotypic variation. Three QTLs pertaining to internode length were mapped on LGs 3, 6 and 11, which explained phenotypic variation in the range of 3.36% (qIL3) to 14.81% (qIL11). At all of the loci except qIL6, the alleles from C. annuum 007EA contributed to internode length. Six QTLs for offshoot number were detected on LGs 4, 9, 10, 11 and 12, with the LOD thresholds ranging from 4.6 (qON11) to 17.6 (qON4). The phenotypic variance varied from 11.1% (qON9.2) to 22.94% (qON12.1). The positive additive effects of these QTLs indicate that the limited offshoot number was derived from C. futescens P1512. Furthermore, only one QTL pertaining to fruit weight was located in a small region (between 43.6 and 65.5 cM) of LG11, which explained 34.38% phenotypic variance. This QTL had a positive additive effect, signifying that F2 with the paternal genotype had higher values for fruit weight. Furthermore, only one QTL was detected for fruit length, which was located in a small interval of 12.7 cM on LG3 (bin 3776-959), and accounted for 1.9% of the phenotypic variation.
Most yield- and fruit-related traits are favourable targets for breeding selection, yet these traits are typically regulated by multiple genes and are characterized by quantitative trait inheritance [Citation29,Citation32]. The population used in this study showed a normal distribution or skew normal distribution in several traits, indicating their nature of quantitative inheritance. Ultimately, we detected QTLs controlling fruit-related traits and other important horticultural traits using the generated genetic linkage map. A total of 25 QTLs for nine traits were detected, which explained phenotypic variation ranging from 1.90% to 59.03%. These QTLs were unevenly distributed on all of the LGs, except LG1, LG2, LG5 and LG8, which corresponded to locations with defined bin markers. However, prior to this study, a number of QTLs controlling horticultural traits had been identified in intraspecific and interspecific populations in pepper [Citation8–10]. In particular, most QTLs with fruit-associated traits were analysed in breeding research [Citation8,Citation77]. For instance, the major QTLs for fruit weight from the previous studies were located on chromosomes 2 and 4 [Citation8,Citation73,Citation77]. However, it was reported that eight and six QTLs were respectively detected for fruit weight in 2000 and 2001 [Citation8]. All of the QTLs were detected on several chromosomes, including chromosome 11. In this study, one QTL for fruit weight was detected on chromosome 11, which was consistent with the previous conclusions. In addition, a previous study regarding pepper found that the fruit-weight QTLs were detected on chromosomes 3 and 6 [Citation29], thus indicating that fruit weight is controlled by multiple genes. However, another previous report showed that the physical position of QTLs for fruit length was located at approximately 240 Mbp on chromosome 3 [Citation73]. Consistent with this view, the major QTL that affected fruit length in this study was detected on chromosome 3. Similarly, Rao et al. [Citation8] reported that fl3.1, a QTL controlling fruit length, was detected on chromosome 2 in all three years. In addition, the result showed that five QTLs for leaf width were identified on chromosomes 4, 9, 10 and 12, whereas two QTLs for leaf length were identified on chromosomes 4 and 6. The major QTLs for leaf width and leaf length were found on the same chromosome 4 ( and ). Previous studies have shown that leaf traits were co-localized at the same positions with fruit traits, in particular fruit weight [Citation78–79]. However, our results were inconsistent with these studies, and we found that leaf width and main stem length were co-localized at the same positions in LG4 with a genetic distance in 341.41 cM ( and ). This is perhaps due to the fact that we used an F2 population derived from the interspecific cross C. annuum 007EA × C. frutescens for QTL analysis. It was easy to acquire an F2 population within a short time, yet there were some limitations which did not allow the individual plants to be replicated for application in different environment conditions [Citation80].
The initial blooming time, leaf and main stem length, which have been considered to be the major components of yield in pepper, are also linked to the earliness of fruit production. Flowering date is a fully quantitative complex trait and is controlled by multicomponent genes [Citation81]. In this study, two QTLs for initial blooming time were detected, which are located on chromosomes 3 and 7. flw3.1 was identified as a QTL for flowering date and in 2001 explained 6% of the phenotypic variation [Citation8]. Two QTLs for flowering date were detected on LG8 (FD8.1) and P12 (FD12.1), respectively, explaining approximately 34% and 20% of the total phenotypic variation. However, the major QTLs controlling the flowering date were located on chromosome 2, as suggested by the previous reports [Citation44,Citation81,Citation82]. The results obtained from previous studies were compared with those of this study, and it was shown that the QTLs were not the same as in the previous studies, thereby suggesting that the population used for QTL identification originated from the genetic background of the research materials. Additionally, it was reported that the QTLs for main stem length, flowering date and numbers of leaves were found at the same position. This phenomenon may have been caused by a multiple effect or ‘polygene copolymerization’. Whether these pleiotropic effects were determined by a single gene, or two or more closely linked genes, remains to be verified through further study.
Conclusions
In this study, for the first time a high-density bin map was constructed through GBS combined with a sliding window approach using interspecific crossing between C. annuum and C. frutescens, which increased the accuracy of QTL mapping in pepper. We identified QTLs for not only fruit- and flower-related traits, but also plant main stem- and leaf-related ones.
Authors’ contributions
HW conceived and designed the experiments, and conceived the project; JW, JL and JY carried out the experiments; JW, MR and RW participated in field trials; QY, ZY and GZ performed genotyping; JY and YC developed the F2 populations; HZ performed phenotyping of all populations; JL and JW carried out data analyses; JW interpreted the results and drafted the manuscript. All authors have read and approved the manuscript.
Supplemental Material
Download PDF (135.1 KB)Supplemental Material
Download PDF (2.1 MB)Supplemental Material
Download PDF (180.3 KB)Data availability statement
The data that support the findings of this study are available on request from the corresponding author, [HJW]. The data are not publicly available since the C. frutescens genome has not been published.
Disclosure statement
The authors declare that the research was conducted in the absence of any commercial or financial relationships that could be construed as a potential conflict of interest.
Additional information
Funding
Related Research Data
References
- Materska M, Perucka I. Antioxidant activity of the main phenolic compounds isolated from hot pepper fruit (Capsicum annuum L). J Agric Food Chem. 2005;53(5):1750–1756.
- Zhang XM, Zhang ZH, Gu XZ, et al. Genetic diversity of pepper (Capsicum spp.) germplasm resources in China reflects selection for cultivar types and spatial distribution. J Integr Agric. 2016;15(9):1991–2001.
- Pickersgill B. Genetic resources and breeding of Capsicum spp. Euphytica. 1997;96(1):129–133.
- Carrizo García C, Sterpetti M, Volpi P, et al. Wild Capsicums: identification and in situ analysis of Brazilian species. In: Lanteri S, Rotino GL, editors. Breakthroughs in the genetics and breeding of capsicum and eggplant; p. 205–213. Torino Comitato per l’organizzazione degli eventi (COE) DISAFA, Università degli Studi di Torino Italy IT.
- Eshbaugh WH. The taxonomy of the genus Capsicum (Solanaceae). Phytologia. 1980;47:153–166.
- Thul ST, Lal RK, Shasany AK, et al. Estimation of phenotypic divergence in a collection of Capsicum species for yield-related traits. Euphytica. 2009;168(2):189–196.
- Sudré CP, Gonçalves LSA, Rodrigues R, et al. Genetic variability in domesticated Capsicum spp. as assessed by morphological and agronomic data in mixed statistical analysis. Genet Mol Res. 2010;9(1):283–294.
- Rao GU, Chaim AB, Borovsky Y, et al. Mapping of yield-related QTLs in pepper in an interspecific cross of Capsicum annuum and C. frutescens. Theor Appl Genet. 2003;106(8):1457–1466.
- Barchi L, Lefebvre V, Sage-Palloix AM, et al. QTL analysis of plant development and fruit traits in pepper and performance of selective phenotyping. Theor Appl Genet. 2009;118(6):1157–1171.
- Liu Y, Subhash C, Yan JB, et al. Maize leaf temperature responses to drought: thermal imaging and quantitative trait loci (QTL) mapping. Environ Exper Bot. 2011;71(2):158–165.
- Li PC, Kirungu JN, Lu HJ, et al. SSR-linkage map of interspecific populations derived from Gossypium Trilobum and Gossypium Thurberi and determination of genes harbored within the segregating distortion regions. PLoS One. 2018;13(11):e0207271. [cited 2019 Dec 06];
- Barchi L, Bonnet J, Boudet C, et al. A high-resolution, intraspecific linkage map of pepper (Capsicum annuum L.) and selection of reduced recombinant inbred line subsets for fast mapping. Genome. 2007;50(1):51–60.
- Dwivedi N, Kumar R, Paliwal R, et al. QTL mapping for important horticultural traits in pepper (Capsicum annuum L.). J Plant Biochem Biotechnol. 2015;24(2):154–160.
- Tanksley SD. Linkage relationships and chromosomal locations of enzyme-coding genes in pepper Capsicum annuum. Chromosoma. 1984;89(5):352–360.
- Lefebvre V, Palloix A, Caranta C, et al. Construction of an intraspecific integrated linkage map of pepper using molecular markers and doubled-haploid progenies. Genome. 1995;38(1):112–121.
- Kim S, Park M, Yeom SI, et al. Genome sequence of the hot pepper provides insights into the evolution of pungency in Capsicum species. Nat Genet. 2014;46(3):270–278.
- Qin C, Yu C, Shen Y, et al. Whole-genome sequencing of cultivated and wild peppers provides insights into Capsicum domestication and specialization. Proc Natl Acad Sci USA. 2014;111(14):5135–5140.
- Mimura Y, Inoue T, Minamiyama Y, et al. An SSR-based genetic map of pepper (Capsicum annuum L.) serves as an anchor for the alignment of major pepper maps. Breed Sci. 2012;62(1):93–98.
- Mardis ER. The impact of next-generation sequencing technology on genetics. Trends Genet. 2008;24(3):133–141.
- Schuster SC. Next-generation sequencing transforms today's biology. Nat Methods. 2008;5(1):16–18.
- Varshney RK, Nayak SN, May GD, et al. Next-generation sequencing technologies and their implications for crop genetics and breeding. Trends Biotechnol. 2009;27(9):522–530.
- Huang X, Feng Q, Qian Q, et al. High-throughput genotyping by whole-genome resequencing. Genome Res. 2009;19(6):1068–1076.
- Baird NA, Etter PD, Atwood TS, et al. Rapid SNP discovery and genetic mapping using sequenced RAD markers. PloS One. 2008;3(10):e3376.
- Poland JA, Brown PJ, Sorrells ME, et al. Development of high-density genetic maps for barley and wheat using a novel two-enzyme genotyping-by-sequencing approach. PLoS One. 2012;7(2):e32253.
- Davey JW, Hohenlohe PA, Etter PD, et al. Genome-wide genetic marker discovery and genotyping using next-generation sequencing. Nat Rev Genet. 2011;12(7):499–510.
- Elshire RJ, Glaubitz JC, Sun Q, et al. A robust, simple genotyping-by-sequencing (GBS) approach for high diversity species. PLoS One. 2011;6(5):e19379.
- Li H, Durbin R. Fast and accurate short read alignment with Burrows-Wheeler transform. Bioinformatics. 2009;25(14):1754–1760.
- Nielsen R, Paul JS, Albrechtsen A, et al. Genotype and SNP calling from next-generation sequencing data. Nat Rev Genet. 2011;12(6):443–451.
- Han K, Jeong HJ, Yang HB, et al. An ultra-high-density bin map facilitates high-throughput QTL mapping of horticultural traits in pepper (Capsicum annuum). DNA Res. 2016;23(2):81–91.
- He YX, Yuan WJ, Dong MF, et al. The first genetic map in sweet Osmanthus (Osmanthus fragrans Lour.) using specific locus amplified fragment sequencing. Front Plant Sci. 2017;8:1621.
- Zou XY, Gong JW, Duan L, et al. High-density genetic map construction and QTL mapping for fiber strength on Chr24 across multiple environments in a CCRI70 recombinant inbred lines population. Euphytica. 2018;214(6):102.
- Dong W, Wu DF, Li GS, et al. Next-generation sequencing from bulked segregant analysis identifies a dwarfism gene in watermelon. Sci Rep. 2018;8(1):2908.
- Mongkolporn O, Taylor PJ. Capsicum. In Kole C, editor. Wild crop relatives: genomic and breeding resources. Berlin: Springer; 2011. p. 43–57.
- Xu LH, Wang WY, Guo JJ, et al. Zinc improves salt tolerance by increasing reactive oxygen species scavenging and reducing Na+ accumulation in wheat seedlings. Biol Plant. 2014;58(4):751–757.
- Gao W, Xu FC, Guo DD, et al. Calcium-dependent protein kinases in cotton: insights into early plant responses to salt stress. BMC Plant Biol. 2018;18(1):15.
- Li W, Zhao F, Fang W, et al. Identification of early salt stress responsive proteins in seedling roots of upland cotton (Gossypium hirsutum L) employing iTRAQ-based proteomic technique. Front Plant Sci. 2015;6(6):732.
- Zhao X, Wang YJ, Wang YL, et al. Extracellular Ca2+ alleviates NaCl-induced stomatal opening through a pathway involving H2O2-blocked Na + influx in Vicia guard cells. J Plant Physiol. 2011;168(9):903–910.
- Ma L, Zhang H, Sun L, et al. NADPH oxidase AtrbohD and AtrbohF function in ROS-dependent regulation of Na⁺/K⁺homeostasis in Arabidopsis under salt stress. J Exp Bot. 2012;63(1):305–317.
- Xu F, Liu H, Xu Y, et al. Heterogeneous expression of the cotton R2R3-MYB transcription factor GbMYB60 increases salt sensitivity in transgenic Arabidopsis. Plant Cell Tiss Organ Cult. 2018;133(1):15–25.
- Lv S, Yu D, Sun Q, et al. Activation of gibberellin 20-oxidase 2 undermines auxin-dependent root and root hair growth in NaCl-stressed Arabidopsis seedlings. Plant Growth Regul. 2018;84(2):225–236.
- Zhang J, Wang F, Zhang C, et al. A novel VIGS method by agroinoculation of cotton seeds and application for elucidating functions of GhBI-1 in salt-stress response. Plant Cell Rep. 2018;37(8):1091–1100.
- Qi J, Song CP, Wang B, et al. Reactive oxygen species signaling and stomatal movement in plant responses to drought stress and pathogen attack. J Integr Plant Biol. 2018;60(9):805–826.
- Wang TP, Liu H, Hua HJ, et al. A vacuole localized beta-glucosidase contributes to drought tolerance in Arabidopsis. Chin Sci Bull. 2011;56(33):3538–3546.
- Liu LY, Li N, Yao CP, et al. Functional analysis of the ABA-responsive protein family in ABA and stress signal transduction in Arabidopsis. Chin Sci Bull. 2013;58(31):3721–3730.
- Zhang G, Lu T, Miao W, et al. Genome-wide identification of ABA receptor PYL family and expression analysis of PYLs in response to ABA and osmotic stress in Gossypium. Peer J. 2017;5:e4126.
- Gao ZY, Liu H, Wang HL, et al. Generation of the genetic mutant population for the screening and characterization of the mutants in response to drought in maize. Chin Sci Bull. 2014;59(8):766–775.
- Wang DJ, Yang CL, Dong L, et al. Comparative transcriptome analyses of drought-resistant and - susceptible Brassica napus L. and development of EST-SSR markers by RNA-Seq. J Plant Biol. 2015;58(4):259–269.
- Wang P, Yang CL, Chen H, et al. Transcriptomic basis for drought-resistance in Brassica napus L. Sci Rep. 2017;7:40532.
- Zhao Q, Chen W, Bian J, et al. Proteomics and phosphoproteomics of heat stress-responsive mechanisms in spinach. Front Plant Sci. 2018;9:800.
- Zhou HR, Xu M, Hou RX, et al. Thermal acclimation of photosynthesis to experimental warming is season dependent for winter wheat (Triticum aestivum L.). Environ Exper Bot. 2018;150:249–259.
- Zhang H, Yue MX, Zheng XK, et al. The role of promoter-associated histone acetylation of haem oxygenase-1 (HO-1) and giberellic acid-stimulated like-1 (GSL-1) genes in heat-induced lateral root primordium inhibition in maize. Front Plant Sci. 2018;9:1520.
- Cui G, Chai H, Yin H, et al. Full-length transcriptome sequencing reveals the low-temperature-tolerance mechanism of Medicago falcata roots. BMC Plant Biol. 2019;19(1):575.
- Lin DL, Xia JY, Wan SQ. Climate warming and biomass accumulation of terrestrial plants: a meta-analysis. New Phytol. 2010;188(1):187–198.
- Wan HJ, Zhao ZG, Ahmed AM, et al. Identification and characterization of potential NBS-encoding resistance genes and induction kinetics of a putative candidate gene associated with downy mildew resistance in Cucumis. BMC Plant Biol. 2010;10:186.
- Lu T, Zhang G, Sun L, et al. Genome-wide identification of CBL family and expression analysis of CBLs in response to potassium deficiency in cotton. Peer J. 2017;5:e3653.
- Li L, Hou M, Cao L, et al. Glutathione S-transferases modulate Cu tolerance in Oryza sativa. Environ Exp Bot. 2018;155:313–320.
- Liang JY, Xia JY, Liu LL, et al. Global patterns of the responses of leaf-level photosynthesis and respiration in terrestrial plants to experimental warming. J Plant Ecol. 2013; 6(6):437–447.
- Guo S, Dai S, Singh PK, et al. A membrane-bound NAC-like transcription factor OsNTL5 represses the flowering in Oryza sativa. Front Plant Sci. 2018;9:555.
- Pang Y, Li J, Qi B, et al. Aquaporin AtTIP5;1 as an essential target of gibberellins promotes hypocotyl cell elongation in Arabidopsis thaliana under excess boron stress. Funct Plant Biol. 2018;45(3):305–314.
- Zhao X, Wang YL, Qiao XR, et al. Phototropins function in high-intensity blue light-induced hypocotyl phototropism in Arabidopsis by altering cytosolic calcium. Plant Physiol. 2013;162(3):1539–1551.
- Lü D, Wang W, Miao C. ATHK1 acts downstream of hydrogen peroxide to mediate ABA signaling through regulation of calcium channel activity in Arabidopsis guard cells. Chin Sci Bull. 2013;58(3):336–343.
- Ma XN, Zhang XR, Yang L, et al. Hydrogen peroxide plays an important role in PERK4-mediated abscisic acid-regulated root growth in Arabidopsis. Funct Plant Biol. 2019;46(2):165–174.
- Büttner M, Truernit E, Baier K, et al. AtSTP3 a green leaf-specific low affinity monosaccharide-H+ symporter of Arabidopsis thaliana. Plant Cell Environ. 2000;23(2):175–184.
- Song Y, Xiang F, Zhang G, et al. Abscisic acid as an internal integrator of multiple physiological processes modulates leaf senescence onset in Arabidopsis thaliana. Front Plant Sci. 2016;7:181.
- Deng M, Wen J, Zhu H, et al. The hottest pepper variety in China. Genet Resour Crop Evol. 2009;56(5):605–608.
- Liu S, Chen C, Chen G, et al. RNA-sequencing tag profiling of the placenta and pericarp of pungent pepper provides robust candidates contributing to capsaicinoid biosynthesis. Plant Cell Tiss Organ Cult. 2012;110(1):111–121.
- Liu S, Li W, Wu Y, et al. De novo transcriptome assembly in chili pepper (Capsicum frutescens) to identify genes involved in the biosynthesis of capsaicinoids. PLoS One. 2013;8(1):e48156.
- Prince JP, Zhang Y, Radwanski ER, et al. A high yielding and versatile DNA extraction protocol for Capsicum. HortSci. 1997;32(5):937–939.
- Glaubitz JC, Casstevens TM, Lu F, et al. TASSEL-GBS: a high capacity genotyping by sequencing analysis pipeline. PLoS One. 2014;9(2):e90346.
- Altschul SF, Gish W, Miller W, et al. Basic local alignment search tool. J Mol Biol. 1990;215(3):403–410.
- Li H, Handsaker B, Wysoker A, et al. The sequence alignment/map format and SAMtools. Bioinformatics. 2009;25(16):2078–2079.
- Os HV, Stam P, Visser RGF, et al. Smooth: a statistical method for successful removal of genotyping errors from high-density genetic linkage data. Theor Appl Genet. 2005;112(1):187–194.
- Chunthawodtiporn J, Hill T, Stoffel K, et al. Quantitative trait loci controlling fruit size and other horticultural traits in bell pepper (Capsicum annuum). Plant Genome. 2018;11(1):1–11.
- Mimura Y, Minamiyama Y, Sano H, et al. Mapping for axillary shooting flowering date primary axis length and number of leaves in pepper (Capsicum annuum). J Japan Soc Hort Sci. 2010;79(1):56–63.
- Tan S, Cheng JW, Zhang L, et al. Construction of an interspecific genetic map based on InDel and SSR for mapping the QTLs affecting the initiation of flower primordia in pepper (Capsicum spp.). PLoS One. 2015;10(3):e0119389.
- Cheng J, Qin C, Tang X, et al. Development of a SNP array and its application to genetic mapping and diversity assessment in pepper (Capsicum spp.). Sci Rep. 2016;6:33293.
- Zygier S, Chaim AB, Efrati A, et al. QTLs mapping for fruit size and shape in chromosomes 2 and 4 in pepper and a comparison of the pepper QTL map with that of tomato. Theor Appl Genet. 2005;111(3):437–445.
- Sharma VK, Semwal CS. Uniyal SP. Genetic variability and character association analysis in bell pepper (Capsicum annuum L.). J Hortic For. 2010;2:58–65.
- Lu FH, Kwon SW, Yoon MY, et al. SNP marker integration and QTL analysis of 12 agronomic and morphological traits in F8 RILs of pepper (Capsicum annuum L.). Mol Cells. 2012;34(1):25–34.
- Lee J, Park SJ, Hong SC, Han JH, et al. QTL mapping for capsaicin and dihydrocapsaicin content in a population of Capsicum annuum ‘NB 1’× Capsicum chinense ‘Bhut Jolokia. Plant Breed. 2016;135(3):376–383.
- Zhu Z, Sun B, Wei J, et al. Construction of a high density genetic map of an interspecific cross of Capsicum chinense and Capsicum annuum and QTL analysis of floral traits. Sci Rep. 2019;9(1):1054.
- Yarnes SC, Ashrafi H, Reyes-Chin-Wo S, et al. Identification of QTLs for capsaicinoids, fruit quality, and plant architecture-related traits in an interspecific Capsicum RIL population. Genome. 2013;56(1):61–74.