
Abstract
Acute myeloid leukaemia (AML) is a common blood cancer with rapid progression and a high death rate. The aim of this study was to illustrate the molecular mechanism and identify potential prognostic genes by performing weighted gene coexpression network analysis (WGCNA) of AML. WGCNA of AML was performed with R software based on GDC The Cancer Genome Atlas (TCGA) Acute Myeloid Leukaemia (LAML) RNA-seq data from TCGA database. The gene modules showing significant correlation with the M0-M7 subtypes and the NPMc mutation were analysed using Gene Ontology and Kyoto Encyclopedia of Genes and Genomes pathway enrichment analyses. Hub genes from the key modules were identified using the cytoHubba package, and the prognostic values of these hub genes were analysed with a Cox proportional hazards model based on TCGA clinical data. A total of 151 patients from the TCGA database with RNA-seq data were included in the present study. The weighted gene coexpression network contained 21 coexpression modules. Three modules (blue, yellow and purple) were highly correlated with AML subtypes and the NPMc mutation. In total, six key hub genes were identified from the AML subtype- and NPMc mutation-related modules: TLR8, SLC15A3, ADAP2, HOXA6 and HOXA10. Kaplan–Meier curve analysis showed that the five hub genes in the gene expression network are significantly associated with AML prognosis. WGCNA of AML performed in the present study revealed potential prognostic genes that not only have important clinical significance for prognosis but also provide important clues for identifying effective targets in AML therapeutic strategies.
Introduction
Leukaemia, as the most common hematologic disease worldwide, causes more than 300,000 people to die each year [Citation1]. Although the outcomes have improved recently (with a 57% 5-year survival rate in America) [Citation2], leukaemia is still associated with a poor prognosis in developing countries [Citation3]. Generally, genetic [Citation4–6] and environmental factors [Citation7,Citation8] cause leukaemia jointly. Smoking, ionizing radiation, prior chemotherapy, down syndrome and exposure to chemicals such as benzene are major risk factors for leukaemia [Citation9–11]. Leukaemia comprises multiple types (including two acute and two chronic types) [Citation12,Citation13] with a different pathogenesis. Acute myeloid leukaemia (AML) shows rapid progression and causes a high death rate within weeks or months if not treated [Citation14,Citation15]. Records of AML by the American Cancer Society in 2016 showed that 19,950 new cases and 10,430 deaths occurred in the United States [Citation16]. In AML, abnormal cell accumulation in the bone marrow and blood hinders the normal function of blood cells [Citation17,Citation18]. The dysfunction of myeloblasts leads to the uncontrolled growth of immature clones of cells and results in AML [Citation19,Citation20]. In addition, cytogenetic abnormalities are found in AML patients, indicating that these cytogenetic factors may have prognostic significance [Citation21,Citation22]. In addition to cytological changes, mutations in several genes, including CEBPA, NPM1, FLT3, MLL, IDH1 or IDH2, DNMT3A and ASXL1, are associated with the prognosis of AML [Citation23–25].
Weighted gene coexpression network analysis (WGCNA) is a popular approach to build biological gene networks by analysing pairwise correlations between genes [Citation26]. Compared to unweighted correlation networks, WGCNA uses a soft threshold that prevents information loss during processing [Citation27]. To date, this approach has been employed to construct coexpression modules for genes [Citation28], microRNAs [Citation29], long noncoding RNAs (lncRNAs) [Citation30] and even DNA methylations [Citation31]. In addition to the construction of coexpressing modules, WGCNA is also used to find hub genes by determining genes and module eigengenes. By using WGCNA, Pan et al. first identified potential lncRNA modules as prognostic biomarkers in AML [Citation32]. In another study, Luo et al. showed a relapse factor and mechanism in T cell acute leukaemia via WGCNA [Citation33]. WGCNA of single-cell gene expression data revealed a core module between granulocyte/monocyte progenitors (GMPs) and leukaemia networks [Citation34]. These studies opened a new horizon for illustrating complex biological systems in leukaemia pathogenesis.
To elucidate the dynamic changes and identify potential core modules during AML development, we analysed 151 tissue samples from The Cancer Genome Atlas (TCGA) database, representing the stepwise progression of AML from the M0–M7 subtypes. These transcriptome data with clinical trait information also facilitate trait-gene expression correlation studies. To the best of our knowledge, this is the pioneer report elucidating global gene expression changes in AML by WGCNA, although several studies have investigated the gene expression network using unweighted correlation network analyses.
Previously, thymidine kinase 1 [Citation35] and bax [Citation36] expression have been confirmed as prognostic and diagnostic indicator in AML patients. Although these indicators are demonstrated as potential indicators for AML, disease, diagnostic/prognostic indicators are still scarce, especially in different subtypes of AML. In the present study, we aimed to identify new biomarkers for AML early diagnosis and prognosis. Thus, by using a gene expression dataset from databases, we constructed a coexpression network with the WGCNA method and identified 21 modules in these genes. The correlation of AML progression and modules was estimated. The enrichment of canonical GO terms and KEGG pathways of the modules was analysed on three modules closely related to AML subtypes and the NPMc mutation which is a well-known mutation that drives AML development as an oncogene [Citation37]. Then, we performed an upstream regulator analysis and identified hub genes in two modules. The expression changes and possible use of the diagnostic indicators of these hub genes for AML are discussed. The present results highlight the advantages of regulatory networks combined with a functional module analysis in elucidating the mechanism and determining prognostic biomarkers in AML.
Materials and methods
Data and processing
The transcriptome data of AML were downloaded from the TCGA database (https://xenabrowser.net/datapages/?cohort=GDC%20TCGA%20Acute%20Myeloid%20Leukemia%20(LAML)&removeHub = https%3A%2F%2Fxena.treehouse.gi.ucsc.edu%3A443). A total of 151 samples which had key information of phenotypes were included in the present study (Supporting Information DATA SCitation1 and DATA SCitation2). The patients covered the M0–M7 subtypes, including acute myeloblastic leukaemia with minimal maturation, acute myeloblastic leukaemia with maturation, acute promyelocytic leukaemia, acute myelomonocytic leukaemia, acute myelomonocytic leukaemia with eosinophilia, acute monocytic leukaemia, acute erythroid leukaemia and acute megakaryoblastic leukaemia. The fragments per kilobase of transcript per million mapped reads (FPKM) of the genes were used to construct the network (Supporting Information DATA SCitation1). First, the threshold of the top 25% variance of expression values of the transcripts were retained. Then, we used PCA analysis to check covariates and cofounders of these data.
Construction of the weighted gene coexpression network
WGCNA was applied to identify the coexpression network of all genes in the dataset. WGCNA is a newly developed approach to find key gene sets and hub genes in specific phenotypes of organisms by mathematical methods which is not based on previous biological findings. Using this method, new critical genes participating in AML and potential prognostic and diagnostic indicator for AML patients could be identified. In this study, we used the WGCNA package in R and selected the power of β = 9 as the soft-thresholding estimator to ensure a scale-free network. The parameters were: networkType = unsigned and the minModuleSize = 30. The highly correlated coexpression module is shown as a topological overlap matrix plot. We used a one-step function to generate the network and detect the consensus modules. The constructed modules were assigned different colours. To determine the coexpression similarity of the modules, the eigengene adjacency of the correlations between modules was calculated in a pairwise fashion.
GO and KEGG enrichment analyses of the coexpression modules
The blue, yellow and purple modules that showed a strong correlation with AML subtypes and the NPMc mutation were subjected to GO and KEGG enrichment analyses by DAVID, an online gene functional classification tool (https://david.ncifcrf.gov/). The GO terms and KEGG pathways were confirmed as enrichment when p < 0.05. A heatmap showing the p value of the GO and KEGG enrichment analyses was drawn.
Identification of hub genes
The correlation weight value from each gene in the blue, yellow and tan modules was generated with the WGCNA package. The gene correlations were visualized using Cytoscape (v3.7.1). Using the cytoHubba package, we identified the hub genes that were highly interconnected with nodes in a module with the maximal clique centrality method. The top genes with correlation weight value > 0.1 were defined as hub genes.
Kaplan-Meier survival analysis
Available data and tools from the SurvExpress website (http://bioinformatica.mty.itesm.mx:8080/Biomatec/SurvivaX.jsp) were employed to evaluate the prognostic values for AML. Data were obtained from the TCGA. Two clinical datasets were used: AML TCGA (containing data from 168 patients) and LAML - TCGA - AML (containing data from 149 patients). The hub genes (TLR8, SLC15A3, ADAP2, HOXA6 and HOXA10) were used as input. The risk score obtained from Cox fitting was used to generate risk groups based on the median risk score. Kaplan-Meier plots were drawn, log-rank tests were performed to analyse differences between risk groups, and hazard ratios were estimated.
Results and discussion
Data processing
AML is a common type of leukaemia in adults that threatens human health worldwide. The main objective of the present study was to unveil the molecular mechanism of the subtypes of AML and identify potential candidate gene groups associated with prognosis by constructing a gene coexpression network using WGCNA and data from the TCGA. We identified significantly changed modules that were highly correlated with morphology (M0–M7 subtypes), and the key modules were annotated with GO terms and KEGG pathway enrichment analyses. Subsequently, the hub genes in these modules were identified, and their prognostic values in AML were evaluated.
In total, 151 samples with RNA-seq data were downloaded from the TCGA database. The expression data were used for WGCNA. The clinical characteristics are shown in . The age of the patients ranged from 20 to 90 years. The 151 patients covered the M0-M7 subtypes, and the NPMc mutation was recorded in 151 patients (33 NPMc-positive and 117 NPMc-negative; ). First, the data downloaded from GEO followed normalization and PCA analysis was performed. The PCA plots showed that the variation in different groups had no significant difference. Thus, WGCNA analysis from the tested samples was reasonable ().
Figure 1. PCA analysis of the M0–M7 subtypes using the FPKM of the data for the present study.
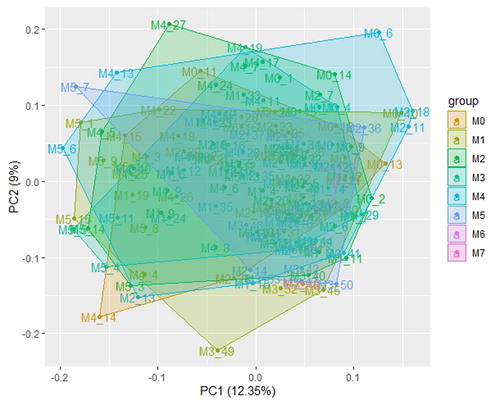
Table 1. Clinical characteristics for all patients.
Construction of the weighted gene coexpression network from AML samples
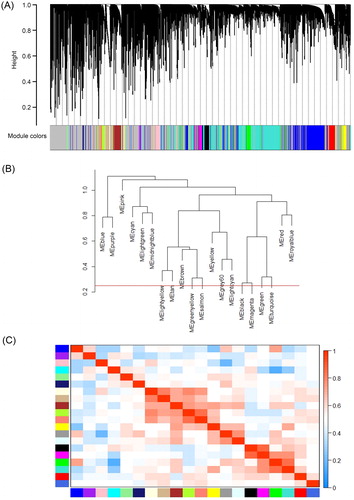
The soft-thresholding power based on the criterion of approximate scale-free topology was defined as 9. The value of 9 was the lowest power for the curve that made the scale-free topology fit index flat upon reaching a value above 0.9 () and showed moderate mean connectivity (). The weighted gene coexpression network was constructed from the filtered probes, and 21 modules contained 14,536 genes, 511 microRNAs and 74 lincRNAs were identified (; Supporting Information DATA SCitation3). The interactions of the 21 coexpression modules were analysed with eigengene networks (). The transcripts number ranged from 35 to 2920 for each module. Generally, the modules were clustered into two main clades, including a small clade with only 2 modules and a large clade with 19 other modules. The eigengene adjacency heatmap showed the correlations between the modules ().
Figure 2. Network topology constructed with the WGCNA package from R to evaluate the soft-thresholding power. The numbers in the figure show the corresponding soft-thresholding powers. The scale-free topology model indicates that the soft-thresholding power of 9 is optimal.
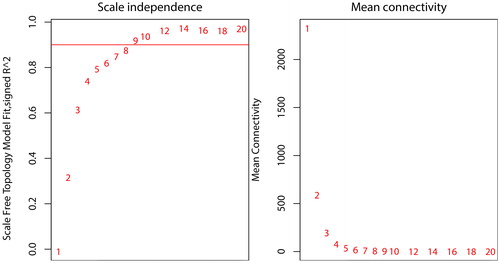
Figure 3. WGCNA of AML. (A) Gene modules identified by WGCNA are shown by clustering the dissimilarity based on the consensus topological overlap using different colours. Each colour represents a module containing a group of highly correlated genes. (B) The dendrogram of consensus module eigengenes based on the consensus correlation. The red line shows the merging threshold. The expression profiles of the module eigengenes below the threshold could be merged due to their similarity. (C) Heatmap of the adjacencies of modules. The adjacency ranged from 0 to 1 (blue to red).
Correlations between the modules and phenotypes
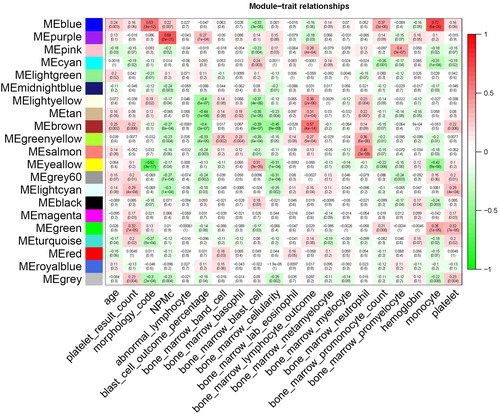
Multiple modules were found to be correlated with the M0–M7 subtypes of AML. In total, six modules had a high correlation (p < 0.05) with the subtypes of AML (morphology code). The highest positively correlated module was the blue module (R2 = 0.53), and the highest negatively correlated module was the yellow module (R2 = –0.62). In addition to the subtypes of AML, we also observed NPMc, a common mutation in AML. The most correlated module was the tan module, with R2 = 0.68 and p = 2e – 21 (). These modules were correlated with AML progression and thus focused on the following analyses.
Figure 4. Correlations between consensus module eigengenes and the phenotypes of AML. Rows and columns represent the consensus module and phenotypes, respectively. In the cells, the numbers indicate the correlations of the corresponding module eigengenes and the phenotypes. The numbers in brackets show the p values. The correlation ranged from –1 to 1 (green to red).
Functional enrichment analysis
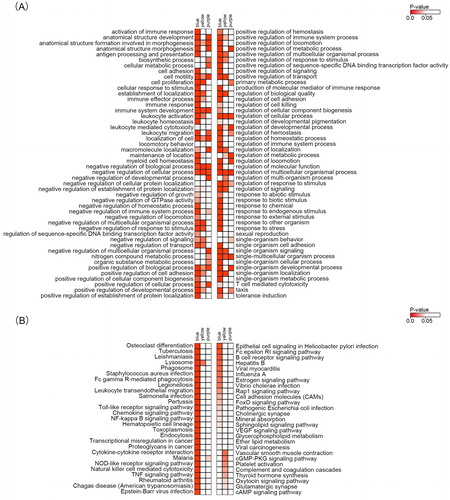
The highest correlated modules with AML subtypes and the NPMc mutation, including the blue, yellow and purple modules, were used for the functional enrichment analysis. The most enriched GO terms in the purple module were cellular processes, anatomical structure development and the regulation of metabolic processes. In the blue module, the genes were enriched in the immune response, the regulation of immune system processes and regulation of the response to stimuli. The regulation of cellular processes, the regulation of metabolic processes and biosynthetic processes were the most enriched GO terms in the yellow module (). Regarding the KEGG pathways, malaria was enriched in the purple module. The most enriched pathways in the blue module were osteoclast differentiation, tuberculosis, lysosome and other pathways. In the yellow module, the most enriched pathways were lysosome, vascular smooth muscle contraction, the cGMP-PKG signalling pathway, and other pathways ().
Figure 5. GO and KEGG enrichment analyses of key modules correlated with AML subtypes and the NPMc mutation. (A) The enrichment analysis of GO terms in the tan, blue and yellow modules shown as a heatmap. The colours represent p values ranging from 0.0 to 0.05 (red to white). (B) The enrichment analysis of KEGG pathways in the tan, blue and yellow modules shown as a heatmap. The colours represent p values ranging from 0.0 to 0.05 (red to white).
The most correlated modules with morphology were the blue and yellow modules. The blue module was enriched in immune-related functions, such as the immune response, the regulation of immune system processes and regulation of the response to stimuli, which were changed significantly in all AML subtypes, and the changes in this module were exacerbated with progression. Recently, the tumour microimmune environment has received increased attention with the development of immunology and immunotherapy in cancer [Citation38–40]. Tumour-infiltrating lymphocytes [Citation38] have been demonstrated to participate in several types of cancer, including AML. The immune genes that are also sensitive to chemotherapy and radiotherapy have been regarded as effective prognostic predictors, such as CCL5, CXCL9, CXCL13, CD80, CD21, CD8A and IGKC [Citation41]. Thus, the identification of the immune-related module provides a full glance of the roles of immune genes in the progression of AML.
The yellow and purple modules showed enrichment in functional genes associated with cellular and metabolic processes. It is well known that cellular processes, including proliferation, are altered at the very early stage of AML. When abnormal cell proliferation occurs with metabolic dysfunction in tissues, oncogenesis occurs. It seems that immune changes and cellular and metabolic dysfunction drive AML progression. This evidence suggests that altered energy metabolism is a crucial change in AML, consistent with recent studies [Citation42–44]. Glycolytic flux provides the dominant energy source for cancer cells due to defective mitochondrial respiration [Citation45,Citation46]. We found that in AML, metabolism, especially the regulation of lipolysis in adipocytes, the cGMP-PKG signalling pathway and the purine metabolism pathway, is associated with the development of AML subtypes. These findings suggest that multiple genes constitute modules together that promote AML progression.
Hub gene analysis
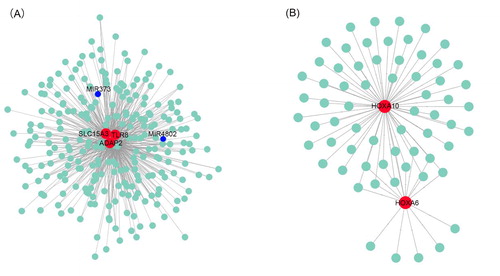
To further identify hub genes in the modules related to AML subtypes and the NPMc mutation, we first qualified their relevance using the MMC method based on the eigenvalues of the network modules. We identified the blue and purple modules which were positively correlated with AML subtypes and NPMc. The blue module had the highest gene significance for TLR8, SLC15A3 and ADAP2 (). Meanwhile, we found that two microRNAs including miR-373 and miR-4802 were included in these gene networks, suggesting epigenetic regulation by these hub genes. These three hub genes were correlated with 235, 170 and 180 genes, respectively. In the purple module, HOXA6 and HOXA10 were the top two hub genes, which were correlated with 15 and 61 genes, respectively (; Supporting Information DATA SCitation4).
Figure 6. Protein–protein interaction networks of genes in the blue (A) and purple (B) modules constructed with Cytoscape v3.7.1 software. The red dots represent hub genes identified by cytoHubba, and blue dots represent correlated genes.
Kaplan-Meier survival analysis
Kaplan-Meier survival analysis was used to determine the relationship between the gene expression levels of hub genes and the survival rate of AML patients to show the prognostic values of the genes. We used three genes from the five hub genes, namely, SLC15A3, HOXA6 and HOXA10, as multigene biomarkers for clinical outcomes. The expression levels of the three hub genes were significantly high (p < 0.05) in the high-risk group ( and ). These results indicate that the hub genes are able to effectively distinguish the risk for AML prognosis.
Figure 7. Prognostic analyses of hub genes (TLR8, SLC15A3, ADAP2, HOXA6 and HOXA10) in the AML TCGA dataset based on SurvExpress (n = 168). Kaplan–Meier survival analysis of AML based on the expression of the hub genes. ‘+’ on the right upper figure represents censored samples. The concordance index (CI) and p value of the log-rank test are shown in the figure. Red and green lines indicate the high- and low-risk groups, respectively. The numbers below the x-axis show the death events of individuals over time.
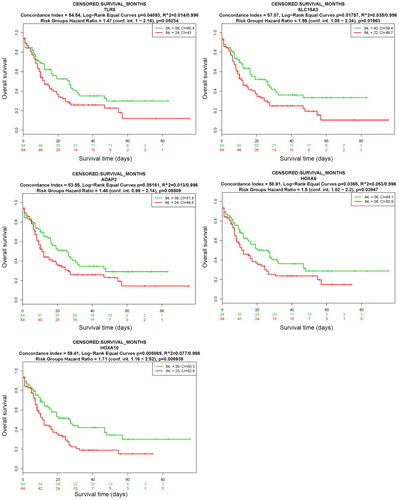
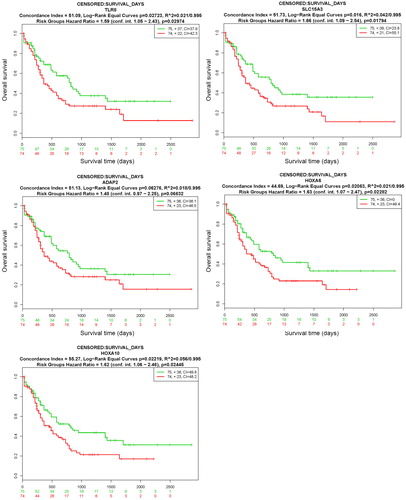
Figure 8. Prognostic analyses of hub genes (TLR8, SLC15A3, ADAP2, HOXA6 and HOXA10) in the LAML - TCGA - AML dataset based on SurvExpress (n = 149). Kaplan–Meier survival analysis of AML based on the expression of the hub genes. ‘+’ in the right upper panel represents censored samples. The CI and p value of the log-rank test are shown in the figure. Red and green lines indicate the high- and low-risk groups, respectively. The numbers below the x-axis show the death events of individuals over time.
In the module, multiple genes that showed a correlation were coregulated in cancer cells. Among these genes, the hub genes that are highly interconnected with nodes in a module have been recognized as functionally significant. The hub genes from the immune-related blue module contained TLR8, SLC15A3 and ADAP2. Thus, TLR8 agonists could be a potential therapeutic strategy for AML. The present results also support the role of TLR8 in promoting AML [Citation47]. High SLC15A3 expression has been shown in a previous study of AML [Citation48]. Moreover, the methylation levels of SLC15A3 were different between LNM-positive and -negative samples, which could be used to predict LNM in ESCC [Citation49]. In the present study, we also demonstrated that these two genes were correlated with miRNAs which may regulate AML in an epigenetic mechanism. In accordance with these results, the involvement of SLC15A3 in AML progression is not surprising. In cancer, ADAP2 binds to β-tubulin and COPRS, which mediates the stability of microtubules and activates oncogenes [Citation50]. However, there are no results regarding ADAP2 function in AML. In the present study, we first found that ADAP2 is a hub gene in an immune-related module that demonstrates the significant functions of these genes in AML. In the tan module, we identified HOXA6 and HOXA10 as hub genes. In addition, we found that the expression levels of HOXA6 and HOXA10 were significantly high in AML. This result is similar to findings in lung adenocarcinomas [Citation51], breast cancer [Citation52] and prostate cancer [Citation53]. However, no such evidence has been reported in AML. These three genes from the Hox family are upregulated in AML. Taken together, these data suggest that the Hox genes are activated with AML progression.
Several studies have suggested that the expression levels of key genes could be considered prognostic indicators. In the novel gene expression network, we evaluated six hub genes as potential prognostic genes, and the results showed that these genes that were highly expressed in AML could be used for prognostic and diagnostic purposes. Cox analysis using the Cox proportional hazards model confirmed these gene sets in two series of AML patients from the TCGA database. The expression levels of FIS1, SPI1, PDCD7 and Ang2 as prognostic indicators have been demonstrated in 100 newly diagnosed cytogenetically normal (CN-AML) patients using the real-time quantitative polymerase chain reaction (qPCR) method [Citation54]. Compared to the qPCR approach, high-throughput sequencing data provide more systematic information. Nevertheless, limitations exist in the present study. We did not validate the levels of gene expression in tissue samples to confirm our findings. Further study is needed to verify our study findings and unravel the mechanism of the hub genes in AML.
Conclusions
The present study provides numerous potential prognostic genes, and the functional modules are presented systematically. A weighted gene coexpression network was constructed of AML with important clinical significance for early diagnosis and prognosis in AML. Of note, TLR8, SLC15A3, ADAP2, HOXA6 and HOXA10 are potential indicators for early diagnosis and prognosis. This pipeline for identifying new biomarkers could be used in other types of disease. Further biological experiments are needed to evaluate the functions and potential prognostic values of these hub genes.
Supplemental Material
Download MS Excel (36.1 KB)Supplemental Material
Download MS Excel (8.4 MB)Supplemental Material
Download MS Excel (25.7 KB)Supplemental Material
Download MS Excel (25.6 MB)Disclosure statement
No potential conflict of interest was reported by the authors.
Data availability
The gene expression profiles and phenotype datasets of this study are provided as the Supporting Information Data Sheets S1, S2.
Additional information
Funding
Related Research Data
References
- Wang H, Naghavi M, Allen C, et al. Global, regional, and national life expectancy, all-cause mortality, and cause-specific mortality for 249 causes of death, 1980–2015: a systematic analysis for the Global Burden of Disease Study 2015. Lancet. 2016;388(10053):1459–1544.
- Sites A. SEER cancer statistics review 1975-2011. Bethesda (MD): National Cancer Institute; 2014.
- Bray F, Ferlay J, Soerjomataram I, et al. Global cancer statistics 2018: GLOBOCAN estimates of incidence and mortality worldwide for 36 cancers in 185 countries. CA Cancer J Clin. 2018;68(6):394–424.
- Li S, Garrett-Bakelman FE, Chung SS, et al. Distinct evolution and dynamics of epigenetic and genetic heterogeneity in acute myeloid leukemia. Nat Med. 2016;22(7):792–799.
- Timms JA, Relton CL, Rankin J, et al. DNA methylation as a potential mediator of environmental risks in the development of childhood acute lymphoblastic leukemia. Epigenomics. 2016;8(4):519–536.
- Iacobucci I, Mullighan CG. Genetic basis of acute lymphoblastic leukemia. J Clin Oncol. 2017;35(9):975–983.
- Tadmor T, Polliack A. Epidemiology and environmental risk in hairy cell leukemia. Best Pract Res Clin Haematol. 2015;28(4):175–179.
- Metayer C, Dahl G, Wiemels J, et al. Childhood leukemia: a preventable disease. Pediatrics. 2016;138(Suppl. 1):S45–S55.
- Williams LA, Yang JJ, Hirsch BA, et al. Is there etiologic heterogeneity between subtypes of childhood acute lymphoblastic leukemia? A review of variation in risk by subtype. Cancer Epidemiol Biomarkers Prev. 2019;28(5):846–856.
- Barrington-Trimis JL, Cockburn M, Metayer C, et al. Trends in childhood leukemia incidence over two decades from 1992 to 2013. Int J Cancer. 2017;140(5):1000–1008.
- Bazyka D, Finch S, Ilienko I, et al. Buccal mucosa micronuclei counts in relation to exposure to low dose-rate radiation from the Chornobyl nuclear accident and other medical and occupational radiation exposures. Environ Health. 2017;16(1):23–70.
- Sun CC, Li SJ, Chen ZL, et al. Expression and prognosis analyses of runt-related transcription factor family in human leukemia. Mol Ther Oncolyt. 2019;12:103–111.
- Rabbitts TH. Translocations, master genes, and differences between the origins of acute and chronic leukemias. Cell. 1991;67(4):641–644.
- Bonnet D, Dick JE. Human acute myeloid leukemia is organized as a hierarchy that originates from a primitive hematopoietic cell. Nat Med. 1997;3(7):730–737.
- Shallis RM, Wang R, Davidoff A, et al. Epidemiology of acute myeloid leukemia: recent progress and enduring challenges. Blood Rev. 2019;36:70–87.
- Siegel RL, Miller KD, Jemal A. Cancer statistics, 2016. CA Cancer J Clin. 2016;66(1):7–30.
- Tan TK, Zhang C, Sanda T. Oncogenic transcriptional program driven by TAL1 in T-cell acute lymphoblastic leukemia. Int J Hematol. 2019;109(1):5–17.
- Mrózek K, Marcucci G, Paschka P, et al. Clinical relevance of mutations and gene-expression changes in adult acute myeloid leukemia with normal cytogenetics: are we ready for a prognostically prioritized molecular classification?. Blood. 2007;109(2):431–448.
- Consoli ML, Romano A, Parrinello NL, et al. Unusual karyotype in acute myelomonocitic leukemia: a case report. Anticancer Res. 2019;39(8):4329–4332.
- Li S, Bian H, Cao Y, et al. Identification of novel lncRNAs involved in the pathogenesis of childhood acute lymphoblastic leukemia. Oncol Lett. 2019;17(2):2081–2090.
- Schlenk RF, Döhner K, Krauter J, et al. Mutations and treatment outcome in cytogenetically normal acute myeloid leukemia. N Engl J Med. 2008;358(18):1909–1918.
- Canaani J, Labopin M, Itälä-Remes M, et al. Prognostic significance of recurring chromosomal abnormalities in transplanted patients with acute myeloid leukemia. Leukemia. 2019;33(8):1944–1952.
- Wang SY, Cheng WY, Mao YF, et al. Genetic alteration patterns and clinical outcomes of elderly and secondary acute myeloid leukemia. Hematol Oncol. 2019;37(4):456–463.
- Patel JP, Gönen M, Figueroa ME, et al. Prognostic relevance of integrated genetic profiling in acute myeloid leukemia. N Engl J Med. 2012;366(12):1079–1089.
- Papaemmanuil E, Gerstung M, Bullinger L, et al. Genomic classification and prognosis in acute myeloid leukemia. N Engl J Med. 2016;374(23):2209–2221.
- Zhang B, Horvath S. A general framework for weighted gene co-expression network analysis. Stat Appl Genet Mol Biol. 2005;4(1):7.
- Ruan J, Dean AK, Zhang W. A general co-expression network-based approach to gene expression analysis: comparison and applications. BMC Syst Biol. 2010;4(1):8.
- Yang Y, Han L, Yuan Y, et al. Gene co-expression network analysis reveals common system-level properties of prognostic genes across cancer types. Nat Commun. 2014;5:3231.
- Most D, Leiter C, Blednov YA, et al. Synaptic microRNAs coordinately regulate synaptic mRNAs: perturbation by chronic alcohol consumption. Neuropsychopharmacology. 2016;41(2):538–548.
- Casero D, Sandoval S, Seet CS, et al. Long non-coding RNA profiling of human lymphoid progenitor cells reveals transcriptional divergence of B cell and T cell lineages. Nat Immunol. 2015;16(12):1282–1291.
- Gonzalez-Jaramillo V, Portilla-Fernandez E, Glisic M, et al. The role of DNA methylation and histone modifications in blood pressure: a systematic review. J Hum Hypertens. 2019;33(10):703–715.
- Pan JQ, Zhang YQ, Wang JH, et al. lncRNA co-expression network model for the prognostic analysis of acute myeloid leukemia. Int J Mol Med. 2017;39(3):663–671.
- Luo M, Zhang Q, Xia M, et al. Differential co-expression and regulatory network analysis uncover the relapse factor and mechanism of t cell acute leukemia. Mol Ther Nucleic Acids. 2018;12:184–194.
- Saadatpour A, Guo G, Orkin SH, et al. Characterizing heterogeneity in leukemic cells using single-cell gene expression analysis. Genome Biol. 2014;15(12):525.
- O'Neill K, Zhang F, Li H, et al. Thymidine kinase 1-a prognostic and diagnostic indicator in ALL and AML patients. Leukemia. 2007;21(3):560–563.
- Ong YL, McMullin MF, Bailie KEM, et al. High bax expression is a good prognostic indicator in acute myeloid leukaemia. Br J Haematol. 2000;111(1):182–189.
- Falini B, Nicoletti I, Martelli MF, et al. Acute myeloid leukemia carrying cytoplasmic/mutated nucleophosmin (NPMc + AML): biologic and clinical features. Blood. 2007;109(3):874–885.
- Teng F, Meng X, Wang X, et al. Expressions of CD8 + TILs, PD-L1 and Foxp3 + TILs in stage I NSCLC guiding adjuvant chemotherapy decisions. Oncotarget. 2016;7(39):64318–64329.
- Mandai M, Hamanishi J, Abiko K, et al. Immunology and immunotherapy in ovarian cancer. In: Frontiers in ovarian cancer science. Heidelberg, Germany: Springer; 2017. p. 225–242.
- Zhao Q, Cao L, Guan L, et al. Immunotherapy for gastric cancer: dilemmas and prospect. Brief Funct Genomics. 2019;18(2):107–112.
- Bedognetti D, Hendrickx W, Marincola FM, et al. Prognostic and predictive immune gene signatures in breast cancer. Curr Opin Oncol. 2015;27(6):433–444.
- Ma X, Park Y, Mayne ST, et al. Diet, lifestyle, and acute myeloid leukemia in the NIH–AARP cohort. Am J Epidemiol. 2010;171(3):312–322.
- Chyla BJ, Harb J, Mantis C, et al. Response to venetoclax in combination with low intensity therapy (LDAC or HMA) in untreated patients with acute myeloid leukemia patients with IDH, FLT3 and other mutations and correlations with BCL2 family expression. Blood. 2019;134(Supplement_1):546–546.
- Pollyea DA, Stevens BM, Jones CL, et al. Venetoclax with azacitidine disrupts energy metabolism and targets leukemia stem cells in patients with acute myeloid leukemia. Nat Med. 2018;24(12):1859–1866.
- Bryan TO, Neil O, Gary RF, et al. Follow the ATP: tumor energy production: a perspective. Anticancer Agents Med Chem. 2014;14(9):1187–1198.
- Chen WL, Wang YY, Zhao A, et al. Enhanced fructose utilization mediated by SLC2A5 is a unique metabolic feature of acute myeloid leukemia with therapeutic potential. Cancer Cell. 2016;30(5):779–791.
- Ignatz-Hoover JJ, Wang H, Moreton SA, et al. The role of TLR8 signaling in acute myeloid leukemia differentiation. Leukemia. 2015;29(4):918–926.
- Payton JE, Grieselhuber NR, Chang LW, et al. High throughput digital quantification of mRNA abundance in primary human acute myeloid leukemia samples. J Clin Invest. 2009;119(6):1714–1726.
- Nagata H, Kozaki K-I, Muramatsu T, et al. Genome-wide screening of DNA methylation associated with lymph node metastasis in esophageal squamous cell carcinoma. Oncotarget. 2017;8(23):37740–37750.
- Pertesi M, Ekdahl L, Palm A, et al. Essential genes shape cancer genomes through linear limitation of homozygous deletions. Commun Biol. 2019;2:262.
- Abe M, Hamada J-I, Takahashi O, et al. Disordered expression of HOX genes in human non-small cell lung cancer. Oncol Rep. 2006;15(4):797–802.
- Hur H, Lee JY, Yun HJ, et al. Analysis of HOX gene expression patterns in human breast cancer. Mol Biotechnol. 2014;56(1):64–71.
- Kuo TL, Cheng KH, Chen LT, et al. Deciphering the potential role of Hox genes in pancreatic cancer. Cancers. 2019;11(5):734.
- Abo Elwafa R, Gamaleldin M, Ghallab O. The clinical and prognostic significance of FIS1, SPI1, PDCD7 and Ang2 expression levels in acute myeloid leukemia. Cancer Genet. 2019;233–234:84–95.