
Abstract
Quinoa (Chenopodium quinoa Willd.) cultivars that produce black grains are thought to be more nutritious and contain powerful antioxidant properties, but little is known about the chemical foundation and the genetic mechanism behind this trait. In this research, widely-targeted metabolome and transcriptome analyses were employed to unveil the chemical and genetic differences between black and white quinoa cultivars. A total of 157 differentially expressed metabolites were found in the black and white quinoa cultivars. The tannins and flavonoids were present at high levels in the black quinoa grains. The tannins comprised 13 proanthocyanins, all of which could barely be detected in white grains. Proanthocyanidins are suggested to cause the black grain trait in Arabidopsis thaliana and Brassica species and are thought to produce the black grain trait, while contributing to antioxidant activity, in black grain quinoa. A total of 4620 differentially expressed unigenes were identified in the black and white quinoa grains. Structural genes associated with proanthocyanin biosynthesis, particularly DFR, LAR, LDOX and ANR, were more highly expressed in black than white grains. Genes involved in the betalain biosynthetic pathway, which competes with anthocyanin biosynthesis, showed relatively lower levels of expression in black grains. Two MYB and one MYC transcription factor related to the phenylpropane metabolic pathway displayed higher expression levels in black grains, while BvMYB1, associated with betalain biosynthesis, was not detected. This study suggested that the accumulation of proanthocyanins produces the black grain trait in quinoa, and the activation of transcription factors triggers the proanthocyanidin biosynthesis pathway.
Introduction
Quinoa (Chenopodium quinoa Willd.) is a grain native to the Andean highlands in America. Quinoa, as a feedstock, holds an important economic and cultural background. Its remains have been discovered at various archeological sites [Citation1]. Quinoa is considered to be a pseudo-cereal, and has received much attention over recent years in China. The grains are the main edible parts of the quinoa plant and contain high levels and fine quality of proteins, which are important for physiological and ecological functions and in human health [Citation2, Citation3]. Moreover, quinoa has a high antioxidant capacity, because of its flavonoid and betalain content [Citation4–6]. These two classes of chemicals also promote different gran colors including white, black, yellow, red-violet and so on [Citation7]. The grains of yellow and red-violet varieties accumulate betanin and its isomer isobetanin [Citation6, Citation8, Citation9]. Although the main commercial varieties are white or black in color, the chemical foundation of and genetic mechanism underlying these traits are unknown.
The chemical structures and biosynthetic pathways of betalains and flavonoids are relatively well understood. Betalains are water-soluble nitrogen-containing pigments that contain betalamic acid as the chromophore, whereas flavonoids comprise isoflavones, flavones, flavonols and proanthocyanidins etc. The betalain biosynthetic pathway contains some spontaneous and enzymatically catalyzed chemical reactions and has been described in detail by Polturak et al. [Citation10]. The main enzymes include CYP76AD1, CYP76AD5, CYP76AD6, 4,5-DOPA dioxygenase (DODA), B5GT, B6GT and cDOPA5GT, which are activated by the MYB-like protein [Citation11–19]. Moreover, the structural and regulatory genes involved in the biosynthesis of phenolic compounds have been identified in many plants [Citation20–23]. The structural genes associated with betalain and phenolic compound biosynthesis are regulated by the MYB transcription factor and MYB–bHLH–WD40 complex, respectively [Citation24]. Betalains and phenolics are derived from tyrosine and phenylalanine, respectively. This relatively clear understanding of structure and biosynthesis provides a background to investigate the role of betalains and phenolics in producing the black grain trait in quinoa.
Widely-targeted metabolome analysis, based on an ultra-high performance liquid chromatography electrospray ionization tandem mass spectrometry [(UP)LC-ESI-MS/MS] system, offering advantages in throughput, coverage, period and sensitivity, has been employed comprehensively to investigate secondary metabolites in a variety of crops [Citation25–30]. Next-generation sequencing technology can serve as an effective method for transcript profiling and acquiring corresponding nucleotide sequences in plants [Citation31,Citation32]. In this study, widely-targeted metabolome and comparative transcriptome analyses were used to reveal the metabolite and transcriptome differences between black and white quinoa grains and determine the chemical foundation and the genetic mechanism of the black grain trait, in order to promote the utilization and development of black quinoa.
Materials and methods
Plant materials
C. quinoa Willd. cultivars ‘QBL 1’ and ‘QHL 1’ were used in this study. The grain colors of ‘QBL 1’ and ‘QHL 1’ are white and black, respectively. The two varieties were collected from the Qinghai Academy of Agriculture and Forestry Sciences and planted in the plantation area of Qinghai University in Qinghai Province, China (36°73′ N, 101°74′ E, altitude 2314 m). Grains were harvested separately from three individual plants at the grain-filling stage, and there were three biological replicates of each cultivar.
Metabolic profiling
Freeze-dried quinoa grains were crushed, and the resulting powder was extracted with aqueous methanol (70%) at 4 °C overnight. The extracts were passed through a CNWBOND Carbon-GCB solid-phase extraction cartridge (ANPEL, Shanghai, China) and filtered using a nylon syringe filter (SCAA-104, 0.22 μm pore size; ANPEL, Shanghai, China) after centrifugation. The extracts were then analyzed using UPLC-ESI-MS/MS (UPLC, Shim-pack UFLC SHIMADZUCBM30A system; MS, Applied Biosystems QTRAP 4500) by Wuhan MetWare Biotechnology Co. Ltd. (Wuhan, China). Wang et al. [Citation30] and Chen et al. [Citation27] described the UPLC conditions, ESI-Q TRAP-MS/MS system and qualitative and quantitative analyses of metabolites. To guarantee the repeatability and reliability of the data, a quality control analysis was carried out. For this purpose, one sample was prepared by mixing the sample extracts and inserting other samples to confirm the repeatability of the analytical process. The repeatability of metabolite extraction and detection was evaluated by analyzing the overlap of total ion flow maps of different quality control samples.
Transcriptome analysis
Total RNA was isolated from fresh grains using an RNAprep Pure Plant Kit (Tiangen Company, Beijing, China). The quantification and quality analysis of total RNA was described by Cao et al. [Citation33]. The total RNA from six samples was measured. cDNA preparation and cDNA library construction were carried out according to the manufacturer’s protocol (Illumina, Inc., San Diego, CA, USA). Six cDNA library products were sequenced using Illumina paired-end sequencing technology by Beijing Novogene Bioinformatics Technology Co., Ltd. (Tianjin, China). The raw sequence reads were stored in the National Center for Biotechnology Information (NCBI) SRA database, with the accession number SUB7281883. The transcriptome data analysis followed the method described by Cao et al. [Citation34].
Bioinformatics analysis
Genes related to flavonoid and betalain biosynthesis in the Kyoto Encyclopedia of Genes and Genomes (KEGG) pathways were identified, followed by alignment to the unigene database using the BLASTX algorithm. A phylogenetic tree was constructed with MEGA5 software using the neighbor-joining method [Citation35]. Principle component analysis (PCA) and orthogonal partial least square-discriminant analysis (OPLS-DA) were carried out using R 3.5.0 (http://www.r-project.org/) to maximize the metabolome differences between black and white quinoas. Significantly regulated metabolites in black and white quinoas were obtained using variable importance in projection (VIP) values ≥ 1 and absolute Log2FC (fold-change) ≥ 1. VIP values were extracted from the OPLS-DA results, which also contained score plots and permutation plots, generated using the R package MetaboAnalystR 1.0.1. The data were log transformed (log2) and mean centered before OPLS-DA. In order to avoid overfitting, a permutation test (200 permutations) was performed. The annotation of identified metabolites and mapping methods were carried out according to the procedures described by Wang et al. [Citation30] and Chen et al. [Citation27].
Results and discussion
Chemical compound differences in black and white quinoa grains
The metabolites in grains from white and black quinoa were investigated using UPLC-ESI-MS/MS. We identified 446 metabolites from 11 classes. General metabolic differences between black and white quinoa grains were revealed using PCA. Two principal components (PC1 and PC2) were extracted and found to represent 55.96% and 16.6%, respectively. In addition, the cumulative contribution rate reached 72.56%. In the PCA score plot, black and white quinoas were clearly separated, and samples were collected in a compact and repeated way (Supplemental Figure S1A). The Q2 values obtained by comparing black with white quinoa were greater than 0.9 (Supplemental Figure S1B). These results indicated that the experiment and models were reproducible, reliable and stable. Filtering of differential metabolites was conducted, and the differentially expressed metabolites are listed in Supplemental Table S1. To evaluate the nutritional value of black grain quinoa, previous researchers demonstrated that dark quinoa seeds contain anthocyanins, polyphenols and betalains, which are likely to endow dark quinoa with greater levels of antioxidant activity [Citation6,Citation36]. Due to limitations in their methods, these researchers compared only a certain number of chemicals. In this research, a multiple ion monitoring-enhanced product ions (stepwise MIM-EPI) method was used to compare the metabolome differences in white and black grain quinoas. Compared with previous methods, stepwise MIM-EPI enables the simultaneous analysis of more than 1000 chemical compounds. In this case, 446 compounds were identified, which offered the opportunity to compare all of the chemical differences in white and black grain quinoas. Apart from differences in anthocyanins and total polyphenols, black grain quinoa was shown to accumulate tannins, phenolic acids, terpenoids, lignans and coumarins, amino acids and derivatives, organic acids, alkaloids, nucleotides and derivatives and other compounds. This information provides more evidence about metabolome differences in black and white quinoa grains.
The metabolite expression levels showed significant differences (Supplemental Figure S2). A total of 157 metabolites expressed at significantly different levels in black and white quinoa grains were detected. Overall, 103 of these were up-regulated and 54 were down-regulated in black grain compared with white grain. Of these, 82 compounds belonged to the phenylpropane biosynthesis pathway, which implied that the chemicals derived from phenylpropane should account for most of the differentially expressed compounds in white and black grain quinoas. Over 50% higher levels of tannins and flavonoids accumulated in the black grains (). Further classification analysis found that the tannins contained only one class, proanthocyanins, while the flavonoids were composed of nine classes of chemicals: anthocyanins, chalcones, dihydroflavonols, flavonols, flavonoids, flavanols, dihydroflavones, flavonoids, carbonosides and isoflavones. Both the tannins and flavonoids were derived from phenylalanine (Supplemental Table S2). Within the 10 classes of chemicals, three showed 100% up-accumulation in black grain quinoa. These classes contained 5 anthocyanins, 2 chalcones and 13 proanthocyanins, respectively (Supplemental Table S2). The ion peak areas for each class of chemicals were summed in the black and white grain quinoas, respectively. The total proanthocyanin content of the black grain quinoa was 4.30 E +07 of that found in the white grain quinoa, while the fold changes of other flavonoids were in the range 0.63–4.91 (Supplemental Table S2). All 13 tannins were proanthocyanins, and these could not be detected in the white grains. It should, therefore, be inferred that the proanthocyanins likely cause the black grain trait in quinoa. Furthermore, proanthocyanins have been suggested to invoke antioxidant activity [Citation37] and previous research has suggested that the antioxidant activity of black grains is higher than that of white grains [Citation36]. The amount of flavonoids and the proanthocyanins present suggests that proanthocyanins play an important role in the high antioxidant activity of black grain quinoa.
Table 1. Summary of the chemical compounds in black and white grains.
KEGG classification and enrichment analysis confirmed that the phenylpropane metabolic pathway was activated. The differentially accumulated metabolites were mainly associated with metabolic pathways (31, 44.93%), biosynthesis of secondary metabolites (21, 30.43%) and flavonoid biosynthesis (15, 21.74%) (Supplemental Figure S3). In particular, two metabolic pathways (flavonoid biosynthesis and flavone and flavonol biosynthesis) were significantly enriched (p < 0.05) (Supplemental Figure S4). These pathways belong to the phenylpropane metabolic pathway. However, although quinoa belongs to the order Caryophyllales, and betalains may be produced in this order, no betalains were detected in either white or black grain quinoas. Anthocyanins were detected in both white and black grain quinoa; a total of five anthocyanins were identified and four anthocyanins showed higher levels of accumulation in black grains, while only one accumulated more in white grains (Supplemental Tables S1 and S2). Two anthocyanins, peonidin 3-O-glucoside chloride and malvidin 3-O-galactoside, were found only in back grains (Supplemental Table S1).
Differentially expressed genes in black and white grain
To understand the genetic basis for the metabolite differences seen in black and white quinoas, a transcriptome analysis was carried out. After filtering, 61–73 million clean reads were acquired, and 64,699 unigenes (77,000,460 bp) were obtained (Supplemental Table S3). In total, 30,749 (47.59%), 21,883 (33.82%), 9178 (14.18%), 21,256 (32.85%), 22,243 (34.37%) and 6209 (9.59%) unigenes were annotated to the Nr, Nt, KEGG, Swiss-Prot, GO and KOG databases, respectively (Supplemental Table S4). Black and white quinoas expressed 4620 unigenes differentially, comprising 2149 up-regulated and 2471 down-regulated unigenes (Supplemental Figure S5). KEGG enrichment analysis for differentially expressed genes between black and white grains was done (). Considering the gene number, rich factor and qvalue, the phenylalanine metabolism and flavonoid biosynthesis pathways were markedly found to be differentially expressed, as in the metabolite analysis. As such, 19 structural genes involved in the phenylpropane metabolic pathway were selected to search for homologous unigenes in quinoa. We identified 23 unigenes that were homologous to 14 structural genes in the phenylpropane metabolic pathway, while no unigenes were found to be homologous to C4H, CCoAOMT, CCR, CAD and F3′5′H (; Supplemental Table S5). All of the 14 structural genes exhibited higher expression levels in black than white quinoa; the relative transcript levels were between 2.11 and 15912.07 times higher in black than white quinoa grains (; Supplemental Table S5). The top four up-regulated genes were DFR, LAR, LDOX and ANR; the fold changes in these genes reached 15912.07, 3265.49, 486.70 and 216.42 times, respectively. The fold changes seen in other genes were below 11.07, which were far lower than those seen for the top four genes. DFR, LAR, LDOX and ANR are necessary for proanthocyanin biosynthesis, and, as a consequence, proanthocyanins were expected to accumulate at higher levels in black grain quinoa. The fold changes in metabolites are listed in the sketch map, and the fold changes of epicatechin and proanthocyanidin were 335433.33 and 367171.70 times, respectively, which were far higher than those seen for other compounds. Interestingly, the amount of the substrate phenylalanine in black grain quinoa was 647.80 times than that in white grain quinoa. However, the expression levels of the key branch genes for other flavonoids in black grain were only several times those found in white grain. The proanthocyanin biosynthesis pathway may, therefore, be the most highly activated biosynthetic pathway. As subsidiaries, the intermediate products from proanthocyanin biosynthesis induced the accumulation of anthocyanins, chalcones, dihydroflavonols, flavonols, flavonoids, flavanols, dihydroflavones, flavonoid carbonosides and isoflavones.
Figure 1. KEGG enrichment analysis for differentially expressed genes between black and white quinoa grains.
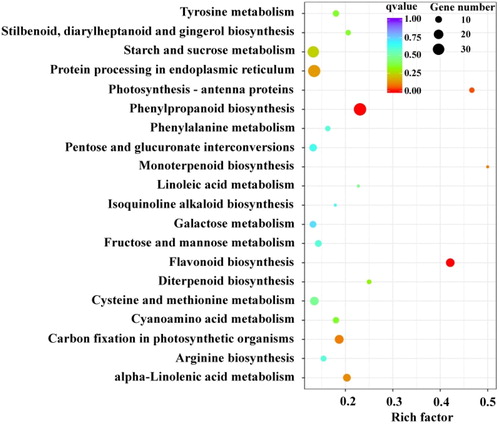
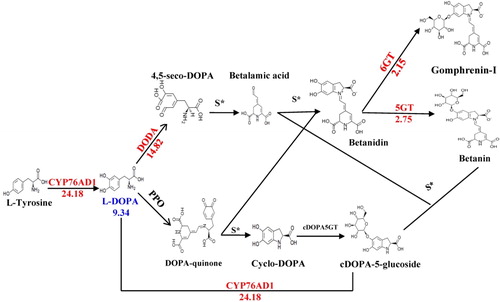
Figure 2. Expression differences between structural genes involved in flavonoids biosynthesis. The arrows show the enzyme-encoding genes and the metabolic stream. The red font indicates the differentially expressed genes encoding enzymes, and the blue font indicates the differential metabolites. The number represents the expression in the black grain relative to that in the white grain [=expression (black)/expression (white)]. The numbers under the chemical compounds represent the relative contents of the compounds accumulated in the black grain versus the white grain. These structural flavonoid biosynthesis genes and chemical compounds were more significantly upregulated in black grain than in white grain.
![Figure 2. Expression differences between structural genes involved in flavonoids biosynthesis. The arrows show the enzyme-encoding genes and the metabolic stream. The red font indicates the differentially expressed genes encoding enzymes, and the blue font indicates the differential metabolites. The number represents the expression in the black grain relative to that in the white grain [=expression (black)/expression (white)]. The numbers under the chemical compounds represent the relative contents of the compounds accumulated in the black grain versus the white grain. These structural flavonoid biosynthesis genes and chemical compounds were more significantly upregulated in black grain than in white grain.](/cms/asset/df6fb710-0247-4301-8f5b-8b914acb9518/tbeq_a_1822207_f0002_c.jpg)
Almost all of the structural genes displayed higher levels of expression in black grain quinoa, which implied that transcription factors were involved in this process. AtMYB75 and AtMYC1 transcription factors can induce the phenylpropane metabolic pathway in plants [Citation38, Citation39]. Therefore, AtMYB75 and AtMYC1 were adopted to identify homologous genes regulating flavonoid production in black quinoa. Two MYB transcription factor unigenes (Cluster-5801.31288, Cluster-5801.4592) and one MYC transcription factor (Cluster-5059.0) unigene were obtained. A phylogenetic tree was reconstructed for two MYB proteins and one MYC protein with MYB and MYC from Arabidopsis and other species (Supplemental Figures S6 and S7). Cluster-5801.31288 and Cluster-5801.4592 were assigned to the branch regulating the phenylpropane metabolic pathway in Arabidopsis (Supplemental Figure S6), whereas Cluster-5059.0 belonged to the same branch as the MYC proteins associated with the phenylpropane metabolic pathway of other species (Supplemental Figure S7). The expression levels of Cluster-5801.31288, Cluster-5801.4592 and Cluster-5059.0 were higher in black grains than in white grains of quinoa (Supplemental Table S5). The fold changes for Cluster-5801.31288, Cluster-5801.4592 and Cluster-5059.0 were 23.41, 2.33 and 4.38 times, respectively. The transcription factor related to proanthocyanin biosynthesis also exhibited higher levels of expression in the black grain quinoa. This suggested that the key genes are likely to encode transcription factors. Further experiments are required to study their functions in the phenylpropane metabolic pathway.
Although few betalains were detected in the metabolite analysis, unigenes associated with betalain biosynthesis were selected to understand the genetic mechanism underlying the lack of betalains. The major structural genes involved in betalain biosynthesis include CYP76AD1, DODA, CDOPA5GT, 5GT and 6GT. All of these genes had homologous unigenes (Supplemental Table S6), which indicates that C. quinoa possesses an intact betalain biosynthesis pathway, as described by Polturak et al. [Citation10] (). Six of the structural genes showed higher expression in black grains than in white ones, whereas only CDOPA5GT showed no differential expression in black and white grains (). Although nearly all of the structural genes were more highly expressed in black grain quinoa, no betalains were detected in this experiment. Only the intermediate product l-DOPA could be detected, and the fold change in this was 9.34 times. No unigenes were homologous to BvMYB1, a MYB transcription factor that regulates the betalain pathway in beets [Citation12], which may be the reason for the low betalain content. Within the Caryophyllales, betalains occur in a mutually exclusive fashion with anthocyanins, as no plants have been found to produce both types of pigments naturally [Citation10]. Usually, the loss of CHS and ANS cause the interruption of anthocyanin biosynthesis. In this case, five anthocyanins were detected in black grains. The whole anthocyanin biosynthesis pathway was intact, including the CHS and ANS coding genes. They showed higher levels of expression in black than in white grains, which may explain the accumulation of anthocyanins. This may have been caused by the low level of expression of the structural genes. This result supports the suggestion that betalains occur only in the absence of anthocyanins.
Figure 3. Expression differences of unigenes involved in betalain biosynthesis. The arrows show the enzyme-encoding genes and the metabolic stream. The red font indicates the differentially expressed genes encoding enzymes, and the blue font indicates the differential metabolites. The numbers represent the expression in the black grain relative to that in the white grain (log2FC). The numbers under the chemical compounds represent the relative contents of the compounds accumulated in the black grain versus the white grain.
Conjoint analysis of the transcriptome and metabolome
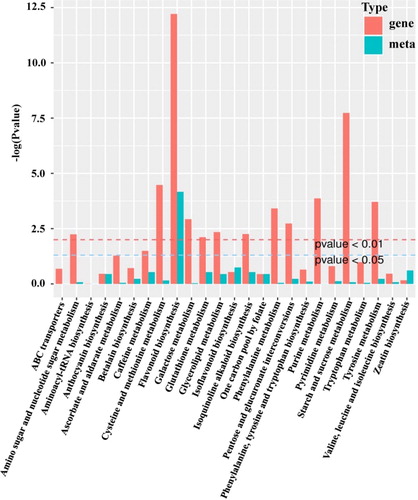
To comprehensively analyze the molecular mechanism of grain color differences, normalization and statistical analysis were performed on the transcriptome and metabolome data. First, differentially expressed unigenes and metabolites were matched to KEGG pathways. A total of 25 pathways comprised both differentially expressed unigenes and metabolites (, Supplemental Table S7). Flavonoid biosynthesis was seen to have undergone significant enrichment on the basis of p values from the transcriptome and metabolome data (). The p values for both genes and metabolites were <0.01. A network diagram was constructed to reveal the correlation between the differentially expressed unigenes and metabolites (Supplemental Figure S8). Ten unigenes and five flavonoid metabolites were subjected to Pearson correlation analysis, and the correlation coefficient values (R2) were over 0.8. This suggested that these unigenes homologous to structural genes involved in flavonoid biosynthesis had strong correlations with flavonoid metabolites. The flavonoid biosynthesis pathway was suggested, therefore, to be the most differentially expressed pathway.
Figure 4. Kyoto Encyclopedia of Genes and Genomes (KEGG) enrichment histogram of conjoint analysis of differentially expressed genes and accumulated metabolites. The X-axis represents the metabolic pathways; the Y-axis represents the expression as –log (p value). The red columns represent the enrichment p values of differentially expressed genes, and the green columns represent the enrichment p values of different metabolites.
As in the metabolome analysis, the transcriptome analysis revealed activation of the phenylpropane metabolic pathway. This pathway contains the power to biosynthesize all prothocyanins, anthocyanins, chalcones, dihydroflavonols, flavonols, flavonoids, flavanols, dihydroflavones, flavonoid carbonosides and isoflavones. Proanthocyanidin could cause the black grain trait in Arabidopsis thaliana and Brassica species [Citation40,Citation41], and all proanthocyanins were only detected in the black grains quinoa. LAR and ANR were shown to be the key branch genes associated with proanthocyanin production, and had high expression levels in black grains. Two transcription factors, MYB and MYC, related to proanthocyanin biosynthesis also showed higher levels of expression, and are likely to be the key genes in the black grain quinoa. All results suggested that the proanthocyanins also cause the black grain trait in quinoa. Proanthocyanins play an important role in the high antioxidant potential [Citation37], which suggested black grain quinoa invokes antioxidant activity.
Conclusions
Metabolome analysis demonstrated that the flavonoids and proanthocyanins are the most differently accumulated chemicals in black and white grain quinoa. The color and content of flavonoids suggest that the accumulation of proanthocyanins produces the black grain trait in quinoa. In the transcriptome analysis, the phenylpropanoid metabolic pathway was the most differentially expressed pathway, which may cause the different levels of flavonoid and proanthocyanin accumulation in black and white quinoas. The MYB and MYC transcription factors that regulate the phenylpropanoid metabolic pathway showed higher transcript levels in black than in white grains. The genes encoding these transcription factors are, therefore, likely to be the key genes for determining black-colored grains. They activate the proanthocyanin biosynthesis pathway leading to proanthocyanin accumulation and black grains.
Supplemental Material
Download MS Word (967.2 KB)Disclosure statement
The authors have declared that no competing interests exist.
Additional information
Funding
References
- Capparelli A, Pochettino ML, Lema V, et al. The contribution of ethnobotany and experimental archaeology to interpretation of ancient food processing: methodological proposals based on the discussion of several case studies on Prosopis spp. Chenopodium spp. and Cucurbita spp. from Argentina. Veget Hist Archaeobot. 2015;24(1):151–163.
- Fuentes FF, Paredes-Gonzalez X. Nutraceutical perspectives of quinoa: biological properties and functional applications. In: Didier Bazile, Daniel Bertero, Carlos Nieto, editors. The state of the art report on quinoa around the world in 2013. Rome, Italy: Regional Office for Latin America and Caribbean at Food and Agriculture Organization (FAO); 2015. p. 286–299.
- Vega-Galvez A, Martin RS, Sanders M, et al. Characteristics and mathematical modeling of convective drying of quinoa (Chenopodium quinoa Willd.): influence of temperature on the kinetic parameters. J Food Process Preserv. 2010;34:945–963.
- Hirose Y, Fujita T, Ishii T, et al. Antioxidative properties and flavonoid composition of Chenopodium quinoa seeds cultivated in Japan. Food Chem. 2010;119(4):1300–1306.
- Repo-Carrasco-Valencia R, Hellstroem JK, Pihlava JM, et al. Flavonoids and other phenolic compounds in Andean indigenous grains: quinoa (Chenopodium quinoa), kafiiwa (Chenopodium pallidicaule) and kiwicha (Amaranthus caudatus). Food Chem. 2010;120(1):128–133.
- Tang Y, Li XH, Zhang B, et al. Characterisation of phenolics, betanins and antioxidant activities in seeds of three Chenopodium quinoa Willd. genotypes. Food Chem. 2015;166:380–388.
- Gómez-Pando LR, Álvarez-Castro R, Eguiluz-de la Barra A. Short communication: effect of salt stress on peruvian germplasm of Chenopodium quinoa Willd.: a promising crop. J Agron Crop Sci. 2010;196(5):391–396.
- Abderrahim F, Huanatico E, Segura R, et al. Physical features, phenolic compounds, betalains and total antioxidant capacity of coloured quinoa seeds (Chenopodium quinoa Willd.) from Peruvian Altiplano. Food Chem. 2015;183:83–90.
- Escribano J, Cabanes J, Jiménez-Atiénzar M, et al. Characterization of betalains, saponins and antioxidant power in differently colored quinoa (Chenopodium quinoa) varieties. Food Chem. 2017;234:285–294.
- Polturak G, Heinig U, Grossman N, et al. Transcriptome and metabolic profiling provides insights into betalain biosynthesis and evolution in Mirabilis jalapa. Mol Plant. 2018;11:189–204.
- Gandia-Herrero F, Garcia-Carmona F. Characterization of recombinant Beta vulgaris 4,5-DOPA- extradiol-dioxygenase active in the biosynthesis of betalains. Planta. 2012;236:91–100.
- Hatlestad GJ, Akhavan NA, Sunnadeniya RM, et al. The beet Y locus encodes an anthocyanin MYB-like protein that activates the betalain red pigment pathway. Nat Genet. 2015;47(1):92–96.
- Hatlestad GJ, Sunnadeniya RM, Akhavan NA, et al. The beet R locus encodes a new cytochrome P450 required for red betalain production. Nat Genet. 2012;44(7):816–820.
- Polturak G, Breitel D, Grossman N, et al. Elucidation of the first committed step in betalain biosynthesis enables the heterologous engineering of betalain pigments in plants. New Phytol. 2016;210(1):269–283.
- Sasaki N, Wada K, Koda T, et al. Isolation and characterization of cDNAs encoding an enzyme with glucosyltransferase activity for cyclo-DOPA from four o'clocks and feather cockscombs. Plant Cell Physiol. 2005;46(4):666–670.
- Sullivan ML. Beyond brown: polyphenol oxidases as enzymes of plant specialized metabolism. Front Plant Sci. 2014;5:783.
- Sunnadeniya R, Bean A, Brown M, et al. Tyrosine hydroxylation in betalain pigment biosynthesis is performed by cytochrome P450 enzymes in beets (Beta vulgaris). PLoS One. 2016;11(2):e0149417.
- Vogt T, Ibdah M, Schmidt J, et al. Light-induced betacyanin and flavonol accumulation in bladder cells of Mesembryanthemum crystallinum. Phytochemistry. 1999;52(4):583–592.
- Vogt T, Zimmermann E, Grimm R, et al. Are the characteristics of betanidin glucosyltransferases from cell-suspension cultures of Dorotheanthus bellidiformis indicative of their phylogenetic relationship with flavonoid glucosyltransferases. Planta. 1997;203(3):349–361.
- Bartłomiej S, Justyna RK, Ewa N. Bioactive compounds in cerealgrains-Occurrence, structure, technological significance and nutritional benefits – a review. Food Sci Technol Int. 2012;18(6):559–568.
- Petroni K, Tonelli C. Recent advances on the regulation of anthocyanin synthesis in reproductive organs. Plant Sci. 2011;181(3):219–229.
- Sarma AD, Sharma R. Anthocyanin-DNA copigmentation complex: mutual protection against oxidative damage. Phytochemistry. 1999;52(7):1313–1318.
- Winkel-Shirley B. Flavonoid biosynthesis. A colorful model for genetics, biochemistry, cell biology, and biotechnology. Plant Physiol. 2001;126(2):485–493.
- Koes R, Verweij W, Quattrocchio F. Flavonoids: a colorful model for the regulation and evolution of biochemical pathways. Trends Plant Sci. 2005;10(5):236–242.
- Alseekh S, Tohge T, Wendenberg R, et al. Identification and mode of inheritance of quantitative trait loci for secondary metabolite abundance in tomato. Plant Cell. 2015;27(3):485–512.
- Chen W, Gao Y, Xie W, et al. Genome-wide association analyses provide genetic and biochemical insights into natural variation in rice metabolism. Nat Genet. 2014;46(7):714–721.
- Chen W, Gong L, Guo ZL, et al. A novel integrated method for large-scale detection identification and quantification of widely targeted metabolites: application in the study of rice metabolomics. Mol Plant. 2013;6(6):1769–1780.
- Dong X, Chen W, Wang W, et al. Comprehensive profiling and natural variation of flavonoids in rice. J Integr Plant Biol. 2014;56(9):876–886.
- Shi Z, Wei F, Wan R, et al. Impact of nitrogen fertilizer levels on metabolite profiling of the Lyciumbarbarum L. Fruit. Molecules. 2019;24(21):3879.
- Wang F, Chen L, Chen HP, et al. Analysis of flavonoid metabolites in citrus peels (Citrus reticulata “Dahongpao”) using UPLC-ESI-MS/MS. Molecules. 2019;24(15):2680.
- Kumar R, Ichihashi Y, Kimura S, et al. A high-throughput method for Illumina RNA-seq library preparation. Front Plant Sci. 2012;3:202.
- Li YZ, Luo X, Wu CY, et al. Comparative transcriptome analysis of genes involved in anthocyanin biosynthesis in red and green walnut (Juglansregia L.). Molecules. 2017;23(1):25.
- Cao D, Ye GJ, Zong Y, et al. AetMYC1, the candidate gene controlling the red coleoptile trait in Aegilops tauschii Coss. accession As77. Molecules. 2017;22(12):2259.
- Cao D, Fan JQ, Xi XY, et al. Transcriptome analysis identifies key genes responsible for red coleoptiles in Triticum monococcum. Molecules. 2019;24(5):932.
- Tamura K, Peterson D, Peterson N, et al. MEGA5: molecular evolutionary genetics analysis using maximum likelihood, evolutionary distance, and maximum parsimony methods. Mol Biol Evolut. 2011;28(10):2731–2739.
- Paśko P, Bartoń H, Zagrodzki P, et al. Anthocyanins, total polyphenols and antioxidant activity in amaranth and quinoa seeds and sprouts during their growth. Food Chem. 2009;115(3):994–998.
- Gunaratne A, Wu K, Li DQ, et al. Antioxidant activity and nutritional quality of traditional red-grained rice varieties containing proanthocyanidins. Food Chem. 2013;138(2-3):1153–1161.
- Zuluaga D, Gonzali S, Loreti E, et al. Arabidopsis thaliana MYB75/PAP1 transcription factor induces anthocyanin production in transgenic tomato plants. Funct Plant Biol. 2008;35(7):606–618.
- Urao T, Yamaguchi-Shinozaki K, Mitsukawa N, et al. Molecular cloning and characterization of a gene that encodes a MYC-related protein in Arabidopsis. Plant Mol Biol. 1996;32(3):571–576.
- Baudry A, Heim MA, Dubreucq B, et al. TT2, TT8, and TTG1 synergistically specify the expression of BANYULS and proanthocyanidin biosynthesis in Arabidopsis thaliana. Plant J. 2004;39(3):366–380.
- Liu XJ, Lu Y, Yan ML, et al. Genome-wide identification, localization, and expression analysis of proanthocyanidin-associated genes in Brassica. Front Plant Sci. 2016;7:1831.