
Abstract
Grain yield improvement in wheat (Triticum aestivum L) requires understanding of the genetic control of grain yield components and other related traits. In this study, a total of 82 and 314 quantitative trait loci (QTLs) were associated with grain yield and grain yield components after harvest and photosynthetic traits at the seedling, heading and grain filling stages from a recombinant inbred line population by normal and multivariate QTLs analysis, respectively. Sixty-one QTL clusters explained from 4.42% to 27.72% of phenotypic variances for 2–76 traits. A comparison between the normal and conditional QTL mapping found that grain yield showed significant genetic correlation with grain yield components and photosynthetic traits on five QTLs. In the genetic region between Xbarc99 and Xbarc169 on chromosome 1D, grain yield was entirely contributed by thousand kernel weight and harvest index. At the same region, harvest index was contributed by transpiration rate at seedling stage, intercellular CO2 concentration, stomatal conductance, net photosynthetic rate and transpiration rate at heading stage; and intercellular CO2 concentration, net photosynthetic rate and transpiration rate at grain filling stage, whereas thousand kernel weight was suppressed by a normal QTL for chlorophyll content at grain filling stage in this region. The direct comparison analyses between grain yield with photosynthetic traits showed similar genetic relationships in this region. Manipulation of genes found within these QTL clusters might improve important agronomic traits and grain yield.
Introduction
Wheat (Triticum aestivum L. 2n = 42, AABBDD) is a vitally important food crop, the consumption of which has increased more than six-fold from 1962 to 2012 in China [Citation1]. It is predicted that meeting the nutritional requirements of a rapidly rising global population will require a 70% increase in wheat production by 2050, in comparison to the level in 2012 [Citation2]. While conventional wheat breeding programs have achieved steady gains with 0.9% rising rate per year over the last decade, the value is far below the 2050 targets [Citation3]. Developing more effective wheat breeding strategies for improving grain yield is a major focus of most wheat breeding programs globally.
Grain yield itself is determined by its relative components, such as thousand kernel weight, harvest index, tiller number per plant and kernel number per spike. Classical breeding programs have proved that these traits are controlled by many minor genes, and these genes are easily affected by environmental conditions [Citation4]. These minor effect quantitative trait loci (QTLs) directly related to grain yield and its related traits have been reported on all 21 chromosomes in common wheat. Some genes or QTLs for grain yield with relatively high phenotypic variance are also reported. For instance, Ppd-D1, Rht-D1, TaCKX6-D1, TaTEF-7A, TaGW2, TaTGW6, TaGS5-3A, TaSus1, TaSus2 and TaCWI [Citation5–12]. However, few previous studies have considered the genetic relationships between these traits and grain yield in a QTL.
Photosynthetic capacity is the foundation for grain yield in crops. Previous analysis for photosynthesis-related traits including chlorophyll content, net photosynthetic rate and stomatal conductance have been performed [Citation13–15]. Photosynthesis, trophophase reserves and spike photosynthesis of flag leaf (blade and sheath) are main contributors to kernel development in C3 cereals [Citation16–18]. However, the relative contributions of these three sources to grain yield remains unknown.
Wen and Zhu [Citation19] developed a multivariable conditional analysis to quantify the influence from the component traits to its target trait. Several studies applied this method to identify QTLs for some complex traits such as final plant height, growth duration, grain protein content, grain yield, grain weight per spike and photosynthetic capacity, and clarified the genetic influence of their components on these traits [Citation15, Citation20–25].
The present study was designed to (1) detect QTLs for photosynthesis-related traits, grain yield and its components in a recombinant inbred line (RIL) population based on comparison of normal and conditional mapping methods, respectively, and (2) to clarify their genetic relationships based on QTL analysis.
Materials and methods
Plant materials and experimental design
The International Triticeae Mapping Initiative (ITMI) population was applied for QTL analysis in the present study [Citation26]. This population consisted of 112 RILs. The female parent ‘W7984’ is a synthetic hexaploid wheat, and the male parent ‘Opata85’ is a commercial cultivar.
All materials were evaluated in two field trials during 2008–2009 (E1) and 2009–2010 (E2) in Ya’an of Sichuan Province (29°54′N and 103°01′W), and the experimental design was described previously [Citation25].
Phenotypic evaluation
The number of fertile spikelets per spike and kernel number per spike were determined by 10 main spikes per line. Thousand kernel weight was measured in grams by weighing two samples of 1000 kernels from each line. The number of fertile tillers per plant, aboveground dry matter per plant, harvest index and grain yield were evaluated by measuring 10 randomly selected plants. The photosynthetic trait of chlorophyll content was investigated by a leaf chlorophyll metre of SPAD-502 Plus (Minolta, Osaka, Japan). The net photosynthetic rate (µmol s−1 m−2), stomatal conductance (mmol s−1 m−2), intercellular CO2 concentration (mol L−1) and transpiration rate (mmol s−1 m−2) were estimated using LI-6400XT (LI-COR Biosciences, Lincoln, NE, USA). The measurement procedures were described in the manuscript of Xu et al. [Citation15]. All photosynthetic traits were measured at seedling stage, heading stage and grain filling stage, respectively. The phenotypic values in E3 were the combined data for the 2 years.
Statistical analysis
Analyses of variance and covariance components (ANCOVA) were based on the minimum norm quadratic unbiased estimation proposed by Zhu [Citation27]. The phenotypic and genetic correlations among all traits were investigated by SAS software [Citation28, Citation29].
The conditional analysis was performed using QGAStation 1.0 software [Citation30]. The ‘QTLData’ menu settings followed the description reported by Cui et al. [Citation21]. The conditional phenotypic values y(A|B) means a new value of trait A that have removed the influences of trait B.
Genetic mapping and QTL analysis
The genetic linkage map of the ITMI population used in our study was reported by Song et al. [Citation31], which contained 1410 loci and covered 2541 cM of genetic distance. Inclusive composite interval mapping was performed using IciMapping V4.1 [Citation32]. The settings of walking speed and the logarithm of the odds (LOD) threshold were described previously [Citation25]. Both the normal phenotypic values and the new conditional phenotypic values were utilized in the QTL mapping analyses. QTL mapping analyses were initially done on data for each year separately and subsequently performed on combined data for the 2 years.
Results and discussion
Phenotypic traits
For the parents of the ITMI population, synthetic wheat ‘W7984’ significantly differs from the common wheat ‘Opata85’ in 9 of the 22 studied traits. In the population, all traits exhibited broad and continuous variation among the lines (). Grain yield was positively correlated with harvest index (rg = 0.74; rp = 0.68), thousand kernel weight (rg = 0.63; rp = 0.52), aboveground dry matter per plant (rg = 0.56; rp = 0.62), kernel number per spike (rg = 0.33; rp = 0.38), tiller number per plant (rg = 0.32; rp = 0.31), Ci at grain filling stage (rg = 0.21; rp = 0.24), stomatal conductance at the grain filling stage (rg = 0.21; rp = 0.25), net photosynthetic rate at the grain filling stage (rg = 0.22; rp = 0.25) and net photosynthetic rate at the heading stage (rg = 0.26; rp = 0.35) (, ). Conversely, the transpiration rate at the seedling stage and heading stage, and Ci at the seedling stage were all negatively correlated with grain yield in terms of both genetic and phenotypic correlation. Ci at the heading stage, chlorophyll content at the grain filling stage and heading stage showed an insignificant phenotypic, but a significant genetic association with grain yield, whereas the fertile spikelets per spike showed a significant phenotypic, but an insignificant genetic association with grain yield.
Figure 1. Genetic correlations among the investigated traits and plant height and heading date. Traits are chlorophyll content at seedling stage (CNS), heading stage (CNH) and grain filling stage (CNG); net photosynthetic rate at seedling stage (PNS), heading stage (PNH) and grain filling stage (PNG); stomatal conductance at seedling stage (GSS), heading stage (GSH) and grain filling stage (GSG); intercellular CO2 concentration at seedling stage (CIS), heading stage (CIH) and grain filling stage (CIG); transpiration rate at seedling stage (TRS), heading stage (TRH) and grain filling stage (TRG); tiller number (TN), spikelet number per spike (SPS), kernel number per spike (KPS), aboveground dry matter per plant (DM), grain yield per plant (GY), thousand kernel weight (TKW), harvest index (HI) and plant height (PH).
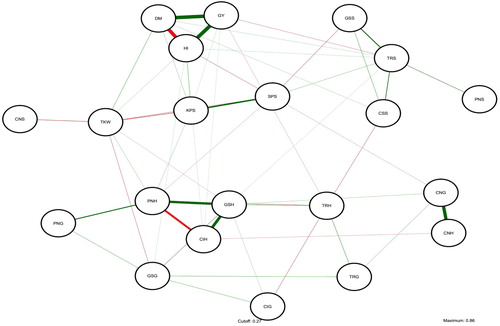
Table 1. Summary of mean and ranges of photosynthetic- and agronomic-related traits among parents and RILs from over 2 years.
Table 2. Simple correlation coefficient and genetic correlation coefficient between the photosynthetic- and agronomic-related traits.
QTL mapping
A total of 396 QTLs were identified overall traits. They were distributed across all the 21 chromosomes and explained 4.42%–27.72% of the phenotypic variation. One hundred and thirty-one QTLs were found in at least two environments, among which 29 were identified in both environments of E1, E2 and combined over the 2 years of E3. Sixty-one QTL clusters for 2–76 traits were detected. The QTL cluster in Xbcd1970–Xbcd262 on 2D carried QTLs for 8 normal traits and 68 conditional traits (, ).
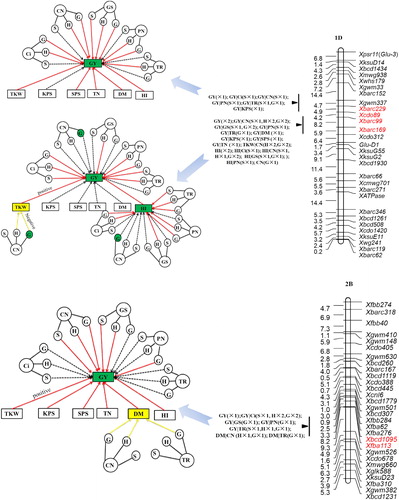
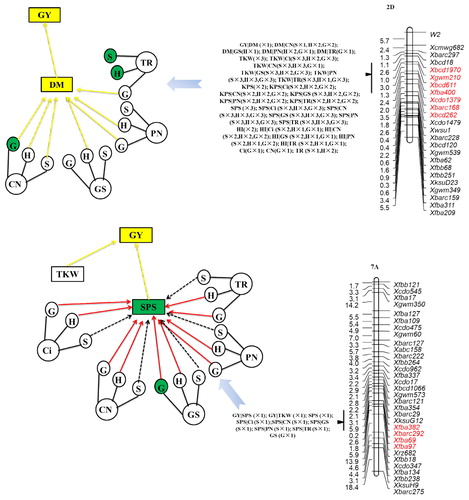
Figure 2. QTL clusters carrying normal QTL or conditional QTL for GY. Letters in parentheses stand for seedling stage (S), heading stage (H) and grain filling stage (G). Figures after × are number of environments that the QTL have been identified. The networks are a comparison of conditional QTL and normal QTL analysis. Yellow arrows indicate suppression between GYC (photosynthetic traits) with GY, or photosynthetic traits with GYC, whereas the red arrow indicated positive contribution between two traits. Dotted arrows indicate independent relationship between two traits. Traits with green background indicate that normal QTLs were identified, whereas traits with yellow background indicate that only conditional QTLs were identified.
QTL mapping for yield-related traits
For grain yield, three QTLs were located on chromosomes 1D and 2B, each explained between 4.42% and 10.86% of the phenotypic variance, respectively. The breeder-preferred allele of one QTL (Xbcd1095–Xfbb113) on 2B from the parent ‘W7984’ increased the grain yield by 4.41%, and the other two decreased the grain yield by 5.58% and 10.86%, respectively. Zhang et al. [Citation4] identified a meta-QTL (MQTL13) for yield on 2B, which was linked to Xcfd267. Xcfd267 was located in the genetic region of Xbcd1095–Xfbb113 [Citation33], indicating that this allele existed in many wheat resources around the world. The QTLs on chromosome 1D (Xbarc229–Xcdo89) and 2B were only detected in one environment, whereas the QTL on 1D (Xbarc99–Xbarc169) was expressed in the environment of E1, and combined environment of E3. Xu et al. [Citation15] reported that QGy-1D.2.8W was associated with grain yield. In our study, the QTL for grain yield on chromosome 1D, between Xbarc99 and Xbarc169 is located in a similar region as QGy-1D.2.8W in ITMI population.
For five investigated yield component traits, 2–8 QTLs were identified. The A genome carried the most QTLs. A total of 13 QTLs were identified on all seven chromosomes of this genome, next followed the D genome, which carried 10 QTLs on chromosomes 1D, 2D, 4D and 7D. The B genome carried the least QTLs. Only six QTLs were identified on chromosomes 1B, 2B, 4B, 5B and 7B of this genome. The QTL for fertile spikelets per spike in the genetic region of XBcd1970–XBcd262 on 2D explained the highest phenotypic variation, which was up to 24.27% with average across all environments. Previous studies reported that the photoperiod gene of Ppd-D1 was also located in this region [Citation25, Citation34]. The same region also carried stable QTLs for thousand kernel weight, kernel number per spike and harvest index. Of these QTLs, the synthetic parent ‘W7984’ carried 12 breeder’s preferred alleles, whereas the common wheat ‘Opata85’ carried 17.
Two QTLs for thousand kernel weight on 4D and 7B might be located in a similar region as QTKW-DH-4D-2.1 and QTKW-DH-7B, respectively [Citation35]. For kernel number per spike, the map locations of QTLs on 4A and 4B were similar to QKNPS-DH-4 and QKns.tam-4B, which was reported previously, and similar QTLs located on 5A have been reported in our previous study [Citation25, Citation35, Citation36]. Cui et al. identified the QTL of QKwps-WJ-2B.1a associated with phenotypic variance of fertile spikelets per spike on 2B [Citation21]. It can be reproducibly identified in the genetic region of Xbarc361–Xbarc18 in our study. The map location of the QTL for tiller number per plant on 6A corresponded to the QTL that was reported by Naruoka et al. [Citation37]. QMas.MedDurum-2A, which is associated with phenotypic variance of aboveground biomass, has been mapped on chromosome 2A in Durum wheat (Triticum turgidum L. var. durum) and is linked to Xwmc181 [Citation38]. Xwmc181 was 36 cM apart from Xgwm294 on 2A in Somers’s study [Citation39]. In the present study, the QTL for the aboveground dry matter per plant in the genetic region of Xcdo1281–Xgwm473 showed a similar genetic distance with Xgwm294. The QTL for the aboveground dry matter per plant on 6A in our study could be traced to a similar map location as that of QPlantc.sau-6A.1 [Citation40]. For harvest index, the map location of the QTL in ITMI on 2D corresponded to the QTL of QHi.ccsu-2D.2 [Citation41]. The QTLs for harvest index on 1D and 7B could be traced to the same chromosomal locations reported in previous studies [Citation42, Citation43].
QTL analysis for photosynthesis traits
Supporting the findings of Ma et al. [Citation44], we identified a QTL for chlorophyll content on 7B at the seeding stage. The location of the QTLs for chlorophyll content in ITMI on 2B, 3A and 6B in our dataset corresponded to that of previously detected QTLs for the same trait; QChl-2B.1, QChl-3A and QLgr.KoxSv-6B [Citation15, Citation45]. Moreover, the QTLs for stomatal conductance on 2D, 3A (Xgwm666–Xgwm480), 5D and 6D had the same location as Qgs-2D, Qgs-3A, Qgs.sun-5D and Qgs-6D, respectively [Citation15, Citation46, Citation47]. Finally, the location of QTLs for net photosynthetic rate in ITMI identified on chromosomes 5A, 5B (Xcdo1326–Xbarc140) and 6B in this study corresponded to those of previously detected QTLs for the same trait, QPN-5A, QPN-5B and QPN-6B [Citation15]. We identified other QTLs with comparable chromosomal locations to those reported in previous studies, including QTLs for Ci on chromosomes 1A, 5B and 7B, and QTLs for transpiration rate on chromosomes 6A and 7B [Citation15, Citation40, Citation46]. However, following comparison of common markers among different genetic maps, these QTLs lost their mapping similarities, indicating that these might be due to novel loci that have not been previously characterized and warrant further study.
QTL analysis for grain yield conditioned on yield components and photosynthesis traits
The comparative analysis of normal and conditional QTL mapping had four possible outcomes (): (1) A normal QTL for trait A with no identification for conditional trait of y(A|B), suggesting that this QTL for trait A entirely contributed by trait B. (2) A normal QTL for trait A can also be detected for y(A|B) with phenotypic variation range over 10%, indicating that this QTL for trait A partly affected by trait B. (3) A normal QTL for trait A also be detected for y(A|B) with similar phenotypic variation, indicating that this QTL for trait A is totally independent of trait B. (4) Only one additional QTL for y(A|B) was identified, suggesting that the expression of the QTL for trait A is suppressed by trait B, and this expression could be identified by the elimination of trait B influence. In classical genetic analysis, the verification of gene–trait linkage relationship needs to be done by fine mapping, map-based cloning and transgenic analysis, each step of which is laborious and time-consuming [Citation48]. The expression levels of candidate genes, and/or enzyme activity and metabolite concentrations can also be used as phenotypic traits. Thus, conditional analysis provides a platform for the construction of pathway networks to bridge the gap between genes and traits of interest [Citation25, Citation49].
Table 3. Number of unconditional and conditional QTL for grain yield detected in different environments.
For the locus in the region of Xbarc99–Xbarc169 on chromosome 1D, grain yield variance was entirely attributed to thousand kernel weight and harvest index at E1 and E3. This locus also identified a normal QTL for harvest index, which was entirely attributed by transpiration rate at the seedling stage; intercellular CO2 concentration, stomatal conductance, net photosynthetic rate and transpiration rate at heading stage; and intercellular CO2 concentration, net photosynthetic rate and transpiration rate at the grain filling stage. Although no normal QTL was identified for thousand kernel weight, we did identify a conditional QTL for this trait. Thousand kernel weight was suppressed by chlorophyll content at the heading and grain filling stages. Interestingly, a normal QTL for chlorophyll content at the grain filling stage was also identified at this locus. A comparison of the normal and conditional QTL mapping analyses between grain yield and photosynthesis traits showed consistence with those genetic relationships, with the exception of the intercellular CO2 concentration at the seedling stage, and transpiration rate at the grain filling stage. The region of Xbarc99–Xbarc169 contained a gene (SNP locus of IWB17397), which encoded a serine/threonine protein kinase of NEK4 [Citation50]. This protein showed interaction with NEK5 and NEK6 during cortical microtubule organization during epidermal cell expansion in Arabidopsis and barley (Hordeum vulgare), and if this interaction might be manipulated, it could be the way to improve important agronomic traits [Citation51–53].
For the locus in the region of Xbcd1095–Xfbb113 on chromosome 2B, the variation in grain yield was attributable in its entirety to all grain yield components, chlorophyll content and stomatal conductance traits at both the seedling and heading stages, as well as chlorophyll content and net photosynthetic rate at the grain filling stage. The aboveground dry matter per plant was suppressed by chlorophyll content at the heading and grain filling stages, and the transpiration rate at the grain filling stage. Xbcd1095 co-located with the SNP locus of IWA1040, which was tightly linked with a plasma membrane H+-ATPase [Citation50, Citation54]. A transgenic study indicated that overexpression of this gene caused light-induced stomatal opening, photosynthesis and plant growth enhancement [Citation55].
The photoperiod gene Ppd-D1, located in the genetic region of Xbcd1970–Xbcd262 on chromosome 2D, carried the most normal QTLs and a conditional QTL for grain yield [Citation25, Citation34, Citation56]. For this locus, grain yield was suppressed by the aboveground dry matter per plant, and the aboveground dry matter per plant was suppressed by nearly all photosynthesis traits with the exception of stomatal conductance at the seedling and grain filling stages, net photosynthetic rate at the seedling stage and transpiration rate at the seedling and heading stages. For the normal QTLs in this region, only the QTL for chlorophyll content at the grain filling stage showed significant genetic relationship to grain yield. However, the genetic relationships between grain yield and other normal QTLs were insignificant.
The genetic region of Xfba382–Xfba97 on chromosome 7A carried a normal QTL for fertile spikelets per spike. This normal QTL might suppress grain yield and was entirely attributable to all photosynthesis traits at the heading and grain filling stages.
Conclusions
We detected 82 normal QTLs and 314 conditional QTLs in our study. Sixty-one QTL clusters carried QTLs for two to 76 traits. A combination of normal and conditional QTL mapping analyses identified five QTL clusters which carried either normal QTLs or conditional QTLs for grain yield. The expression of these QTLs for grain yield was suppressed or contributed by grain yield components or photosynthesis traits. Manipulation of genes present within these QTL clusters might improve important agronomic traits and grain yield, such as the α-tubulin protein gene in the genetic region of Xbarc229–Xcdo89 and NEK4 in the genetic region of Xbarc99–Xbarc169 on 1D, plasma membrane H+-ATPase in the genetic region of Xbcd1095–Xfbb113 on 2B, and Ppd-D1 in the genetic region of Xbcd1970–Xbcd262 on 2D.
| Abbreviations | ||
| QTL | = | quantitative trait locus |
| RIL | = | recombinant inbred line |
| ITMI | = | International Triticeae Mapping Initiative population of ‘W7984/Opata85’ |
| ANCOVA | = | analyses of variance and covariance components |
Supplemental Material
Download MS Excel (31.5 KB)Disclosure statement
No potential conflict of interest was reported by the authors.
Additional information
Funding
Related Research Data
References
- Food and Agriculture Organisation of the United Nations. FAOSTAT. Available from: http://faostat.fao.org/site/567/DesktopDefault.aspx?PageID=567#ancor
- Curtis T, Halford N. Food security: the challenge of increasing wheat yield and the importance of not compromising food safety. Ann Appl Biol. 2014;164(3):354–372.
- Ray DK, Mueller ND, West PC, et al. Yield trends are insufficient to double global crop production by 2050. PLoS One. 2013;8(6):e66428.
- Zhang L, Liu D, Guo X, et al. Genomic distribution of quantitative trait loci for yield and yield-related traits in common wheat. J Integr Plant Biol. 2010;52(11):996–1007.
- Zhang L, Zhao YL, Gao LF, et al. TaCKX6-D1, the ortholog of rice OsCKX2, is associated with grain weight in hexaploid wheat. New Phytol. 2012;195(3):574–584.
- Zheng J, Liu H, Wang Y, et al. TEF-7A, a transcript elongation factor gene, influences yield-related traits in bread wheat (Triticum aestivum L.). J Exp Bot. 2014;65(18):5351–5365.
- Hou J, Jiang Q, Hao C, et al. Global selection on sucrose synthase haplotypes during a century of wheat breeding. Plant Physiol. 2014;164(4):1918–1929.
- Jiang Y, Jiang Q, Hao C, et al. A yield-associated gene TaCWI, in wheat: its function, selection and evolution in global breeding revealed by haplotype analysis. Theor Appl Genet. 2015;128(1):131–143.
- Simmonds J, Scott P, Brinton J, et al. A splice acceptor site mutation in TaGW2-A1 increases thousand grain weight in tetraploid and hexaploid wheat through wider and longer grains. Theor Appl Genet. 2016;129(6):1099–1112.
- Hu MJ, Zhang HP, Cao JJ, et al. Characterization of an IAA-glucose hydrolase gene TaTGW6 associated with grain weight in common wheat (Triticum aestivum L.). Mol Breed. 2016;36(3):25.
- Ma L, Li T, Hao C, et al. TaGS5-3A, a grain size gene selected during wheat improvement for larger kernel and yield. Plant Biotechnol J. 2016;14(5):1269–1280.
- Würschum T, Langer SM, Longin CFH, et al. A three-component system incorporating Ppd-D1, copy number variation at Ppd-B1, and numerous small-effect quantitative trait loci facilitates adaptation of heading time in winter wheat cultivars of worldwide origin. Plant Cell Environ. 2018;41(6):1407–1416.
- Yang DL, Jing RL, Chang XP, et al. Quantitative trait loci mapping for chlorophyll fluorescence and associated traits in wheat (Triticum aestivum). J Integr Plant Biol. 2007;49(5):646–654.
- Zhang ZB, Xu P, Jia JZ, et al. Quantitative trait loci for leaf chlorophyll fluorescence traits in wheat. Aust J Crop Sci. 2010;4:571–579.
- Xu YF, Li SS, Li LH, et al. QTL mapping for yield and photosynthetic related traits under different water regimes in wheat. Mol Breed. 2017;37(3):34.
- Evans LT. 1975. Crop physiology: some case histories. London: Cambridge University Press.
- Gebbing T, Schnyder H. Pre-anthesis reserve utilization for protein and carbohydrate synthesis in grains of wheat. Plant Physiol. 1999;121(3):871–878.
- Tambussi EA, Bort J, Guiamet JJ, et al. The photosynthetic role of ears in C3 cereals: metabolism, water use efficiency and contribution to grain yield. Crit Rev Plant Sci. 2007;26(1):1–16.
- Wen YX, Zhu J. Multivariable conditional analysis for complex trait and its components. Yi Chuan Xue Bao. 2005;32(3):289–296.
- Cui F, Li J, Ding A, et al. Conditional QTL mapping for plant height with respect to the length of the spike and internode in two mapping populations of wheat. Theor Appl Genet. 2011;122(8):1517–1536.
- Cui F, Zhao C, Li J, et al. Kernel weight per spike: what contributes to it at the individual QTL level? Mol Breed. 2013;31(2):265–278.
- Ding AM, Li J, Cui F, et al. Mapping QTLs for yield related traits using two associated RIL populations of wheat. Acta Agron Sin. 2011;37:1511–1524.
- Wang L, Cui F, Ding A, et al. Length of internode and spike: how do they contribute to plant height of wheat at an individual QTL level? Cereal Res Commun. 2013;41(1):54–65.
- Yu M, Chen G-Y, Pu Z-E, et al. Quantitative trait locus mapping for growth duration and its timing components in wheat. Mol Breed. 2015;35(1):44.
- Yu M, Mao SL, Hou DB, et al. Analysis of contributors to grain yield in wheat at the individual quantitative trait locus level. Plant Breed. 2018;137(1):35–49.
- Deynze AV, Dubcovsky J, Gill K, et al. Molecular-genetic maps for group 1 chromosomes of Triticeae species and their relation to chromosomes in rice and oat. Genome. 1995;38(1):45–59.
- Zhu J. Mixed model approaches for estimating genetic variances and covariances. J Biomath. 1992;1:1–11.
- Holland JB, Nyquist WE, Cervantes-Martínez CT. Estimating and interpreting heritability for plant breeding: an update. Plant Breed Rev. 2003;22:9–112.
- Holland JB. Estimating genotypic correlations and their standard errors using multivariate restricted maximum likelihood estimation with SAS Proc MIXED. Crop Sci. 2006;46(2):642–654.
- Chen G, Zhu J. QGAStation 1.0. Software for the classical quantitative genetics. Hangzhou: Institute of Bioinformatics, Zhejiang University; 2003.
- Song Q, Shi J, Singh S, et al. Development and mapping of microsatellite (SSR) markers in wheat. Theor Appl Genet. 2005;110(3):550–560.
- Users’ Manual of QTL IciMapping Version 4.0. 2014. The Quantitative Genetics Group, Institute of Crop Science, Chinese Academy of Agricultural Sciences (CAAS), Beijing, China, and Genetic Resources Program, International Maize and Wheat Improvement Center (CIMMYT), Apdo.
- Sourdille P, Singh S, Cadalen T, et al. Microsatellite-based deletion bin system for the establishment of genetic-physical map relationships in wheat (Triticum aestivum L.). Funct Integr Genom. 2004;4(1):12–25.
- Yu M, Mao S-L, Chen G-Y, et al. QTLs for uppermost internode and spike length in two wheat RIL populations and their affect upon plant height at an individual QTL level. Euphytica. 2014;200(1):95–108.
- Zhang H, Chen J, Li R, et al. Conditional QTL mapping of three yield components in common wheat (Triticum aestivum L.). Crop J. 2016;4(3):220–228.
- Mason RE, Hays DB, Mondal S, et al. QTL for yield, yield components and canopy temperature depression in wheat under late sown field conditions. Euphytica. 2013;194(2):243–259.
- Naruoka Y, Talbert L, Lanning S, et al. Identification of quantitative trait loci for productive tiller number and its relationship to agronomic traits in spring wheat. Theor Appl Genet. 2011;123(6):1043–1053.
- Soriano JM, Malosetti M, Roselló M, et al. Dissecting the old Mediterranean durum wheat genetic architecture for phenology, biomass and yield formation by association mapping and QTL meta-analysis. PLoS One. 2017;12(5):e0178290.
- Somers DJ, Isaac P, Edwards K. A high-density microsatellite consensus map for bread wheat (Triticum aestivum L.). Theor Appl Genet. 2004;109(6):1105–1114.
- Liang Y, Zhang K, Zhao L, et al. Identification of chromosome regions conferring dry matter accumulation and photosynthesis in wheat (Triticum aestivum L.). Euphytica. 2010;171(1):145–156.
- Kumar N, Kulwal P, Balyan H, et al. QTL mapping for yield and yield contributing traits in two mapping populations of bread wheat. Mol Breed. 2007;19(2):163–177.
- Sukumaran S, Dreisigacker S, Lopes M, et al. Genome-wide association study for grain yield and related traits in an elite spring wheat population grown in temperate irrigated environments. Theor Appl Genet. 2015;128(2):353–363.
- Golabadi M, Arzani A, Maibody SM, et al. Identification of microsatellite markers linked with yield components under drought stress at terminal growth stages in durum wheat. Euphytica. 2011;177(2):207–221.
- Ma Y, Mao S-L, Chen G-Y, et al. QTLs for waterlogging tolerance at germination and seedling stages in population of recombinant inbred lines derived from a cross between synthetic and cultivated wheat genotypes. J Integr Agric. 2014;13(1):31–39.
- Graziani M, Maccaferri M, Royo C, et al. QTL dissection of yield components and morpho-physiological traits in a durum wheat elite population tested in contrasting thermo-pluviometric conditions. Crop Pasture Sci. 2014;65(1):80–95.
- Wang S, Jia S, Sun D, et al. Genetic basis of traits related to stomatal conductance in wheat cultivars in response to drought stress. Photosynthetica. 2015;53(2):299–305.
- Barbour MM, Bachmann S, Bansal U, et al. Genetic control of mesophyll conductance in common wheat. New Phytol. 2016;209(2):461–465.
- Zhang KP, Zhao L, Hai Y, et al. QTL mapping for adult-plant resistance to powdery mildew, lodging resistance, and internode length below spike in wheat. Acta Agron Sin. 2008;34(8):1350–1357.
- Yu M, Liu ZH, Yang B, et al. The contribution of photosynthesis traits and plant height components to plant height in wheat at the individual quantitative trait locus level. Sci Rep. 2020;10(1):1–10.
- Maccaferri M, Zhang J, Bulli P, et al. A genome-wide association study of resistance to stripe rust (Puccinia striiformis f. sp. tritici) in a worldwide collection of hexaploid spring wheat (Triticum aestivum L.). G3. 2015;5:449–465.
- Zhang B, Chen HW, Mu RL, et al. NIMA-related kinase NEK6 affects plant growth and stress response in Arabidopsis. Plant J. 2011;68(5):830–843.
- Motose H, Hamada T, Yoshimoto K, et al. NIMA-related kinases 6, 4, and 5 interact with each other to regulate microtubule organization during epidermal cell expansion in Arabidopsis thaliana. Plant J. 2011;67(6):993–1005.
- Kruszka K, Pacak A, Swida-Barteczka A, et al. Transcriptionally and post-transcriptionally regulated microRNAs in heat stress response in barley. J Exp Bot. 2014;65(20):6123–6135.
- Finnie C, Andersen C, Borch J, et al. 14-3-3 Proteins are involved in an epidermis-specific response to the barley powdery mildew fungus. Plant Mol Biol. 2002;49(2):137–147.
- Wang Y, Noguchi K, Ono N, et al. Overexpression of plasma membrane H+-ATPase in guard cells promotes light-induced stomatal opening and enhances plant growth. Proc Natl Acad Sci USA. 2014;111(1):533–538.
- Thambugala D, Brûlé-Babel AL, Blackwell BA, et al. Genetic analyses of native Fusarium head blight resistance in two spring wheat populations identifies QTL near the B1, Ppd-D1, Rht-1, Vrn-1, Fhb1, Fhb2, and Fhb5 loci. Theor Appl Genet. 2020;133(10):2775–2722.