
Abstract
Salinity is one of major environmental constraints that adversely affect plant growth and pose a serious threat to crop productivity. One basic concern is related to tissue sensitivity differences to salt stress. It is intriguing that much more research efforts have been directed to shoots/leaves than roots, although roots are the first tissues directly encountering salt stress and acting as its sensor. We focused on the tissue sensitivity differences to salt stress in wheat seedlings by adopting a novel tip bioassay. The tip bioassay employed a set of 5-mL pipette tips filled with vermiculite placed over racks containing NaCl solution. Using this simple device, after determining the time course of growth inhibition under varying concentrations of NaCl, we compared the salt sensitivity in 19 diverse germplasms from five Triticum species after 7 and 14 days of exposure to 200 mmol/L NaCl. Markedly greater reduction in root length than shoot length was observed in all lines. Both the magnitude and relative rate of inhibition were much greater in roots than shoots and significant differences were observed in tissue, line, stress duration and their interactions. Our tip bioassay demonstrated that roots were more sensitive than shoots to the growth-suppressing effect of salt during the early seedling stage in wheat. These results point out the need of further research targeted on the role of and communication between roots and shoots in salt stress sensing and response.
Introduction
Salinity is one of major environmental constraints that reduces crop productivity particularly in arid and semi-arid areas [Citation1]. Wheat belongs to glycophytes (salt-sensitive as compared to salt-tolerant halophytes), although hexaploid bread wheat is moderately more tolerant than tetraploid durum wheat. The global loss of wheat production was reported to amount up to 60–70% under high irrigation salinity and high sodicity [Citation2,Citation3].
High salt concentration generally inhibits plant growth due to osmotic or water-deficit effects and salt-specific or ion-excess effects, both ultimately leading to yield loss [Citation1,Citation4,Citation5]. Various methodologies have been used to assess the levels of salt sensitivity and tolerance in cereals [Citation6]. Many physiological traits such as root and shoot growth, water relation, ion homeostasis, photosynthesis, senescence, and yield components were studied to measure the impact of salt stress. Both destructive and nondestructive methodologies employing different experimental systems, e.g., agar plates, hydroponics, soil-filled pots, and cone-tainers, have been used to measure the growth response to salt stress. Cone-tainers is a bioassay tool, which holds racks with plastic cones filled with vermiculite [Citation7]. Hyperspectral imaging has also been developed and effectively used in visual monitoring of plant growth and physiological changes in response to salt stress [Citation8]. We devised a novel tip method, which was originally developed in the Laboratory of Plant Genetics, Graduate School of Agricultural Science, Kyoto University (Miyuki Nitta, unpublished) for growing wheat plants until seed setting. We modified this simple method for assessing salt stress response of wheat seedlings.
Root meristem was reported to act as a salt stress sensor [Citation9] and high salt concentration represses root growth by suppressing cell division and elongation [Citation10]. It has however been generally assumed that shoots/leaves are more sensitive than roots and thus shoots/roots growth ratio decreases with increasing salt stress [Citation5]. In fact, less attention has been directed toward roots for studying salt stress response. We, therefore, evaluated the levels of salt sensitivity using the tip bioassay in 19 diverse germplasms derived from five Triticum species. We herein report our results, which clearly demonstrate higher salt sensitivity of roots than shoots during the early seedling stage of wheat.
Materials and methods
Plant materials
Nineteen wheat lines were used, which covered diverse strains and cultivars from five hexaploid wheat species T. aestivum, T. sphaerococcum, T. compactum, T. spelta, and T. mach (). Twelve of these lines consisted of genetic stocks with a wide range of morphological and geographical diversity [Citation11]. They showed large variability in their sensitivity to submergence stress [Citation12]. The remaining seven lines included two Japanese cultivars (Norin 61 and Shirogane-komugi), two cultivars released from Green Revolution project in SIMMYT (Penjamo 62 and Siete Cerros 66) and three cultivars each from Bulgaria (Pliska), France (Soissons) and Uklaine (Mironovskaya 808). Seeds harvested from glasshouse-grown plants in July 2017 were used.
Table 1. List of 19 lines of five Triticum species used in this study.
Novel tip bioassay for studying salt sensitivity of wheat seedlings
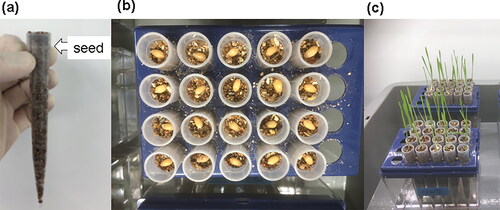
In the tip bioassay, 5-mL pipette tips filled with vermiculite vertically inserted in 24 wells on trays over racks (Watson NEXTY, Gilson) were used (). Wheat seeds imbibed with deionized water for 2 days were sown individually with embryo side upward and then covered by ca. 1 cm depth of vermiculite in tips. For each experimental plot, tips each containing an imbibed seed were placed in two racks both filled with 400 mL of deionized water. Incubation conditions for seed germination and seedling growth were 5 °C day/10 °C night, 12 h light/12 h dark; LED 120 μmol m−2 s−1. On the 7th day after seedling, salt stress was given by replacing deionized water in the rack with NaCl solution. At every 2 or 3 days, deionized water was added up to the line drawn on a side of each rack to maintain the water level. Control seedlings were continuously grown over deionized water. Shoot length (SL, length of the first leaves) and root length (RL, length of the primary roots) in the stressed group and the control group were measured at the indicated time points.
Figure 1. Tip method for assessing sensitivity to salt stress in CS. (a) 5 mL pipette tip filled with vermiculite. (b) A tray with 20 tips, each containing an imbibed seed placed on vermiculite with embryo facing upward. (c) Seedlings growing in tips laid on trays in racks containing NaCl solution.
For time-course study of shoot and root development under salt stress and control conditions, standard common wheat cv. Chinese Spring (CS) was used. Seven-day-old seedlings were incubated with varying concentrations of NaCl (0–500 mmol/L) for 0, 3, 7, and 14 days after NaCl imposition. After the time-course study, the levels of salt sensitivity in all 19 wheat lines were assessed based on SL and RL after 0, 7, and 14 days with 200 mmol/L NaCl. The magnitude of inhibition of SL and RL was estimated as differences between the mean lengths of the nonstressed and those of the stressed seedlings. The relative rate (%) of inhibition of SL and RL was calculated as the magnitude of inhibition of SL and RL divided by the mean lengths of the nonstressed seedlings. For each time point and NaCl concentration, 30 seedlings of each line were used and a whole experiment was repeated three times.
Statistical analyses
Three-way analysis of variance tests was performed using R software. Pairwise comparisons of SL and RL between the stressed and control seedlings were made by Steel test. The magnitude of growth inhibition and relative rate of inhibition were calculated at the two stress durations (7 and 14 days) by Steel–Dwass test, both using a software ‘EZR’ [Citation13].
Results and discussion
Time-course study of growth inhibition under varying concentrations of NaCl
To set experimental conditions suitable for assessing the salt stress response, the time course of seedling growth was first monitored under the stress and control conditions using cv. CS. Salt stress was given by exposing 7-day-old seedlings (9 days after imbibition of seeds) to varying concentrations of NaCl solution (0, 25, 50, 100, 200, 300, 400, and 500 mmol/L) and SL and RL were measured after 0, 3, 7, 10, and 14 days of growth (7, 10, 14, 17, and 21 days after seeding) under the stress and control conditions.
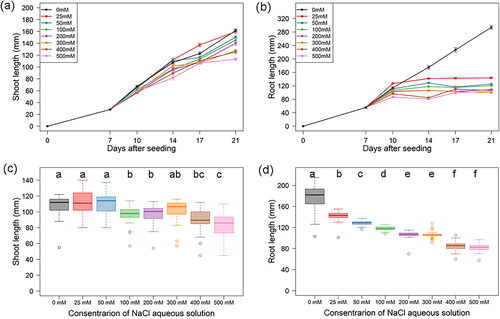
SL growth showed inhibition in a manner dependent on the duration and concentration of NaCl imposition (). SL growth started to decrease after the 3rd day of salt stress but continued until the 14th day under all concentrations of NaCl tested. Significant inhibition of SL growth was observed at NaCl concentration over 100 mmol/L at the 7th day (). In contrast, RL growth was markedly inhibited and ceased almost completely after the 7th day under all concentrations of NaCl (). Moreover, the magnitude of RL inhibition was clearly concentration dependent ().
Figure 2. Inhibition of seedling growth by NaCl. Time-course plots showing SL (a) and RL (b) of CS under varying concentrations (0 to 300 mmol/L) of NaCl. Box plots showing SL (c) and RL (d) under varying concentrations of NaCl at the 7th day of NaCl imposition (14th day after seeding). Letters upon boxes show significance of differences between groups based on Steel–Dwass test (p < 0.05).
Assessment of salt sensitivity in 19 wheat lines from five triticum species
Salt sensitivity was next assessed based on SL and RL at the 7th and 14th day under 200 mmol/L NaCl in all 19 lines of wheat seedlings. Three-way ANOVA test showed significant differences of seedling growth in lines, tissues and stress durations as well as in their interactions (). No significant salt effects were observed in SL of stressed seedlings in 9 lines (Tve, SK, S615, Cmp, Mch, M808, Shrg, Soiss, and Pnjm) at the 7th day of stress, and in five lines (Tve, Slm, N61, M808, and Pnjm) at the 14th day (). SL of Tve, M808, and Pnjm showed no significant inhibition at the both stress periods. N61, Plsk, and Siete showed rather increased SL in stressed seedlings at the 7th day. By contrast, all lines unequivocally showed much shorter RL compared with control seedlings at both stress durations at the 0.1% significance level (). Representative photos of stressed seedlings of N26 incubated with 200 mmol/L NaCl for 7 days together with control seedlings are shown, in which significant RL inhibition but no apparent SL inhibition was observed (). Under the stress conditions, primary root growth was greatly inhibited.
Figure 3. Box plots showing shoot growth measured by SL in 18 wheat lines of five Triticum species. SL was measured of seedlings grown under 200 mmol/L NaCl for 7 days (14 days after seedling) and 14 days (21 days after seedling) under salt stress. Data of CS are shown in . Significance of differences between the control and stressed seedlings are indicated by asterisks (* represents p < 0.05, **p < 0.01 and ***p < 0.001).
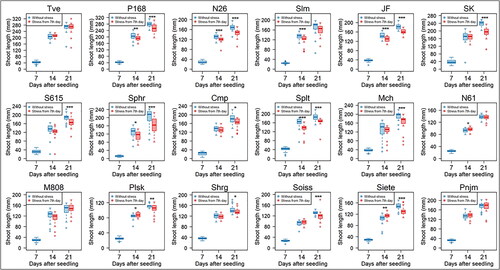
Figure 4. Box plots showing root growth measured by RL in 18 wheat lines of five Triticum species. RL was measured of seedlings grown under 200 mmol/L NaCl for 7 days (14 days after seedling) and 14 days (21 days after seedling) under salt stress. Data of CS are shown in . Significance of differences between the control and stressed seedlings are indicated by asterisks (* represents p < 0.05, **p < 0.01 and ***p < 0.001).
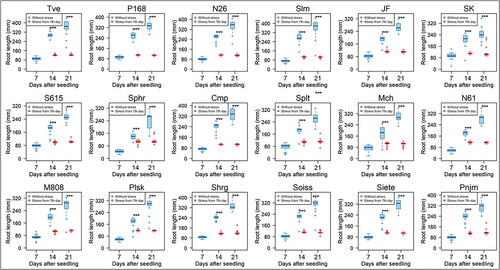
Figure 5. Representative photos showing seedling morphology of N26. (a) control, (b) 200 mmol/L NaCl. Photos were taken at the 7th day after NaCl imposition (14th day after seeding).
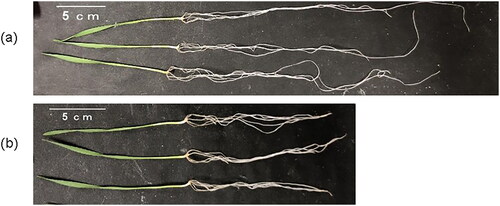
Table 2. Three-way ANOVA showing significant differences of seedling growth in lines, tissues, stress durations, and their interactions under 200 mmol/L NaCl.
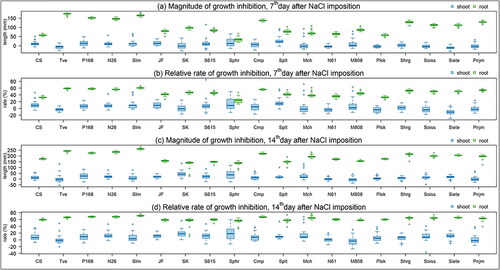
We further compared seedling growth of stressed and control seedlings based on the magnitude of inhibition (differences between the mean lengths of control seedlings and the lengths of stressed seedlings) and relative rate of inhibition (percentage of the magnitude of inhibition divided by the control seedlings) of SL and RL at the 7th and 14th days of stress in all lines (). Both the magnitude and relative rate of inhibition clearly showed that root growth was much more sensitive than shoot growth to salt stress after both stress durations. Based on RL inhibition, CS, Sphr, and Plsk were more tolerant than other lines at the 7th day, and SK, S615, Sphr, and Splt were more tolerant at the 14th day. Based on the magnitude of RL inhibition, Sphr was the most tolerant among the lines throughout the experiment. Negative values of the relative rate of SL inhibition were observed in several lines, particularly in N61, Plsk and Siete at the 7th day (). The result suggested that SL growth in these lines was rather stimulated under the stressed condition, which was consistent with the result shown in .
Figure 6. Box plots showing magnitude and relative rate of growth inhibition based on SL and RL in 19 lines of five Triticum species. Magnitude and relative rate of growth inhibition of SL and RL were shown after 7 days (a and b) and 14 days (c and d) under 200 mmol/L NaCl.
CS showed significantly shorter RL even after 3 days of growth under 200 mmol/L NaCl ( and Supplemental Figure S1). Because salt stress was concentration dependent (), we further examined the effect of 50 mmol/L NaCl after the 3-day stress period, using two relatively tolerant lines, CS and Sphr, and a sensitive line N61 judged based on RL growth inhibition. Under this lower NaCl concentration, no significant inhibition of RL occurred among the lines (Supplemental Figure S1). SL also showed no significant inhibition under this stress condition (data not shown).
A simple, efficient, and reliable bioassay method for evaluating salt response in wheat seedlings
The aims of our study were two-pronged, i.e., (1) developing a simple, efficient and reliable screening method of wheat germplasms with high and uniform ability of growth under salt stress, and (2) comparing tissue sensitivity to salt stress between shoots and roots. The bioassay method is critical for accurate phenotyping of complex traits such as abiotic environmental stress response [Citation12]. The bioassay for precision assessment requires simplicity, repeatability and verifiability. We developed a novel tip bioassay () for assessing the levels of salt sensitivity based on shoot and root growth inhibition in wheat seedlings. Using this method, we demonstrated that roots were more sensitive than shoots to salt stress during the early seedling stage of wheat. Salt stress caused marked inhibition of root growth even at 25 mmol/L NaCl, while inhibition of shoot growth was observed only under NaCl concentrations higher than 100 mmol/L (). Greater sensitivity of roots than shoots to salt stress was confirmed by comparison of the magnitude and relative rate of inhibition of SL and RL in all 19 lines of five diverse Triticum species (). Significant line differences of seedling growth and their interactions with tissues and stress periods were observed (). Measurement of shoot and root fresh weights under the stressed and nonstressed seedlings gave results consistent with those of SL and RL (data not shown).
Roots are highly sensitive to salt stress
There has been a consensus that plant growth under salt stress proceeds through two distinct phases [Citation4]. Phase I is characterized by osmotic or water-deficit effects and phase II by salt-specific or ion-excess effects. Moreover, shoot/leaf growth was reported more sensitive to salt stress than root growth. This has been explained based on the general assumption that reduction in the leaf area development relative to root growth would decrease the water use, thus allowing plants to conserve water and prevent salt concentration from increasing in surrounding environment [Citation5,Citation14]. Nevertheless, it remains uncertain whether the main target tissues of salt stress lie in roots and/or shoots/leaves. There have been many studies reporting greater sensitivity of shoots and leaves than roots, thus decreased shoot/root ratio under salt stress. Yet there are many other reports showing rather greater sensitivity of roots than shoots [Citation15–18] or equivalent sensitivity between the two [Citation19–23]. In durum wheat, the shoot biomass was substantially reduced by salinity, but genotypic differences in growth were detected after 3–4 weeks of salt stress [Citation4,Citation24]. No significant differences were observed in the shoot elongation rate even between most sensitive cultivars including durum wheat and tolerant barley in the first 10 days of salt stress [Citation4], suggesting that no genotypic differences were apparent in shoot growth during the early stages under salt stress. In agreement with these observations, it was reported that significant differences in shoot growth between a salt-sensitive durum cultivar and a salt-tolerant bread wheat cultivar appeared only after 40 days of the stress [Citation25]. The apparent delay of suppression of shoot growth after salt imposition was ascribed to delayed ionic accumulation that caused damage on shoots and leaves, although these studies did not report root growth for comparison.
More attention should be directed to roots in evaluating salt response
It has been well established that efficient exclusion of excess Na+ from cytoplasm through transpiration system and sequestration of Na+ and Cl– in vacuoles of shoot/leaf and root tissues are the most important steps towards the maintenance of ion homeostasis inside the stressed cells [Citation26,Citation27]. The roots are the first and direct tissues that encounter salt stress and act as a sensor of elevated salinity. It was suggested that root meristems, which are located at the tips of roots, can act as a salt stress sensor, or at least a tissue that harbors salt stress sensor components [Citation9,Citation26,Citation28]. In fact, high salinity represses root growth by suppressing root cell division and elongation [Citation10]. Auxin plays an essential role in root meristem maintenance and root growth [Citation29]. In a model plant Arabidopsis, NaCl concentration over 50 mmol/L greatly reduced primary root growth, and a mutant allele of IAR4 (IAA-conjugate resistant 4) further increased its sensitivity to salt stress, with strong inhibition of primary root growth and reduced survival rate [Citation30]. This indicates that salt stress regulates primary root growth through auxin IAA signaling. The hypersensitive response of roots to salt stress (halotropism) may likely be caused by overaccumulation of Na+ ion and high Na+/K+ ratio but not by osmotic stress [Citation31]. According to the detailed study of root growth at the phytomer levels, salinity is a major impediment to main axis elongation, reducing not only root axis length but also root hair density and length as well as root surface area in wheat [Citation32].
Less attention has been devoted to the study of roots in cereals with respect to salt stress response and salt sensitivity and/or tolerance mechanisms. Our results demonstrating high sensitivity of roots to salt stress clearly pointed out that more detailed study is needed toward clarifying the roles of root tissues as salt stress sensors and their target sites of action and better understanding of sensitivity differences between the root and leaf systems. The tip bioassay, which can easily be scaled up to accommodate a larger number of seedlings for efficient screening of germplasms, might hopefully provide a useful tool for such study.
Conclusions
We developed a novel tip bioassay for assessing salt sensitivity in wheat seedlings. Using this bioassay method, we demonstrated that roots were more sensitive than shoots to salt stress in 19 lines derived from five Triticum species. Root growth was markedly inhibited and stopped before 7 days of stress at NaCl concentrations higher than 25 mmol/L, but shoot growth continued, although it was reduced, at least until 14 days of stress. Significant line differences and their interactions with tissues and stress durations were observed in the sensitivity of roots to salt stress. Our results emphasized the necessity of more detailed study targeted on roots toward understanding their roles and communication with shoots in salt stress response in wheat seedlings.
Supplemental Material
Download PDF (107.2 KB)Disclosure statement
All authors declare that they have no conflict of interest; they are entitled to the authorship and have approved the final version of the manuscript.
Data availability statement
The data that support the findings of this study are available from the corresponding author, CN, upon reasonable request.
Additional information
Funding
Related Research Data
References
- Hanin M, Ebel C, Ngom M, et al. New insights on plant salt tolerance mechanisms and their potential use for breeding. Front Plant Sci. 2016;7:1787. https://doi.org/10.3389/fpls.2016.01787.
- El-Hendawy SE, Hassan WM, Al-Suhaibani NA, et al. Comparative performance of multivariable agro-physiological parameters for detecting salt tolerance of wheat cultivars under simulated saline field growing conditions. Front Plant Sci. 2017;8:435. https://doi.org/10.3389/fpls.2017.00435.
- Genc Y, Taylor J, Lyons G, et al. Bread wheat with high salinity and sodicity tolerance. Front Plant Sci. 2019;10:1280. https://doi.org/10.3389/fpls.2019.01280.
- Munns R, Schachtman DP, Condon AG. The significance of the two-phase growth response to salinity in wheat and barley. Funct Plant Biol. 1995;22(4):561–569. https://doi.org/10.1071/PP9950561.
- Munns R, Tester M. Mechanisms of salinity tolerance. Annu Rev Plant Biol. 2008;59:651–681.
- Negrão S, Schmöckel SM, Tester M. Evaluating physiological responses of plants to salinity stress. Ann Bot. 2017;119(1):1–11. https://doi.org/10.1093/aob/mcw191.
- Bai J, Yan W, Wang Y, et al. Screening oat genotypes for tolerance to salinity and alkalinity. Front Plant Sci. 2018;9:1302. https://doi.org/10.3389/fpls.2018.01302.
- Moghimi A, Yang C, Miller ME, et al. A novel approach to assess salt stress tolerance in wheat using hyperspectral imaging. Front Plant Sci. 2018;9:1182. https://doi.org/10.3389/fpls.2018.01182.
- Wu H, Shabala L, Liu X, et al. Linking salinity stress tolerance with tissue-specific Na(+) sequestration in wheat roots. Front Plant Sci. 2015;6:71. https://doi.org/10.3389/fpls.2015.00071.
- Duan L, Sebastian J, Dinneny J. Salt-stress regulation of root system growth and architecture in Arabidopsis seedlings. In: Methods in Molecular Biology, Estevez JM, editor. Plant cell expansion: methods and protocols, methods in molecular biology, Springer. Vol. 1242; 2015. https://doi.org/10.1007/978-1-4939-1902-4_10.
- Tsunewaki K. In: Tsunewaki K, editor. Genetic diversity of the cytoplasm in Triticum and Aegilops. Tokyo, Japan; Japan Society for the Promotion of Science; 1980, p. 290.
- Takenaka S, Yamamoto S, Nakamura C. Genetic diversity of submergence stress response in cytoplasms of the Triticum-Aegilops complex. Sci Rep. 2018;8(1):16267. https://doi.org/10.1038/s41598-018-34682-3.
- Kanda Y. Investigation of the freely available easy-to-use software 'EZR' for medical statistics. Bone Marrow Transplant. 2013;48(3):452–458. https://doi.org/10.1038/bmt.2012.244.
- Munns R. Physiological processes limiting plant growth in saline soils: some dogmas and hypothesis. Plant Cell Environ. 1993;16(1):15–24. https://doi.org/10.1111/j.1365-3040.1993.tb00840.x.
- Bilkis A, Islam MR, Hafiz MHR, et al. Effect of NaCl induced salinity on some physiological and agronomic traits of wheat. Pak J Bot. 2016;48:455–460.
- Gasimova F, Azizov I. Evaluation of salt tolerance in bread wheat (Triticum aestivum L.) genotypes during early ontogenesis. Emer Life Sci Rep. 2016;2:21–25.
- Soares ALC, Geilfus C-M, Carpentier SC. Genotype-specific growth and proteomic responses of maize toward salt stress. Front Plant Sci. 2018;9:661. https://doi.org/10.3389/fpls.2018.00661.
- Bacu A, Ibro V, Nushi M. Compared salt tolerance of five local wheat (Triticum aestivum L.) cultivars of Albania based on morphology, pigment synthesis and glutathione content. EuroBiotech J. 2020;4:1. https://doi.org/10.2478/ebtj-2020-0006.
- Jia W, Wang Y, Zhang S, et al. Salt-stress-induced ABA accumulation is more sensitively triggered in roots than in shoots. J Exp Bot. 2002;53(378):2201–2206. https://doi.org/10.1093/jxb/erf079.
- Islam A, Malik AI, Islam AKMR, et al. Salt tolerance in a Hordeum marinum–Triticum aestivum amphiploid, and its parents. J Exp Bot. 2007;58(5):1219–1229. https://doi.org/10.1093/jxb/erl293.
- Shahzad A, Ahmad M, Iqbal M, et al. Evaluation of wheat landrace genotypes for salinity tolerance at vegetative stage by using morphological and molecular markers. Genet Mol Res. 2012;11(1):679–692. https://doi.org/10.4238/2012.March.19.2.
- Hussain B, Khan AS, Ali Z. Genetic variation in wheat germplasm for salinity tolerance at seedling stage: improved statistical inference. Turk J Agric For. 2015;39:182–192. https://doi.org/10.3906/tar-1404-114.
- Hasan MM, Baque MA, Habib MA, et al. Screening of salt tolerance capability of wheat genotypes under salt stress condition. UJAR. 2017;5(4):235–249.
- James RA, Rivelli AR, Munns R, et al. Factors affecting CO2 assimilation, leaf injury and growth in salt-stressed durum wheat. Funct Plant Biol. 2002;29(12):1393–1403.
- Nicolas ME, Munns R, Samarakoon AB, et al. Elevated CO2 improves the growth of wheat under salinity. Aust J Plant Physiol. 1993;20:349–360.
- Silva P, Geros H. Regulation by salt of vacuolar H+-ATPase and H+-pyrophosphatase activities and Na+/H+ exchange. Plant Signal Behav. 2009;4(8):718–726. https://doi.org/10.4161/psb.4.8.9236.
- Munns R, James RA, Läuchli A. Approaches to increasing the salt tolerance of wheat and other cereals. J Exp Bot. 2006;57(5):1025–1043. https://doi.org/10.1093/jxb/erj100.
- Wu H. Plant salt tolerance and Na+ sensing and transport. Crop J. 2018;6(3):215–226. https://doi.org/10.1016/j.cj.2018.01.003.
- Han EH, Petrella DP, Blakeslee JJ. 'Bending' models of halotropism: incorporating protein phosphatase 2A, ABCB transporters, and auxin metabolism. J Exp Bot. 2017;68(12):3071–3089. https://doi.org/10.1093/jxb/erx127.
- Fu Y, Yang Y, Chen S, et al. Arabidopsis IAR4 modulates primary root growth under salt stress through ROS-mediated modulation of auxin distribution. Front Plant Sci. 2019;10:522. https://doi.org/10.3389/fpls.2019.00522.
- Galvan-Ampudia CS, Julkowska MM, Darwish E, et al. Halotropism is a response of plant roots to avoid a saline environment. Curr Biol. 2013;23(20):2044–2050. http://dx.doi.org/10.1016/j.cub.2013.08.042.
- Robin AHK, Matthew C, Uddin MJ, et al. Salinity-induced reduction in root surface area and changes in major root and shoot traits at the phytomer level in wheat. J Exp Bot. 2016;67(12):3719–3729. https://doi.org/10.1093/jxb/erw064.