
Abstract
Bladder cancer (BLCA) is a common malignancy and has a poor prognosis. Single nucleotide polymorphisms (SNPs) in genes are closely associated with the tumorigenesis and tumor development and yet are not well illustrated in BLCA. In this study, we downloaded SNP‐related data and transcriptome profiling of BLCA from the Cancer Genome Atlas (TCGA) database and identified high frequency mutation genes using Maftools package and differentially expressed genes (DEGs) between BLCA and normal bladder tissues by the Limma package. Then, the overlapping genes between high frequency mutation genes and DEGs were obtained by the Venn diagram tool. These overlapping genes were analyzed by Gene Ontology (GO) and Kyoto Gene and Genome Encyclopedia (KEGG) pathway enrichment analysis, protein–protein interaction (PPI) network construction, survival analysis and drug–gene interaction analysis. As a result, 33 overlapping mutant genes were obtained, which were enriched in multiple KEGG pathways (e.g. cellular senescence) and GO items (e.g. muscle organ development, costamere and actin binding). A significant gene module was constructed by PPI network analysis and included 12 hub genes (SYNE1, DMD, ATM, EP300, ANK2, LAMA2, FAT1, SRRM2, MACF1, TSC1, VCAN and RXRA). Moreover, ATM, RXRA, TSC1, DMD, EP300, LAMA2 and VCAN were drug targets. These findings provide important bioinformatics and theoretical basis for understanding the pathogenesis of BLCA and exploring the detailed mechanisms of mutant genes in the disease.
Introduction
Bladder cancer (BLCA) ranks as the 10th most common malignancy worldwide, with 549,393 new cases diagnosed and 199,922 deaths in 2018 [Citation1]. The incidence and mortality rates in men are 9.6 and 3.2 per 100,000 respectively, and the rates are 4-fold higher in men than in women [Citation1,Citation2]. Thus, BLCA ranks higher among men, and it is the sixth most common cancer and ranks as the ninth leading cause of cancer death [Citation1]. Cigarette smoking is proved to be the major risk factor for BLCA [Citation3]. Most BLCA is diagnosed after the appearance of macroscopic hematuria in patients [Citation4]. Macroscopic hematuria is correlated with the advanced stage of BLCA [Citation4,Citation5]. However, there are no effective methods for BLCA diagnosed at the early stage [Citation6]. In addition, current therapies, mainly including transurethral resection, immunotherapy and chemotherapy, can improve the outcome of BLCA patients diagnosed at the early stage but have no significant effect on improving the prognosis of BLCA patients at the advanced stage [Citation7,Citation8]. Hence, it is necessary to fully understand the molecular mechanisms of the pathogenesis of BLCA.
Single nucleotide polymorphisms (SNPs) are the most common type of variation in genetic sequences [Citation9]. Accumulating evidence suggests that SNPs are closely related to the occurrence and development of tumors [Citation10]. SNPs in promoter regions can alter transcription factor binding, histone modifications, promoter activity and DNA methylation to affect gene expression [Citation11,Citation12]. For instance, SNP of TERT in the promoter region frequently occurs in the progression of BLCA [Citation13]. Mutations in the RB1, FGFR3, TP53 and PIK3CA genes have been observed in BLCA [Citation14]. Variants in the CASP9 and EPHX1 genes are related to BLCA survival [Citation15]. Therefore, SNPs have been regarded as potential biomarkers for tumor targeted therapy and early diagnosis [Citation16]. However, SNPs in BLCA have not been extensively elucidated [Citation17].
High-throughput sequencing technique provides an important method to investigate the molecular mechanisms of the pathogenesis of tumors and to search for potential therapeutic targets and diagnostic biomarkers [Citation18]. The Cancer Genome Atlas (TCGA) is a comprehensive and important database for cancer genomics research [Citation19]. The datasets in TCGA include genetic variants, miRNA, DNA methylation, transcriptome-wide expression and clinical information [Citation19]. Thus, our study used TCGA database to perform high-throughput sequencing analysis to identify SNPs in BLCA. We downloaded the SNPs data and transcriptome-wide expression of BLCA from TCGA, identified the significant SNPs and differentially expressed genes (DEGs), carried out functional enrichment analysis, protein–protein interaction (PPI) network construction, survival analysis as well as drug–gene interaction analysis. These analysis processes facilitate finding gene mutations associated with the occurrence and development of BLCA, and provide new insights for BLCA treatments.
Materials and methods
Data resources and analysis
The SNP data of BLCA were downloaded from TCGA database (https://portal.gdc.cancer.gov/). ‘Masked Somatic Mutation’ data were chosen from four types of data files and performed using the VarScan software (version 2.4.0, http://varscan.sourceforge.net/). Based on the TCGA database, the raw data of mRNA expression in FPKM (fragment per kilobase of exon model per million mapped reads) format and the corresponding clinical information were obtained using the UCSC Xena website (https://xenabrowser.net/datapages/), including 404 BLCA tissues and 19 normal bladder tissues. All data from TCGA in the present study are public and available, and consequently there was no ethical conflict to declare.
High frequency mutation genes analysis
The SNP-related data in maf (mutation annotation format) were processed and analyzed by the Maftools package (version 2.6.0, https://bioconductor.org/packages/release/bioc/html/maftools.html) [Citation20] in R language to obtain the mutated genes. The genes with more than 10% of mutation frequency were chosen to draw a waterfall plot.
Differentially expressed genes analysis
The raw data of mRNA expression in FPKM format were quantile normalized by the preprocessCore R package (version 1.40.0, http://bioconductor.org/packages/release/bioc/html/preprocessCore.html). Then, the differentially expressed genes (DEGs) between BLCA and normal bladder tissues were identified by the Limma package (Version 3.10.3, http://www.bioconductor.org/packages/2.9/bioc/html/limma.html). Adjusted p value <0.01 and | log2 FC (fold change) | > 1 were set as the cut-off criterion to identify DEGs. p-Values were adjusted to reduce the false positive rate using Benjamini and Hochberg false discovery rate method by default, which is the reason for choosing adjusted p value.
Next, the overlapping genes between DEGs and high frequency mutation genes were analyzed using Venn diagram tool (http://bioinfogp.cnb.csic.es/tools/venny/), which were used for further analysis.
Functional enrichment analysis
The above overlapping genes were performed by the cluster Profiler package (Version 3.16.0, https://bioconductor.org/packages/release/bioc/html/clusterProfiler.html) [Citation21] in R language to perform GO (Gene Ontology, http://geneontology.org/) and KEGG (Kyoto Gene and Genome Encyclopedia, https://www.genome.jp/kegg/kegg_ja.html) pathway analysis. The top 10 items in MF (molecular function), CC (cellular component), and BP (biological process) categories of GO as well as KEGG pathways were selected, which were used to plot bubble maps. Adjusted p value <0.05 and count ≥2 were designated as cut-off criteria. Count represents the number of genes that are enriched in each item.
PPI network construction and module analysis
PPI network construction was used to illustrate the interaction networks of protein complexes. The STRING (Search Tool for the Retrieval of Interacting Genes, version 3.2.0, https://string-db.org/) online tool was utilized to construct PPI network of the above overlapping genes. An interaction score of PPI pairs ≥0.15 was considered statistically significant. Thereinto, the significant gene module was visualized by the MCODE (Molecular Complex Detection, Version 1.4.2, http://apps.cytoscape.org/apps/MCODE) [Citation22] plug-in of Cytoscape software with MCODE scores ≥5 as a selection criterion.
Validation of the hub genes and survival analysis
Based on the transcriptome profiling of BLCA from TCGA database, the expression levels of the genes in the hub module were validated by the GEPIA website (Gene Expression Profiling Interactive Analysis, http://gepia.cancer-pku.cn/). In addition, the BLCA patients were divided into a low-expression group and a high-expression group based on the median of the gene expression. The corresponding survival analysis of the genes was also processed by the GEPIA website.
Drug–gene interaction
The genes in the hub module were analyzed by the DGIdb (Drug–Gene Interaction database, version 2.0, http://www.dgidb.org/) to identify the interaction between drug and gene. The drugs approved by the FDA (Food and Drug Administration) were chosen as the potential drugs. The drug–gene interaction network was visualized by the Cytoscape software.
Results and discussion
Analysis of mutation genes in BLCA
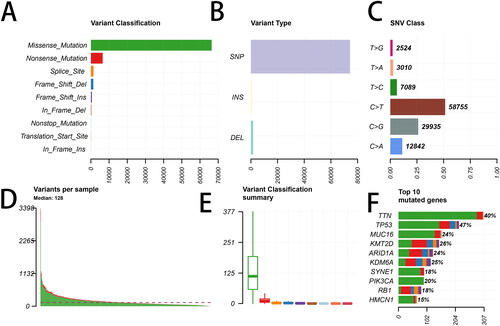
After the mutated genes in the SNP data were identified by the Maftools package, the obtained mutations were classified based on different protein-coding situations, among which missense-mutations had the largest fraction (). indicated that the most frequently occurring variation type was SNP compared with deletion (DEL) or insertion (INS). In addition, the most common SNV (single nucleotide variants) was C > T in BLCA (). In each sample, the altered base number of different mutation types was shown in . In each mutation type, the number of the altered bases in different samples was listed in . Next, the top 10 mutated genes, including TTN, TP53, MUC16, KMT2D, ARID1A, KDM6A, SYNE1, PIK3CA, RB1 and HMCN1, are shown in .
Figure 1. Summary of the mutation information with statistical analysis. (A, B, C) Classification of mutation types based on different categories. (D, E) Tumor mutation number in specific samples. (F) The top 10 mutated genes in bladder cancer (BLCA). SNP, single nucleotide polymorphism; SNV, single nucleotide variants.
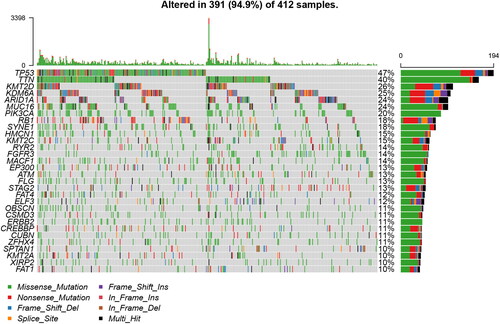
Furthermore, we obtained 197 mutated genes with more than 5% of mutation frequency. Besides, 34 mutated genes with more than 10% of mutation frequency were chosen to draw a waterfall plot ().
Figure 2. Landscape of mutation profiles in bladder cancer (BLCA) samples. A total of 34 genes with more than 10% of mutation frequency were chosen in the waterfall plot. Various colors of the waterfall plot with annotations at the bottom represent different mutation types. The barplot above the legend shows the mutation number.
Identification of DEGs and overlapping of DEGs with mutated genes
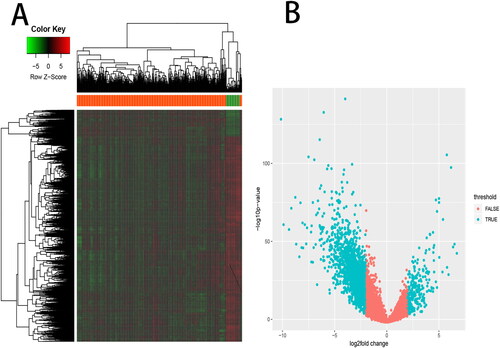
After the differential expression analysis, a total of 3180 DEGs were obtained between BLCA and normal bladder tissues, including 579 up-regulated DEGs and 2601 down-regulated DEGs. The expression of DEGs was shown in a heatmap and a volcano map (), and their information is listed in Supplemental Table S1.
Figure 3. Differentially expressed genes analysis. A total of 3180 differentially expressed genes (DEGs) between BLCA and normal bladder tissues, including 579 up-regulated DEGs and 2601 down-regulated DEGs, were listed in (A) a heat map and (B) a volcano map.
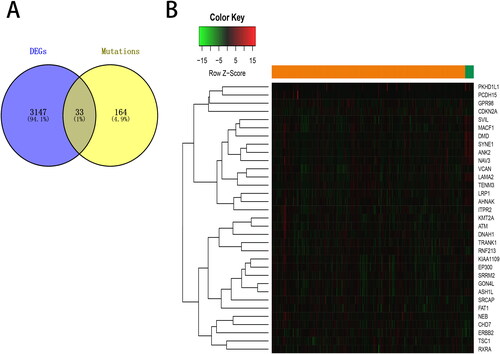
Next, the overlapping genes between DEGs and genes with more than 5% of mutation frequency was analyzed using Venn diagram tool. We obtained 33 overlapping genes for further analysis ().
Figure 4. Overlapping of differentially expressed genes (DEGs) with mutated genes. (A) Venn diagram represents the overlapping genes between DEGs and genes with more than 5% of mutation frequency. (B) The expression of the overlapping genes was shown in a heat map.
Functional enrichment analysis
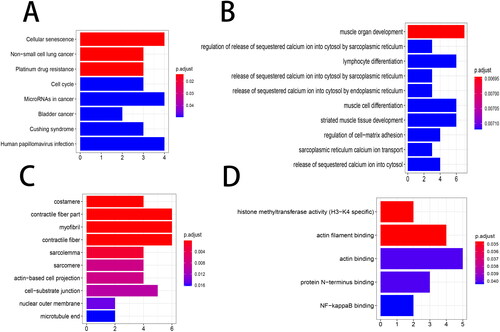
The GO and KEGG pathway analysis of the overlapping genes indicated that 8 KEGG pathways were enriched, including cellular senescence, non-small cell lung cancer, platinum drug resistance, cell cycle, microRNAs in cancer, bladder cancer, Cushing syndrome, and human papillomavirus infection (). The results obtained 108 significant BP terms (e.g. muscle organ development, regulation of release of sequestered calcium ion into cytosol by sarcoplasmic reticulum, and lymphocyte differentiation), 23 significant CC terms (e.g. costamere, contractile fiber part, and myofibril), and five significant MF terms (e.g. histone methyltransferase activity (H3-K4 specific), actin filament binding, and actin binding), and the top 10 significant items in BP and CC as well as five significant MF items are shown in .
Figure 5. Functional enrichment analysis. The top 10 items of the KEGG pathway and GO enrichment analyses are shown in the form of a bubble plot using the clusterProfiler package. p < 0.05 was considered statistically significant. (A) KEGG; (B) BP, biological process; (C) CC, cellular components; (D) MF, molecular function. GO, Gene Ontology; KEGG, Kyoto Encyclopedia of Genes and Genomes.
PPI network construction and module analysis
PPI network was applied to illustrate the protein interaction of the overlapping genes by using the STRING online tool, containing 33 nodes and 153 edges (). Moreover, the MCODE was used to visualize the significant gene module, which contained 12 nodes and 34 edges (). The hub genes in the module consisted of SYNE1, DMD, ATM, EP300, ANK2, LAMA2, FAT1, SRRM2, MACF1, TSC1, VCAN and RXRA (). Among them, SYNE1 was closely associated with other node proteins (degree = 19), and had the highest mutation percent.
Figure 6. PPI network construction and module analysis. (A) PPI network of the overlapping genes was constructed by the STRING (Search Tool for the Retrieval of Interacting Genes) online tool. (B) The significant gene module was visualized by the MCODE (Molecular Complex Detection, Version 1.4.2) plug-in of Cytoscape software. The circle node represents the down-regulated genes and the diamond node represents the up-regulated genes. The size of node is positively correlated with the degree value and the color depth is positively correlated with Mutation percent.
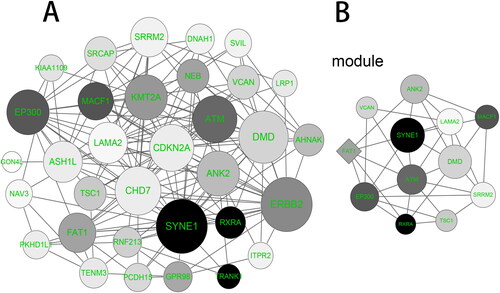
Table 1. Hub genes in the PPI network module.
Hub gene expression and survival analysis
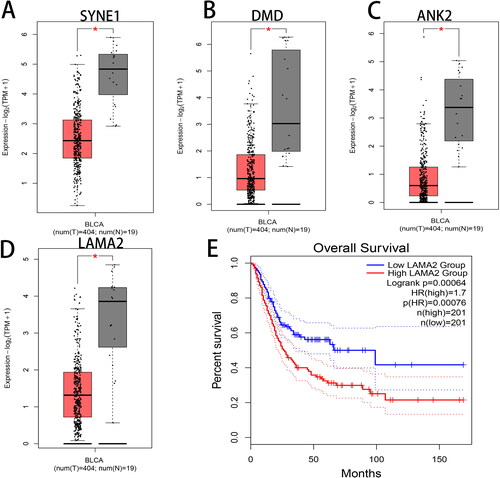
The expression and survival analysis of the above hub genes were validated by the GEPIA website using the data and clinical information of BLCA from TCGA database. The results confirmed that SYNE1, DMD, ANK2 and LAMA2 were down-regulated in BLCA tissues compared with normal control tissues (). Additionally, BLCA patients with low expression of LAMA2 showed a relatively high survival rate as compared to the patients with high expression of LAMA2 (). The down-regulated expression of LAMA2 in BLCA seems to contradict the worse prognosis of patients with high expression of LAMA2, and therefore we speculated that LAMA2 might combine other factors to affect the overall survival of BLCA.
Figure 7. Hub gene expression and survival analysis. The expression of (A) SYNE1, (B) DMD, (C) ANK2 and (D) LAMA2 as well as (E) the survival analysis of LAMA2 were analyzed by the GEPIA website. Red boxplot represents BLCA tumor tissues and gray boxplot represents normal tissues.
Drug–gene interaction
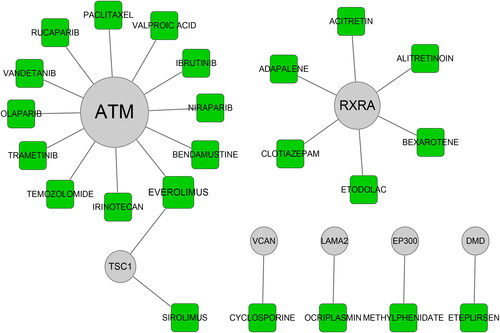
The above hub genes (SYNE1, DMD, ATM, EP300, ANK2, LAMA2, FAT1, SRRM2, MACF1, TSC1, VCAN and RXRA) were submitted to the DGIdb to identify the interaction between drugs and genes. The results indicated that ATM, RXRA, TSC1, DMD, EP300, LAMA2 and VCAN had the potential to be considered as the drug targets (). Moreover, there were 23 types of drugs in the drug-gene interaction such as EVEROLIMUS, ETEPLIRSEN, IRINOTECAN, RUCAPARIB and PACLITAXEL ().
Figure 8. Drug–gene interaction. The potential targeting relationship between candidate drugs and hub genes.
Comparative analysis
BLCA patients are frequently diagnosed at the advanced stage due to lack of effective screening methods [Citation4–6]. Despite the development of therapies, the patients still have a poor prognosis [Citation7,Citation8]. A comprehensive understanding of the molecular pathogenesis of BLCA is essential for finding new insights in the diagnosis and treatment of BLCA. Since SNPs play an important role in tumorigenesis and tumor development [Citation10], identification of SNPs is a good direction for providing potential biomarkers for the diagnosis and treatment of BLCA [Citation16]. Thus, we attempted to identify potential biomarkers related to SNPs using bioinformatics methods based on TCGA database.
In the present study, we first downloaded SNP data of BLCA from the TCGA database and identified high frequency mutation genes using Maftools package. Then, the mRNA expression data from TCGA database were processed to obtain DEGs between BLCA and normal bladder tissues by the Limma package. Next, Venn diagram tool was used to identify the overlapping genes between DEGs and high frequency mutation genes. The overlapping genes suggested that SNPs in 33 genes were related to their expression at the transcription level. Subsequently, these overlapping mutant genes were analyzed by GO and KEGG pathway enrichment analysis. These genes were enriched in eight KEGG pathways, including Cellular senescence, Non-small cell lung cancer, platinum drug resistance, cell cycle, microRNAs in cancer, bladder cancer, Cushing syndrome, and human papillomavirus infection. For example, cellular senescence is a state of irreversible cellular proliferation arrest in response to different stresses [Citation23]. The key proteins (e.g. p16Ink4a/retinoblastoma and p53/p21) in the senescence pathway play critical roles in senescent-associated processes and cell-cycle arrest [Citation24]. Thus, the overlapping mutant genes can mediate various pathways to regulate the progression of BLCA. In addition, the genes are also enriched in BP (e.g. muscle organ development and lymphocyte differentiation), CC (e.g. costamere, contractile fiber part and myofibril), and MF (e.g. actin filament binding and actin binding) items of GO. BLCA is often classified as non-muscle-invasive bladder cancer and muscle-invasive BLCA [Citation7], which indicates that the muscle organ development of BP is important for the development of BLCA. Costameres are critical for the myofibril’s cytoskeletal anchor as well as mechano-regulated signaling [Citation25]. Actin-binding proteins are closely related to tumor metastasis [Citation26]. Hence, the overlapping mutant genes can be involved in different cellular processes, functions and molecules of BLCA.
To further explore the potential roles of the overlapping mutant genes, the protein interaction of the genes was established by PPI network analysis, and then the hub genes were selected to construct the significant gene module by MCODE. The hub genes contain SYNE1, DMD, ATM, EP300, ANK2, LAMA2, FAT1, SRRM2, MACF1, TSC1, VCAN and RXRA. Then, the GEPIA website was used to confirm the down-regulated expression of SYNE1, DMD, ANK2, LAMA2 in BLCA. Moreover, BLCA patients with low expression of LAMA2 showed a relatively high survival rate compared to patients with high expression of LAMA2. The down-regulated expression of LAMA2 in BLCA seems to contradict the worse prognosis of patients with high expression of LAMA2. Therefore, we speculated that LAMA2 might combine other factors to affect the overall survival of BLCA, which is one of our future research directions. Previous reports have also indicated that SYNE1, ATM, EP300, FAT1, MACF1, TSC1, VCAN and RXRA mutations occur in BLCA [Citation27–34]. SYNE1 mutations have been reported to be implicated in motor neuron disease and muscular disorder [Citation35]. Mutated ATM gene in cancer may lead to poor prognosis and chemotherapy resistance [Citation36]. EP300 mutation in BLCA contributes to antitumor immunity [Citation29]. FAT1 mutations suppress the growth and metastasis of diverse tumor cells [Citation37,Citation38]. Mutation in MACF1 can lead to myopathy genetic disease and its dysregulation is associated with cancer, schizophrenia and osteoporosis [Citation39]. TSC1 mutations can regulate mTOR signaling pathway to be involved in diverse cancers [Citation40,Citation41]. VCAN has been shown to be a potential prognostic biomarker in cancers [Citation33,Citation42]. Mutant RXRA in BLCA is found to stimulate urothelial proliferation [Citation34]. This study for the first time identified DMD, ANK2, LAMA2 and SRRM2 mutations in BLCA. DMD in human genome is the largest genetic locus [Citation43], and its deletions characterize meningiomas patients with poor outcome [Citation44]. ANK2 variant is mainly related to arrhythmia phenotypes [Citation45]. LAMA2 is linked with muscular dystrophy [Citation46]. SRRM2 is associated with Parkinson's disease and papillary thyroid carcinoma [Citation47,Citation48]. However, the specific roles and mechanisms of these hub genes in BLCA are not well illustrated, and therefore this is a good research direction for studying the pathogenesis of BLCA.
To investigate the interaction between drugs and hub genes, DGIdb was utilized to identify the potential drug targets, including ATM, RXRA, TSC1, DMD, EP300, LAMA2 and VCAN. It is reported that ATM mutations in BLCA have the potential to respond to platinum-based chemotherapies [Citation28,Citation36]. In addition, 23 drugs were chosen as potential candidates, such as EVEROLIMUS, ETEPLIRSEN, and ACITRETIN. EVEROLIMUS as an oral mTOR-inhibitor has widely applied in various cancers such as BLCA [Citation49]. ETEPLIRSEN can restore DMD’s translational reading frame to promote dystrophin production, which can be used for the treatment of Duchenne muscular dystrophy [Citation50]. ACITRETIN is known as a drug for severe psoriasis treatment [Citation51]. The targeting relationship of hub genes and drugs will provide the appropriate therapeutic methods for BLCA patients. Our work has some limitations. Particularly, we did not stratify the SNP to the subtypes of BLCA, and yet this is one of our research directions in the future.
Conclusions
Our study respectively identified the mutant genes and DEGs in BLCA and obtained the overlapping genes of mutant genes with DEGs. The overlapping genes indicated that SNPs in 33 genes were associated with their expression at the transcription level. In addition, the overlapping genes were enriched in multiple KEGG pathways and GO items to affect the progression of BLCA. Moreover, PPI network construction found that 12 hub genes (SYNE1, DMD, ATM, EP300, ANK2, LAMA2, FAT1, SRRM2, MACF1, TSC1, VCAN and RXRA) showed an obvious interaction. Furthermore, ATM, RXRA, TSC1, DMD, EP300, LAMA2 and VCAN could be considered as the drug targets. These findings provide important bioinformatics and theoretical basis for understanding the pathogenesis of BLCA and exploring the detailed mechanisms of mutant genes in the disease.
Authors’ contributions
Tengyun Long and Xiaoni Li designed the study, supervised the data collection, analyzed the data, Guofei Zhang and Chunming Qiu interpreted the data and prepared the manuscript for publication, Ouyang Huang, Canbiao Sun and Yong Yang supervised the data collection, analyzed the data and reviewed the draft of the manuscript. All authors have read and approved the manuscript.
Supplemental Material
Download MS Word (115.6 KB)Disclosure statement
The authors state that there are no conflicts of interest to disclose.
Data availability statement
The data support the findings of this study are available on reasonable request from the corresponding author.
References
- Bray F, Ferlay J, Soerjomataram I, et al. Global cancer statistics 2018: GLOBOCAN estimates of incidence and mortality worldwide for 36 cancers in 185 countries. CA Cancer J Clin. 2018;68(6):394–424.
- Siegel RL, Miller KD, Jemal A. Cancer statistics, 2019. CA Cancer J Clin. 2019;69(1):7–34.
- Janisch F, Shariat SF, Schernhammer E, et al. The interaction of gender and smoking on bladder cancer risks. Curr Opin Urol. 2019;29(3):249–255.
- Sanli O, Dobruch J, Knowles MA, et al. Bladder cancer. Nat Rev Dis Primers. 2017;3:17022.
- Qi N, Zhang J, Chen Y, et al. Microscopic hematuria predicts lower stage in patients with upper tract urothelial carcinoma. Cancer Manag Res. 2018;10:4929–4933.
- Khochikar MV. Rationale for an early detection program for bladder cancer. Indian J Urol. 2011;27(2):218–225.
- Kamat AM, Hahn NM, Efstathiou JA, et al. Bladder cancer. Lancet. 2016;388(10061):2796–2810.
- Berdik C. Unlocking bladder cancer. Nature. 2017;551(7679):S34–S35.
- Matsuda K. PCR-based detection methods for single-nucleotide polymorphism or mutation: real-time PCR and its substantial contribution toward technological refinement. Adv Clin Chem. 2017;80:45–72.
- Srinivasan S, Clements JA, Batra J. Single nucleotide polymorphisms in clinics: fantasy or reality for cancer? Crit Rev Clin Lab Sci. 2016;53(1):29–39.
- Gao C, Zhuang J, Zhou C, et al. SNP mutation-related genes in breast cancer for monitoring and prognosis of patients: a study based on the TCGA database. Cancer Med. 2019;8(5):2303–2312.
- Liu C, Fang J, Liu W. Superoxide dismutase coding of gene polymorphisms associated with susceptibility to Parkinson's disease. J Integr Neurosci. 2019;18(3):299–303.
- Wang CC, Huang CY, Jhuang YL, et al. Biological significance of TERT promoter mutation in papillary urothelial neoplasm of low malignant potential. Histopathology. 2018;72(5):795–803.
- Robertson AG, Kim J, Al-Ahmadie H, TCGA Research Network, et al. Comprehensive molecular characterization of muscle-invasive bladder cancer. Cell. 2017;171(3):540–556.e25.
- Andrew AS, Gui J, Sanderson AC, et al. Bladder cancer SNP panel predicts susceptibility and survival. Hum Genet. 2009;125(5–6):527–539.
- Li-Sheng CS, Ching-Yuan FJ, Sipeky C, et al. Risk prediction of prostate cancer with single nucleotide polymorphisms and prostate specific antigen. J Urol. 2019;201(3):486–495.
- Inamura K. Bladder cancer: new insights into its molecular pathology. Cancers (Basel). 2018;10(4):100.
- Kamps R, Brandão RD, Bosch BJ, et al. Next-generation sequencing in oncology: genetic diagnosis, risk prediction and cancer classification. Int J Mol Sci. 2017;18(2):308.
- Han S, Kim D, Kim Y, et al. CAS-viewer: web-based tool for splicing-guided integrative analysis of multi-omics cancer data. BMC Med Genomics. 2018;11(Suppl 2):25.
- Mayakonda A, Lin DC, Assenov Y, et al. Maftools: efficient and comprehensive analysis of somatic variants in cancer. Genome Res. 2018;28(11):1747–1756.
- Yu G, Wang LG, Han Y, et al. clusterProfiler: an R package for comparing biological themes among gene clusters. OMICS. 2012;16(5):284–287.
- Bandettini WP, Kellman P, Mancini C, et al. Multicontrast delayed enhancement (MCODE) improves detection of subendocardial myocardial infarction by late gadolinium enhancement cardiovascular magnetic resonance: a clinical validation study. J Cardiovasc Magn Reson. 2012;14(1):83.
- McCulloch K, Litherland GJ, Rai TS. Cellular senescence in osteoarthritis pathology. Aging Cell. 2017;16(2):210–218.
- Regulski MJ. Cellular senescence: what, why, and how. Wounds. 2017;29(6):168–174.
- Li R, Narici MV, Erskine RM, et al. Costamere remodeling with muscle loading and unloading in healthy young men. J Anat. 2013;223(5):525–536.
- Meng T, Liu L, Hao R, et al. Transgelin-2: a potential oncogenic factor. Tumour Biol. 2017;39(6):1010428317702650.
- Nickerson ML, Witte N, Im KM, et al. Molecular analysis of urothelial cancer cell lines for modeling tumor biology and drug response. Oncogene. 2017;36(1):35–46.
- Felsenstein KM, Theodorescu D. Precision medicine for urothelial bladder cancer: update on tumour genomics and immunotherapy. Nat Rev Urol. 2018;15(2):92–111.
- Zhu G, Pei L, Li Y, et al. EP300 mutation is associated with tumor mutation burden and promotes antitumor immunity in bladder cancer patients. Aging (Albany NY). 2020;12(3):2132–2141.
- Heide T, Maurer A, Eipel M, et al. Multiregion human bladder cancer sequencing reveals tumour evolution, bladder cancer phenotypes and implications for targeted therapy. J Pathol. 2019;248(2):230–242.
- Chen S, Zhang N, Shao J, et al. A novel gene signature combination improves the prediction of overall survival in urinary bladder cancer. J Cancer. 2019;10(23):5744–5753.
- Zhang X, Zhang Y. Bladder cancer and genetic mutations. Cell Biochem Biophys. 2015;73(1):65–69.
- Luo Y, Zeng G, Wu S. Identification of microenvironment-related prognostic genes in bladder cancer based on gene expression profile. Front Genet. 2019;10:1187.
- Halstead AM, Kapadia CD, Bolzenius J, et al. Bladder-cancer-associated mutations in RXRA activate peroxisome proliferator-activated receptors to drive urothelial proliferation. Elife. 2017;6:e30862.
- Indelicato E, Nachbauer W, Fauth C, et al. SYNE1-ataxia: novel genotypic and phenotypic findings. Parkinsonism Relat Disord. 2019;62:210–214.
- Choi M, Kipps T, Kurzrock R. ATM mutations in cancer: therapeutic implications. Mol Cancer Ther. 2016;15(8):1781–1791.
- Chen M, Sun X, Wang Y, et al. FAT1 inhibits the proliferation and metastasis of cervical cancer cells by binding β-catenin. Int J Clin Exp Pathol. 2019;12(10):3807–3818.
- Lin SC, Lin LH, Yu SY, et al. FAT1 somatic mutations in head and neck carcinoma are associated with tumor progression and survival. Carcinogenesis. 2018;39(11):1320–1330.
- Hu L, Xiao Y, Xiong Z, et al. MACF1, versatility in tissue-specific function and in human disease. Semin Cell Dev Biol. 2017;69:3–8.
- Ho DWH, Chan LK, Chiu YT, et al. TSC1/2 mutations define a molecular subset of HCC with aggressive behaviour and treatment implication. Gut. 2017;66(8):1496–1506.
- Wang Y, Zhang X, Tang W, et al. miR-130a upregulates mTOR pathway by targeting TSC1 and is transactivated by NF-κB in high-grade serous ovarian carcinoma. Cell Death Differ. 2017;24(12):2089–2100.
- Jiang K, Liu H, Xie D, et al. Differentially expressed genes ASPN, COL1A1, FN1, VCAN and MUC5AC are potential prognostic biomarkers for gastric cancer. Oncol Lett. 2019;17(3):3191–3202.
- Maggio I, Chen X, Gonçalves MA. The emerging role of viral vectors as vehicles for DMD gene editing. Genome Med. 2016;8(1):59.
- Juratli TA, McCabe D, Nayyar N, et al. DMD genomic deletions characterize a subset of progressive/higher-grade meningiomas with poor outcome. Acta Neuropathol. 2018;136(5):779–792.
- Musa H, Murphy NP, Curran J, et al. Common human ANK2 variant confers in vivo arrhythmia phenotypes. Heart Rhythm. 2016;13(9):1932–1940.
- Hashemi-Gorji F, Yassaee VR, Dashti P, et al. Novel LAMA2 gene mutations associated with merosin-deficient congenital muscular dystrophy. Iran Biomed J. 2018;22(6):408–414.
- Shehadeh LA, Yu K, Wang L, et al. SRRM2, a potential blood biomarker revealing high alternative splicing in Parkinson's disease. PLoS One. 2010;5(2):e9104.
- Tomsic J, He H, Akagi K, et al. A germline mutation in SRRM2, a splicing factor gene, is implicated in papillary thyroid carcinoma predisposition. Sci Rep. 2015;5:10566.
- Bachir BG, Souhami L, Mansure JJ, et al. Phase I clinical trial of everolimus combined with trimodality therapy in patients with muscle-invasive bladder cancer. Bladder Cancer. 2017;3(2):105–112.
- Lim KR, Maruyama R, Yokota T. Eteplirsen in the treatment of Duchenne muscular dystrophy. Drug Des Devel Ther. 2017;11:533–545.
- Guenther LC, Kunynetz R, Lynde CW, et al. Acitretin use in dermatology. J Cutan Med Surg. 2017;21(3_suppl):2S–12S.