
Abstract
Gastric cancer (GC) is the fifth most commonly diagnosed cancer and the third leading cause of cancer-related death in the world. Microbiota is believed to be associated with GC. Growing evidences showed Helicobacter pylori played a key role in GC development. However, little was known about the microbiota in gastric juices and tissues in GC patients, and thus it was difficult to understand other potential microbial causation for GC. Here, we collected the gastric juice and surgically removed gastric tissues from GC patients to give insight into GC microbiota. Most microbes identified in the gastric samples were opportunistic pathogens or resident flora of the human microbiota. Further network analyses identified five opportunistic pathogens as keystone species. H. pylori is the direct cause of GC, but other opportunistic microbes might also function in GC development. The microbiota in the gastric juice and gastric tissue of the GC patients were complex, and some dominant opportunistic pathogens contributed to the GC development. This study introduces microbiota in gastric juice, gastric normal tissue and gastric cancer tissue of GC patients, and highlights the potential keystone microbes functioned during GC development.
Introduction
Gastric cancer (GC) is the fifth most commonly diagnosed cancer and the third leading cause of cancer-related death in the world, with more than 1,000,000 new cases in 2018 and about 783,000 deaths [Citation1]. Gastric microbiota is believed to contribute to the GC development [Citation2,Citation3]. Previous studies suggested that Helicobacter pylori was the cause of chronic gastritis and gastric ulcers [Citation4], and it was postulated that H. pylori participated in GC development [Citation4–8]. More than 50% of the world’s population is estimated to be infected with H. pylori in the gastric juice, and only 1%–3% of H. pylori-infected persons would develop GC [Citation5,Citation8]. H. pylori were classified as a class I carcinogen in 1994 by World Health Organization [Citation9]. However, effective H. pylori treatment cannot prevent GC development in the patients [Citation10]. Besides, growing evidences proposed that microbes other than H. pylori might contribute to GC development [Citation3,Citation11].
With the development of next-generation sequencing technology, sequencing the microbiota of human tissues and mucosa has become a cost-effective analysis, and a huge amount of human microbiome data have been reported, including some reports about human stomach microbiota [Citation12–14]. Based on previous reports, the main bacteria in H. pylori-negative individuals were Proteobacteria, Bacterioidetes, Firmicutes, Actinobacteria and Fusobacteria [Citation15,Citation16]. Meanwhile, the most dominant bacterium in H. pylori-positive individuals was H. pylori, which can account for more than 70% of the gastric microbiota in some individuals [Citation5]. In addition, H. pylori was the dominant bacterial species in the normal and carcinoma tissues of patients distributed in Mexico and China [Citation17]. However, the Chinese gastric samples were collected in Shanxi province between 1998 and 2001 [Citation17].
In H. pylori-infected persons, high H. pylori composition resulted in the reduction of gastric acid secretion and increased colonization of other bacteria in the stomach, which in turn lower the abundance of H. pylori [Citation18,Citation19]. With the colonization of other bacteria in the stomach, the relative abundance of H. pylori in the stomach decreased [Citation19]. The investigation of microbiota showed that H. pylori were the dominant bacteria (41.7% of the microbiota) in chronic gastritis patients; however, only 5.9% in gastric carcinoma patients was H. pylori [Citation19]. Furthermore, the microbiota in GC patients harboured a high level of oral and intestinal commensals [Citation2,Citation20]. In another study, the second most abundant group of bacteria in gastric tissues of GC patients were oral-associated [Citation17]. Until now, the keystone bacterial taxa associated with GC other than H. pylori are still unknown [Citation21]. Therefore, investigation of the microbiota associated with GC and identification of the keystone taxa during GC development are clearly needed.
In this study, to give insight into the microbiota of GC patients, different gastric samples (gastric juice [GJ], gastric normal tissues [GNT], gastric cancer tissues [GCT]) were collected in the year 2018, in Henan Province, China. The microbial profiles of these samples were analysed to characterize the microbiota in the patients. Co-occurrence analysis was used to reveal the potential keystone GC-associated bacteria. Moreover, the potential pathogenic microbes for GC were discussed.
Subjects and methods
Ethics statement
This study was approved by the institutional review boards of the First Affiliated Hospital and the institutional review boards of the School of Pharmaceutical Sciences, Zhengzhou University. All patients provided written informed consent before the study. Details have been removed from the case descriptions to ensure anonymity.
Sample collection
A total of 18 samples designated Ga-1 to Ga-18 were collected from 10 patients at the first affiliated hospital of Zhengzhou University, Henan Province, China, in 2018 (Supplementary Tables S1 and S2).
These 18 samples include GJ, surgically removed GNT and surgically removed GCT collected from patients (Supplementary Table S2). Among the 10 patients, nine had GC, and one showed gastric intraepithelial neoplasia. In some cases, more than one sample was collected from a patient; for example, Ga-01 (GCT), Ga-07 (GJ) and Ga-14 (GNT) were all collected from Patient P01.
The GJ samples were collected in sterile 5 mL Eppendorf tubes during surgery. The surgically removed GNT and GCT samples were collected after surgery and washed with sterile water to remove surface microbes. The GC, GNT and GCT samples were sent to the laboratory immediately and stored at −80 °C before DNA extraction.
DNA extraction and 16S rDNA gene fragment amplification
The DNA was extracted from 100 mg samples of GJ, and gastric tissue from the normal and tumour sites using DNeasy PowerSoil Kit (Qiagen, Germany). The DNA concentration was measured with Nanodrop 2000 (Thermo scientific). The DNA was diluted to the proper concentration for further 16S rRNA gene fragments (V3-V4) amplification [Citation22]. The polymerase used for 16S rRNA gene amplification was HiFi HotStart ReadyMix (KAPA, Roche Sequencing) following the manufacturer’s procedure. The sequencing was performed by Oebiotech (Shanghai, China).
16s rRNA gene fragment analysis
The obtained fastq files were processed using USEARCH with default parameters [Citation22,Citation23]. The processed reads were clustered into operational taxonomic units (OTUs) based on 97% identity using USEARCH UPARSE, and the chimeric reads were discarded during the UPARSE analysis pipeline [Citation24]. The phylogenetic analyses of the obtained 16S rRNA gene sequences were processed with USEARCH, and RDP training set (version v16) was used as the reference with the confidence threshold of 0.8 [Citation25]. The alpha and beta diversity of the samples were obtained with USEARCH. The unweighted pair-group method with arithmetic means (UPGMA) was analysed by UPGMA cluster method in R software. The principal coordinate analysis (PCoA) and non-metric multidimensional scaling (NMDS) were manipulated using R software.
The data were deposited in Genbank database with the accession numbers of SRR8901324-SRR8901341.
Network analyses of the OTUs in the gastric microbiota
The co-occurrence network was used to explore co-occurrence of top 52 dominant bacteria species in patients. The correlation between different OTUs was calculated with spearman’s method with pairwise distance. The selection standard for OTU co-occurring relationship analysis was r > 0.6 and p < 0.05 [Citation26]. Other co-occurrence parameters were calculated based on the R igraph manuals.
Results
Microbial profile and OTU distribution in the samples
The 18 samples collected from the surgically removed gastric tissues and GJ were divided into three groups (GJ, GNT, GCT). The sequence reads of these 18 samples are classified into OTUs based on 97% identity [Citation27]. The OTU numbers (richness) of the 18 samples were 167-1122 (), and the average OTU number of these samples was 484 ± 286 (Supplementary Table S2). The OTU numbers between each two of the three groups showed no significant differences. The average OTU numbers of the GCT samples were higher than those of the GJ and GNT samples (). Especially, the average OTU number in the GJ group was 53.4% to the average OTU number of the samples in the GCT group (). The OTU numbers of each sample were nearly the same with Chao1 number, and the Good’s coverage of these 18 samples was more than 99.3% (Supplementary Table S2). The Shannon_2, simpson, dominance and equitability parameters of these 18 samples were different among the samples and groups, and the difference between each pair of groups was not significant (Supplementary Table S2). Additionally, the microbial diversity of the GCT samples was higher than that of the GJ and GNT samples ().
Table 1. Alpha diversity parameters of the three groups of GJ, GNT and GCT.
Microbial distribution at phylum level and genus level
At the phylum level, the most dominant phyla in the 18 samples were Proteobacteria, Firmicutes, Bacteroidetes, Actinobacteria and Fusobacteria ( and Supplementary Figure S1). For the three classified sample groups, the most dominant phylum in the GJ and GNT groups was Proteobacteria. Proteobacteria accounted for 36.8% ± 15.7% and 36.5% ± 6.0% of the microorganisms in the GJ and GNT groups, respectively (). The most dominant phylum in the GCT group was Firmicutes, which accounted for 39.8% ± 16.8% of the microorganisms ().
Figure 1. UPGMA phylogenetic tree based on weighted unifrac distance combined with phylum-level species distribution.
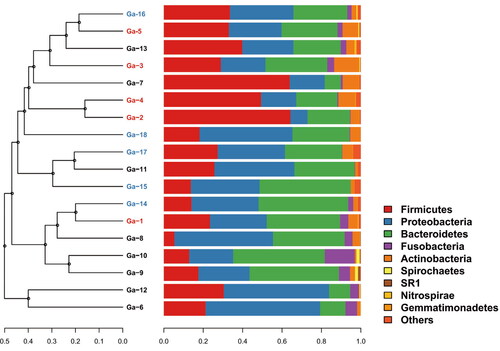
Table 2. Microbial distribution of the three groups of GJ, GNT and GCT.
At the genus level, the most dominant genera in each group were different (). The common dominant genera in these three groups were Prevotella, Bacteroides, Escherichia_Shigella, Lactobacillus, Helicobacter and Neisseria. The most dominant genera in the GNT group were Bacteroides (9.8% ± 9.7%), Escherichia_Shigella (9.4% ± 13.8%), Lactobacillus (7.7% ± 7.9%) and Prevotella (6.2% ± 4.2%). The most dominant genera in the GJ group were Prevotella (12.8% ± 9.8%), Helicobacter (9.1% ± 16.44%), Bacillus (7.9% ± 14.7%) and Streptococcus (7.8% ± 9.2%). The most dominant genera in the GCT group were Prevotella (10.5% ± 9.1%), Bacteroides (7.1% ± 4%), Streptococcus (5.7% ± 6.3%), Neisseria (5.5% ± 6.3%) and Blautia (5.1% ± 6.6%). The Helicobacter comprised 3.5% ± 5.5% and 1.9% ± 3.5% of the microbiota in the GNT and GCT group, respectively (Supplementary Table S3). Although the microbial composition of each group was different, there was no significant difference between each two groups based on t-test (Supplementary Table S3).
Dominant OTUs in the samples
Most dominant OTUs in these three groups had more than 97% identity with their closest known isolates. Most of these closest known isolates to the OTUs were isolated from the gastric microbiota. The most dominant OTU, OTU_1, was identified as H. pylori based on its 100% identity with the type H. pylori strain (). H. pylori accounted for an average of 5.3% of the microbial relative abundance in the 18 samples. No H. pylori were available in sample Ga-10, and H. pylori represented 48.21% of the microbial relative abundance in sample Ga-6. Most of the other dominant OTUs were common non-pathogenic inhabitants or opportunistic pathogens in the human microbiome (). Among them, OTU_2 might be an opportunistic pathogen, Escherichia fergusonii [Citation28]; OTU_8 was predicted to be Neisseria subflava, which is an opportunistic pathogen in the upper respiratory tract [Citation29]; OTU_3 might be Streptococcus dentisani, which is believed to be a health-associated inhabitant in the oral cavity [Citation30]; OTU_4 might be an environmental microbe, and it can promote plant growth [Citation31,Citation32]. In summary, most of the dominant OTUs were predicted to be available in the human upper gastrointestinal tract ().
Table 3. Distribution of the top 20 most dominant OTUs in the 18 samples and their closest cultured bacteria.
Group analyses of the gastric samples
The PCoA and NMDS analyses showed that the microbial composition of the samples from GJ, GNT and GCT groups overlapped with each other (Supplementary Figure S2). Further, UPGMA analysis showed that some samples from different groups had similar microbial profiles (). Ga-5, Ga-16, Ga-13, Ga-3 and Ga-7 were from GCT, GNT and GJ groups, but they were clustered together in the UPGMA tree (). Ga-12 and Ga-6 were GJ samples, and they were different from other GJ samples in terms of microbial composition. Ga-5, 18, and 13 were the tissue samples and juice samples from patient P05, and they clustered together in the UPGMA tree. Ga-01 and Ga-14 were the tissue samples from patient P01, whereas Ga-7 was the GJ sample from the same patient. Ga-1 and Ga-14 were clustered together, but they were not clustered with Ga-7. Ga-3 and Ga-16 were the tissue samples from patient P03, whereas Ga-8 was the GJ sample from the same patient. Similarly, Ga-3 and Ga-16 were clustered together, but they were not clustered with Ga-8.
Network analyses of the gastric samples
The microbial network of these gastric samples was analysed based on the co-occurrence of the dominant microbes, which could predict the keystone taxa information in the microbial communities [Citation33]. The obtained microbial network consisted of 52 nodes (top 52 OTUs) and 375 edges (Supplementary Table S4). Among the 375 edges, 302 edges indicated a positive correlation between the nodes, and 73 edges indicated a negative correlation (). The mean edge per node was 7.2, and the average path length was 2.1 edges with a diameter of 5 edges. The clustering coefficient of the network was 0.72. The connectance (the real correlation/all the potential correlation) of the network was 0.28, which shows that the microbial network in the gastric samples was comprised of highly connected (positive or negative) species.
Figure 2. Network of co-occurring OTUs based on correlation analysis.
Note: The selection standards for strong and significant correlation are Spearman’s r > 0.6 and p < 0.05, respectively. The size of each node is proportional to the relative abundance; the colour and thickness of each connection between two nodes (edge) is proportional to the value of Spearman’s correlation coefficients. Blue lines show negative correlation between two nodes; red lines show positive correlation between two nodes.
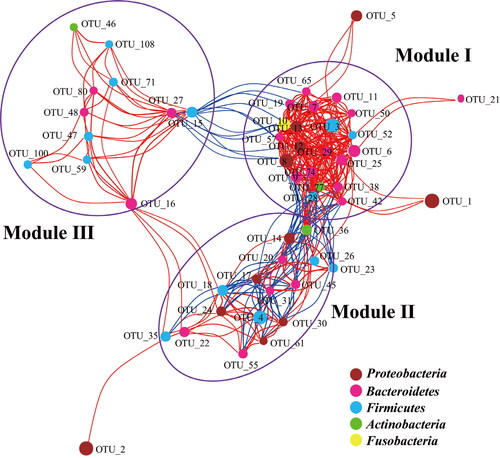
The nodes in the network were assigned to five different phyla: Proteobacteria, Firmicutes, Bacteroidetes, Actinobacteria and Fusobacteria. Only one node of OTU_10 belonged to Fusobacteria, which was predicted to be Fusobacterium nucleatum [Citation34]. These five phyla were also the dominant phyla in the analysed gastric samples. The network could be classified into three main modules (). Of the three modules, Module I had the highest numbers of nodes and the richest connections. The nodes in Module I mostly belonged to Bacteroidetes, Firmicutes and Proteobacteria. The nodes in Module II mostly belonged to Bacteroidetes, Firmicutes and Actinobacteria, whereas the nodes in Module III mostly belonged to Bacteroidetes, Firmicutes and Proteobacteria. Most of the observed correlations in Module II were negative (). The correlation between Module I and Module II was negative except the node of OTU_36, which was predicted to be an opportunistic pathogen, Rothia mucilaginosa [Citation35]. Besides, the correlation between Module I and Module III was negative (Figure 2). OTU_15 was positively correlated with Module I and negatively correlated with Module III. Furthermore, based on the hub scores, the top five taxa identified as keystone were OTU_77, OTU_8, OTU_12, OTU_6, OTU_29 (). These five OTUs are predicted to be opportunistic pathogens, and they are part of the normal human microbiome ().
Discussion
The human gastric microbiome would be related to gastric diseases, but reports about the microbial composition of GJ and tissues in patients are limited [Citation17,Citation19,Citation36]. The microbial investigation of some Chinese and Mexican GCT samples showed that the most abundant microbes in the GCT samples were assigned to Proteobacteria, followed by oral-associated bacteria [Citation17]. H. pylori are the most abundant microbe in the gastric microbiota, which composed 51% and 24% of Chinese and Mexican gastric tissue microbiota, respectively [Citation17]. However, compared with previous studies, H. pylori were not dominant with a high proportion in the samples we collected [Citation17–19]. The five most abundant phyla in the collected samples were similar to those in the H. pylori-negative individuals reported before [Citation5,Citation20,Citation37], showing that H. pylori were not the dominant bacterium in the patients except in sample Ga-06 (Supplementary Table S4). The low abundance of H. pylori in the gastric microbiota hinted that the gastric microbiota might be adapted to the increased gastric pH and other bacteria in the gastric microbiota of the patients became enriched during GC development [Citation5,Citation15,Citation16].
Due to the acidic environment, the gastric microbiota was thought to be simple [Citation18]. Previous studies showed that H. pylori were the dominant bacteria and many different bacteria were distributed in the gastric tissues of patients [Citation17]. However, the average reads for the samples were only 10,460, and the microbial alpha diversity in the tissues was not analysed [Citation17]. Another study indicated that H. pylori was high in chronic gastritis patients, but was low in GC patients [Citation19]. The microbiota of GJ, GNT and GCT samples from patients harboured an average of more than 450 OTUs, indicating that diverse bacteria were distributed in the samples (Supplementary Table S2). The microbial alpha diversity of GJ, GNT and GCT samples showed no significant difference between each two groups, suggesting the microbiota in GJ or gastric tissues were similar and the gastric microbiota cannot be clustered based on the tissue type [Citation17].
The human microbiota might be affected by diet, nutrients and environments [Citation20,Citation38–40]. In a previous study, gastric microbiota was mainly clustered by the geographic location rather than the tissue types [Citation17]. All our samples were collected from patients who lived in central China, and these samples could not be separated by the tissue type. This might due to the fact that patients have a similar diet, nutrients and living environment [Citation41]. Previous studies identified that a lower microbial diversity in patients with GC than in those with gastritis, which is in consistent with our study [Citation19,Citation42]. In our results, a higher microbial diversity was observed in GCT compared to GJ and GNT, indicating that there might be a disorder in the GCT microbiota.
The co-occurrence network analysis of the most abundant OTUs suggested the dominant microbes could be classified into 3 modules. Module I was negatively correlated with Module III, indicating that it could not co-exist with Module III. Moreover, H. pylori showed weak correlations with other dominant OTUs, showing that H. pylori may not be the keystone taxon. A recent study showed that H. pylori promoted GC development by inhibition of autophagy via Rad51 ubiquitination [Citation43], indicating H. pylori might not be the direct GC inducer. On the other hand, the top 5 keystone taxa, OTU_77, OTU_8, OTU_12, OTU_6 and OTU_29, were the opportunistic pathogens that might participate in GC development in the patients included in our study, hinting that opportunistic pathogens or other human common microbiota might also play important roles in GC development. Though no evidence showed directly that the identified five keystone taxa were the cause of any cancer, it would be interesting to study the characters of these five keystone taxa in the stomach of healthy persons. In the future, isolating the keystone taxa in gastric samples and inoculating them in germ-free mice would provide insights into their functional roles in GC development [Citation20]. Systems-level approaches need to be tried to understand and uncover the mechanisms of GC developments [Citation44].
Conclusions
In this study, we found that H. pylori were not the dominant species in most GC patients, and the gastric microbiota could not be clustered based on tissue types. Microbial network analysis showed that five identified keystone taxa were opportunistic pathogens and they might play critical roles in GC development. To understand the association between microbiota and GC, further isolation of the key microorganisms and elucidation of their functional mechanisms are highly required.
Authors’ contribution
Y.W. and H.L. conceived the study. J.W., X.S., M.W., Y.L., Y.G. and Y.W. conducted experiments, J.W., X.S., M.W., Y.L., B.J., C.J. and Y.W. analysed the data. Y.W. and H.L. wrote the manuscript. All the authors read, revised and approved the manuscript.
Supplemental Material
Download PDF (441.3 KB)Acknowledgements
We thank DeepBiome Co., Ltd. for bioinformatic assistance. We thank Zhiyi Xu at Charité Universitätsmedizin Berlin for polishing English writing of this manuscript.
Disclosure statement
The authors declare that there are no conflicts of interest.
Data availability statement
The data that support the findings of this study are available from the corresponding author upon reasonable request.
Additional information
Funding
References
- Bray F, Ferlay J, Soerjomataram I, et al. Global cancer statistics 2018: GLOBOCAN estimates of incidence and mortality worldwide for 36 cancers in 185 countries. CA Cancer J Clin. 2018;68(6):394–424.
- Hunt RH, Yaghoobi M. The esophageal and gastric microbiome in health and disease. Gastroenterol Clin North Am. 2017;46(1):121–141.
- Dias-Jacome E, Libânio D, Borges-Canha M, et al. Gastric microbiota and carcinogenesis: the role of non-Helicobacter pylori bacteria - a systematic review. Rev Esp Enferm Dig. 2016;108(9):530–540.
- Lv Y-P, Cheng P, Zhang J-Y, et al. Helicobacter pylori-induced matrix metallopeptidase-10 promotes gastric bacterial colonization and gastritis. Sci Adv. 2019;5(4):eaau6547
- Noto JM, Peek RM. The gastric microbiome, its interaction with Helicobacter pylori, and its potential role in the progression to stomach cancer. PLoS Pathog. 2017;13(10):e1006573.
- Brawner KM, Kumar R, Serrano CA, et al. Helicobacter pylori infection is associated with an altered gastric microbiota in children. Mucosal Immunol. 2017;10(5):1169–1177.
- Alarcon T, Llorca L, Perez-Perez G. Impact of the microbiota and gastric disease development by Helicobacter pylori. Curr Top Microbiol Immunol. 2017;400:253–275.
- Lee Y-C, Chiang T-H, Chou C-K, et al. Association between helicobacter pylori eradication and gastric cancer incidence: a systematic review and meta-analysis. Gastroenterology. 2016;150(5):1113–1124.e5.
- Yamashita Y, Takeshita T. The oral microbiome and human health. J Oral Sci. 2017;59(2):201–206.
- Lu B, Li M. Helicobacter pylori eradication for preventing gastric cancer. World J Gastroenterol. 2014;20(19):5660–5665.
- Peng X, Zhou L, Gong Y, et al. Non-pylori Helicobacters (NHPHs) induce shifts in gastric microbiota in Helicobacter pylori-infected patients. Front Microbiol. 2017;8:1038.
- Huttenhower C, Gevers D, Knight R, et al. Structure, function and diversity of the healthy human microbiome. Nature. 2012;486(7402):207–214.
- Nath K, Thaiss CA. Digitalizing the microbiome for human health. mSystems. 2019;4(3):e00129-19.
- Proctor LM, Creasy HH, Fettweis JM, et al. The integrative human microbiome project. Nature. 2019;569(7758):641–648.
- Bik EM, Eckburg PB, Gill SR, et al. Molecular analysis of the bacterial microbiota in the human stomach. Proc Natl Acad Sci USA. 2006;103(3):732–737.
- Maldonado-Contreras A, Goldfarb KC, Godoy-Vitorino F, et al. Structure of the human gastric bacterial community in relation to Helicobacter pylori status. ISME J. 2011;5(4):574–579.
- Yu G, Torres J, Hu N, et al. Molecular characterization of the human stomach microbiota in gastric cancer patients. Front Cell Infect Microbiol. 2017;7:302.
- Sheh A, Fox JG. The role of the gastrointestinal microbiome in Helicobacter pylori pathogenesis. Gut Microbes. 2013;4(6):505–531.
- Ferreira RM, Pereira-Marques J, Pinto-Ribeiro I, et al. Gastric microbial community profiling reveals a dysbiotic cancer-associated microbiota. Gut. 2018;67(2):226–236.
- Nardone G, Compare D. The human gastric microbiota: is it time to rethink the pathogenesis of stomach diseases? United European Gastroenterol J. 2015;3(3):255–260.
- Brawner KM, Morrow CD, Smith PD. Gastric microbiome and gastric cancer. Cancer J. 2014;20(3):211–216.
- Liang J, Mai W, Tang J, et al. Highly effective treatment of petrochemical wastewater by a super-sized industrial scale plant with expanded granular sludge bed bioreactor and aerobic activated sludge. Chem Eng J. 2019;360:15–23.
- Edgar RC, Flyvbjerg H. Error filtering, pair assembly and error correction for next-generation sequencing reads. Bioinformatics. 2015;31(21):3476–3482.
- Edgar RC. UPARSE: highly accurate OTU sequences from microbial amplicon reads. Nat Methods. 2013;10(10):996–998.
- Cole JR, Wang Q, Fish JA, et al. Ribosomal Database Project: data and tools for high throughput rRNA analysis. Nucleic Acids Res. 2014;42(Database issue):D633–D642.
- Jiao S, Liu Z, Lin Y, et al. Bacterial communities in oil contaminated soils: biogeography and cooccurrence patterns. Soil Biol Biochem. 2016;98:64–73.
- Liang J, Mai W, Wang J, et al. Performance and microbial communities of a novel integrated industrial-scale pulp and paper wastewater treatment plant. J. Cleaner Prod. 2021;278:123896 doi:10.1016/j.jclepro.2020.123896.
- Farmer JJ, Fanning GR, Davis BR 3rd, et al. Escherichia fergusonii and Enterobacter taylorae, two new species of Enterobacteriaceae isolated from clinical specimens. J Clin Microbiol. 1985;21(1):77–81.
- Vo B, Lecomte V, Marot J-C, et al. Fatal infective endocarditis due to Neisseria subflava: case report and review of the literature. Acta Clin Belg. 2016;71:24.
- Lopez-Lopez A, Camelo-Castillo A, Ferrer MD, et al. Health-associated niche inhabitants as oral probiotics: the case of Streptococcus dentisani. Front Microbiol. 2017;8:379.
- Grady EN, MacDonald J, Ho MT, et al. Characterization and complete genome analysis of the surfactin-producing, plant-protecting bacterium Bacillus velezensis 9D-6. BMC Microbiol. 2019;19(1):5.
- Qiao S, Wu D, Wang M, et al. Oral microbial profile variation during canine ligature-induced peri-implantitis development. BMC Microbiol. 2020;20(1):293. doi:10.1186/s12866-020-01982-6.
- Liu Y-R, Delgado-Baquerizo M, Bi L, et al. Consistent responses of soil microbial taxonomic and functional attributes to mercury pollution across China. Microbiome. 2018;6(1):183.
- Mima K, Nishihara R, Qian ZR, et al. Fusobacterium nucleatum in colorectal carcinoma tissue and patient prognosis. Gut. 2016;65(12):1973–1980.
- Maraki S, Papadakis IS. Rothia mucilaginosa pneumonia: a literature review. Infect Dis. 2015;47(3):125–129.
- Eslami M, Yousefi B, Kokhaei P, et al. Current information on the association of Helicobacter pylori with autophagy and gastric cancer. J Cell Physiol. 2019;234(9):14800–14811.
- Delgado S, Cabrera-Rubio R, Mira A, et al. Microbiological survey of the human gastric ecosystem using culturing and pyrosequencing methods. Microb Ecol. 2013;65(3):763–772.
- Sahasakul Y, Takemura N, Sonoyama K. Different impacts of purified and nonpurified diets on microbiota and toll-like receptors in the mouse stomach. Biosci Biotechnol Biochem. 2012;76(9):1728–1732.
- He C, Cheng D, Peng C, et al. High-fat diet induces dysbiosis of gastric microbiota prior to gut microbiota in association with metabolic disorders in mice. Front Microbiol. 2018;9:639.
- Tian L, Tan Y, Chen G, et al. Metabolism of anthocyanins and consequent effects on the gut microbiota. Crit Rev Food Sci Nutr. 2019;59(6):982–991.
- Zmora N, Suez J, Elinav E. You are what you eat: diet, health and the gut microbiota. Nat Rev Gastroenterol Hepatol. 2019;16(1):35–56.
- Aviles-Jimenez F, Vazquez-Jimenez F, Medrano-Guzman R, et al. Stomach microbiota composition varies between patients with non-atrophic gastritis and patients with intestinal type of gastric cancer. Sci Rep. 2015;4(1):4202.
- Xie C, Li N, Wang H, et al. Inhibition of autophagy aggravates DNA damage response and gastric tumorigenesis via Rad51 ubiquitination in response to H. pylori infection. Gut Microbes. 2020;11(6):1567–1589.
- Shi X, Wei Y, Ji B. Systems biology of gastric cancer: perspectives on the omics-based diagnosis and treatment. Front Mol Biosci. 2020;7:203.