
Abstract
Bone loss is caused by inflammation and is mediated by pro-inflammatory cytokines that control bone formation and bone resorption. The study aimed to determine the effect of secreted factors from human bone marrow-derived stromal cells (hBMSC) of no-heterotopic bone-forming capacity (hBMSC–Bone) cells on the differentiation potential of hBMSC which capable of creating bone in-vivo (hBMSC+Bone) and dissect the molecular signature of these cells for understanding the complicated relationship of stem cells and microenvironment. hBMSC cultures are heterogenous with respect to differentiation and function. However, the nature of interaction between different cell populations within hBMSC cultures is poorly investigated. We employed two clonal hBMSC lines which exhibit different functional phenotypes based on the presence of either high or low osteoblastic differentiation capacity, bone forming (hBMSC+Bone) and non-bone forming (hBMSC−Bone), and examined their biological interaction. Adding conditioned media (CM) of hBMSC−Bone cultures resulted in suppression of cell proliferation and osteoblasts differentiation of hBMSC+Bone. Microarray analysis of CM-treated hBMSC+Bone revealed significant enrichment of several pathways, including TGFβ signaling. Follow-up experiments corroborated the inhibitory effects on TGFβ signaling as evidenced by decreased SMAD2 phosphorylation and TGFβ-responsive genes (TAGLN, ACTA2 and TPM1). Interestingly, IL1β is highly expressed in hBMSC−Bone and is present in its CM. Incubating hBMSC−Bone with rhIL-1RI rescued the functional phenotype of hBMSC−Bone with respect to cell proliferation and differentiation into osteoblasts, and upregulated TGFβ-responsive genes. These data demonstrated that IL1β-TGFβ signaling is part of the intercellular communication within the heterogenous population of hBMSCs and regulates their commitment to osteoblastic fate.
Supplemental data for this article is available online at https://doi.org/10.1080/13102818.2021.1939784 .
Introduction
Bone is a complex organ that regulates the skeleton system. The immune system, a complex system that controls the invading pathogens’ response, is regulated by multiple overlapping and interacting mechanisms. For example, osteoblasts regulate the hematopoietic stem cell (HSC) niche from which all blood and immune cells formed [Citation1]. It is well known that multiple soluble mediators of immune cell function, including growth factors, cytokines and chemokines, possess a regulatory role in osteoblast and osteoclast activity [Citation1,Citation2]. Understanding the synergies between bone and immune systems and the mechanisms underlying the interaction between both systems in both health and disease will guide us to better therapeutics for conditions that affect either or both.
Some stem cell types have been envisaged as promising candidates for therapy, and one of the most important types is human bone marrow Mesenchymal stem cells (hBMSCs), as they possess the potential to differentiate into osteogenic, adipogenic and chondrogenic lineages when cultured in specific induction media in-vitro [Citation3–5]. BM-MSC in their niche is exposed to a complex microenvironment that contains a large number of cytokine and growth factors due to the proximity of bone and bone marrow compartment [Citation6]. Besides their critical role in regenerative medicine as undifferentiated cells reserves, hBMSCs play essential immunomodulatory functions through secreting many growth factors and active immune cytokines such as interleukin one beta [Citation1,Citation7], which participate in tissue survival and regulate the activity of several immune cells [Citation3,Citation7]. Furthermore, BM-MSCs secrete several biological active factors which function in an autocrine or paracrine manner, mediating various biological processes [Citation8]. These factors have been identified in the conditioned media of cultured cells [Citation8], and their in-vivo existence has been demonstrated in human bone biopsies [Citation9–13].
Transforming growth factor-beta (TGFβ) is secreted mainly by bone cells (but deposited in matrix) and endothelial, smooth muscle cells, epithelial, fibroblasts cells, and most cells of the immune system [Citation14,Citation15]. TGFβ plays a crucial role in stem cell differentiation and regulating inflammatory processes such as T-cell regulation and differentiation [Citation16,Citation17].
Interleukin 1-beta (IL-1β) is a member of the interleukin-1 family of cytokines, and is considered a primary therapeutic target for various inflammatory conditions. This cytokine is an essential mediator of the inflammatory response, and plays a role in multiple cellular processes, including cell proliferation, differentiation and apoptosis. IL-1β has emerged as an effective enhancer of bone resorption, in vitro and in vivo [Citation2,Citation18]. It has been reported that the formation of osteoclasts in vitro is mediated by the autocrine secretion of IL-1β [Citation19]. The recombinant human IL-1 soluble receptor type I (rhIL-1 sRI) is an 80 kDa transmembrane protein expressed predominantly by T cells, fibroblasts and endothelial cells. rhIL-1 sRI is a potent antagonist of IL-1 action.
We have recently reported [Citation20] the isolation of two clonal cell lines from the telomerized BM-MSC (hMSC-TERT cell line) that displayed different phenotypes: hBMSC+Bone a molecular phenotype of bone-forming osteoprogenitors. The study also showed high levels of skeletal muscle-and bone-related genes and osteoblastic markers (alkaline phosphatase and CD146). Moreover, hBMSC+Bone exhibited the ability to differentiate into osteoblasts, adipocytes and chondrocytes in-vitro; while hBMSC−Bone expressed a molecular phenotype of immunomodulatory cells with high levels of immune-associated genes and reduced differentiation potential. The study aimed to determine the effect of these two cellular models’ secreted factors and dissect these cells’ molecular signature. Also, to understand the interaction mechanism and complicated relationship between stem cells and microenvironment. Further, to prove the hypothesis that different hBMSC populations’ secreted factors mediate the interaction among hBMSC populations and determine their functions. Also, we attempted to identify the genetic signaling pathways underlying such interactions.
Materials and methods
Materials
Cell culture
Extensively characterized telomerized human bone marrow stromal cell lines (hMSC-TERT) with abundant phenotypic and molecular similarity with primary regular human MSC were used for this study. The cells were generated from healthy human MSC after transduction with a retroviral vector overexpressing the human telomerase reverse transcriptase gene (hMSC-TERT cells). Two sub-clones were used for this experiment; high bone-forming cells (hBMSC+Bone) derived from early-passage hBMSC-TERT cells (corresponding to population doubling level (PDL) 77), and low bone-forming cells (hBMSC−Bone) from late-passage hBMSC-TERT cells (PDL-233) as earlier described [Citation20]. The cells were seeded in Dulbecco’s modified Eagle’s medium (DMEM) including 4500 500he cells were seeded in Dulbecco’s modified Eagle’s medium (DMEM) including ing level (PDL) 77), and low bone-form×) 100 U/mL penicillin-streptomycin, and non-essential amino acids in a humidified incubator at 5% (v/v) CO2 at 37 °C. All chemicals used were obtained from Gibco Invitrogen, USA. The cells were cultured until 70–80% cofluency before passaging into new flasks, the medium was changed every 2–3 days; we made sure that the morphology did not change and the split ratio was 1:3.
Preparation of hBMSC+Bone and hBMSC–Bone conditioned media (CM)
To generate hBMSC–Bone CM, hBMSC–Bone cells were seeded in six T150 flasks containing DMEM medium supplemented with 10% fetal bovine serum (FBS). 1% NEAA and 1% penicillin/streptomycin were placed in a humidified incubator at 5% (v/v) CO2 at 37 °C. After 48 h of incubation, the cells have reached about 90% confluence, and the media were harvested in a tube and spun down at 3000 00037 °C. After 48 h of incubation, the cells have reached ab
Thereafter, hBMSC+Bone cells were seeded in the collected CM in T25 flask at 1 × 10⁶ in the collected CM (50% CM + 50% fresh medium) for 10 days and passaged upon confluency. hBMSC+Bone induction was done after 10 days. Cells were induced with osteoblast or adipocytic induction media prepared using 50% CM +50 DMEM.
In-vitro osteoblastic differentiation
First, the cells were grown in 24-well plates in normal DMEM at 0.1 × 10⁶ cells/mL. At 70–80% confluency, cells were cultured in an osteoblastic medium to promote osteoblastic differentiation. The induction medium was composed of DMEM supplemented with 10% FBS, 1% Pen-strep, 50 μg/mL L-ascorbic acid (Wako Chemicals, Neuss, Germany), 10 nmol/L calcitriol (1α,25-dihydroxy vitamin D3; Sigma), 10 mmol/L β-glycerophosphate (Sigma), and 10 nmol/L dexamethasone (Sigma). Cells were maintained in 5% CO2 at 37 °C with 95% relative humidity, and the medium was changed three times per week.
In-vitro adipocyte differentiation
For the adipogenic differentiation, cells were grown in standard DMEM growth medium in 24-well plates at 0.1 × 10⁶ cells/mL until 90–100% confluency. Thereafter, the traditional medium was removed and the adipogenic differentiation medium was added. The induction medium was prepared by supplementing normal DMEM with an adipogenic induction mixture. The medium composed of 10% FBS, 10% Horse Serum (Sigma), 1% Pen-strep, 100 nmol/L dexamethasone, 0.45 mmol/L isobutyl methylxanthine [Citation21] (Sigma), 3 μg/mL insulin (Sigma), and 1 μmol/L Rosiglitazone [Citation22] (Novo Nordisk, Bagsvaerd, Denmark). The media were renewed thrice a week.
Cytochemical staining
Assessment of mineral deposition by Alizarin Red S (ARS) staining
To evaluate the mineralized matrix in hBMSC, the cell layer was washed with PBS and then fixed with 4% paraformaldehyde at room temperature for 15 min. Fixative was removed, and the fixed cells were rinsed with distilled water. Afterward, 2% Alizarin Red Staining solution (ScienceCell, Research Laboratories, Cat. No. 0223) was added at room temperature for 20–30 min. Excess dye was washed off with water. To quantify Alizarin Red S staining, 800 µL acetic acid was added to each well for eluting the ARS dye from stained osteoblast and incubated at room temperature for 30 min as previously described [Citation23]. The prepared solution’s absorbance was measured at 405 nm using a spectrophotometer (BioTek, Epoch).
Quantitative ALP activity
The ALP activity colorimetric assay kit (BioVision, Inc, CA, USA) was used to quantify ALP activity; the cells were seeded in 24-well plates in standard conditions. Then, on the day of analysis, cells were washed with PBS then fixed using formaldehyde 3.7% in ethanol 90% for 30 s at room temperature. Then, the fixative was detached, and 50 μL of p-nitrophenylphosphate (pNPP) solution was added to each well and incubated for 1 h dark at room temperature. The reaction was subsequently stopped by adding a 20 μL stop solution and gently shaking the plate. The optical density (OD) was then measured at 405 nm using BioTek Synergy II microplate reader (BioTek Inc., Winooski, VT, USA).
OsteoImage mineralization assay
In-vitro mineralization was assessed using the OsteoImage Mineralization Assay (Lonza, USA, Cat. No. PA-1503). Culture media were aspirated, cells were rinsed once with PBS, and fixed with 70% cold ethanol for 20 min. An appropriate amount of diluted staining reagent (according to the manufacturer’s guide) was added to the cell layer and they were incubated in a dark place for 30 min at room temperature. Cells were rinsed, and the staining quantitation was measured using a fluorescent plate reader set at 492/520 excitation-emission wavelengths.
Oil red-O staining
Oil red-O staining was used to analyze the mature adipocytes filled with cytoplasmic lipid droplets. PBS-washed cells were fixed in 4% formaldehyde at RT for 10 min, washed with 3% isopropanol, and stained with filtered Oil Red-O staining solution (0.5 g Oil red-O powder in 60% isopropanol) at RT for 1 h. To quantify mature adipocytes, Oil red-O stain was eluted using 100% isopropanol and OD510 was assessed (Biotek Spectrophotometer, Epoch).
Nile red fluorescence determination
Nile red (1 mg/mL) was mixed in dimethyl sulfoxide (DMSO) to prepare the stock solution and stored at −20 °C in the dark. The cells were fixed in 4% paraformaldehyde (Sigma) for 15 min and stained. The cells were then washed with PBS and directly treated with the dye (5 μg/mL PBS), followed by incubation for 10 min at RT. The fluorescence spectrophotometer plate reader (SpectraMax/M5, Molecular Devices Co., Sunnyvale, CA, USA) was used to measure fluorescence emission-excitation wavelengths of 572 and 485 nm, respectively.
Cell proliferation assays
Cell number
The cells were seeded in T25 flasks. At confluence, the cells were trypsinized and manually counted using a hemocytometer.
AlamarBlueTM cell viability assay
AlamarBlueTM assay (AbDSerotec, Raleigh, NC, USA) was used to measure cell viability. Briefly, the cell-containing wells were filled with 10 μL alamarBlueTM substrate, followed by incubation at 37 °C for 1 h in the dark. OD (Em 590 nm/Ex 530 nm) was measured using a BioTek Synergy II microplate reader (BioTek Inc., Winooski, VT, USA).
Western blotting
The cell lysates were prepared according to the previous report (Jurmeister et al., 2012). The samples were immunoblotted with anti-β-ACTIN (Sigma, 1:10,000 dilution) and P-SMAD2 (Cell signaling, 1:500 dilution) to assess the soluble proteins. Reactivity was detected via chemiluminescence with Clarity Western ECL substrate (Bio-Rad) and horseradish peroxidase-conjugated secondary antibodies (Santa-Cruz Biotechnology) using C-Digit Blot Scanner (LI-COR) [Citation25].
DNA microarray
PureLink RNA mini isolation kit (Ambion by Life Technologies, USA) was used to extract total RNA. Next, 150 µL total RNA was labeled and hybridized to the Agilent Human SurePrint G3 Human GE 8 × 60 k v16 microarray chip (Agilent Technologies). All experiments were conducted at the Microarray Core Facility (Stem Cell Unit, King Saud University College of Medicine). GeneSpring GX software (Agilent Technologies) was used for data analyses and normalization. The single experiment pathway analysis in GeneSpring 12.0 (Agilent Technologies) was used for pathway analysis, as described previously [Citation20].
Quantitative real-time PCR (qRT-PCR)
PureLink kit (Ambion by Life Technologies, USA) was used to extract total RNA, which was then quantified using a Nanodrop spectrophotometer (Nanodrop 2000, Thermo Scientific, USA). High Capacity cDNA Reverse Transcription kit (Applied Biosystem, USA) and Multigene thermocycler (Labnet International, Inc.) was used to synthesize cDNA from 1 µg RNA. Real-time PCR (Applied Biosystem-Real Time PCR Detection System) was conducted using TaqMan Universal Master Mix II (Applied Biosystem, USA) or Power SYBR Green PCR kit (Applied Biosystem, UK).
Statistical analysis
All results were presented as mean values and standard deviation (±SD) of at least three independent experiments. Inter-group differences were assessed using Student’s t-test. Differences were considered statistically significant at the p < 0.05 level; for this we used Excel Office version 16.49.
Results
Conditioned medium from hBMSC−Bone cells suppresses osteoblast and adipocyte differentiation of hBMSC + Bone cells
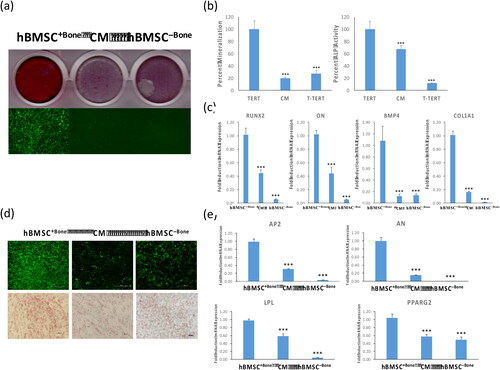
Two clonal cell lines hBMSC+Bone and hBMSC–Bone have been isolated from our parental hBMSC-TERT cell line [Citation26] at different population doubling levels (PDLs) based on their in vivo bone formation potential [Citation27], and exhibited high and low osteoblastic and adipocytic differentiation potential, respectively [Citation20]. To assess the effect of secreted factors from hBMSC–Bone on the differentiation potential of hBMSC+Bone, hBMSC+Bone cells were cultured for ten days in conditioned medium isolated from hBMSC–Bone. As shown in , culturing hBMSC+Bone in CM suppressed osteoblast differentiation. These inhibitory effects were confirmed by significant decrease in mineralized matrix formation visualized by alizarin red staining () and quantification (, left panel), decreased ALP activity (, right panel), and the expression of a panel of osteoblastic gene markers: runt-related transcription factor 2 (RUNX2), osteonectin (ON), bone morphogenic protein 4 (BMP4) and collagen-1A1 (COL1A1) (). Similarly, hBMSC+Bone cells exposed to CM of hBMSC–Bone exhibited suppression in adipocytic differentiation evidenced by a reduced number of lipid-filled mature adipocytes (), downregulation of adipocytic gene markers: adipocyte protein 2 (AP2), lipoprotein lipase (LPL), and peroxisome proliferator-activated receptor-gamma 2 (PPARG2) (). The differentiation responses of BMSC–Bone cells are shown in .
Figure 1. Conditioned medium from hBMSC−Bone suppresses osteoblast and adipocyte differentiation of hBMSC+Bone. hBMSC+Bone, hBMSC+Bone cultured in conditioned medium from hBMSC−Bone for 10 days (CM), and hBMSC−Bone were differentiated into both osteoblasts and adipocytes using osteogenic and adipogenic induction mixture for 7 and 14 days, respectively. (a) The upper panel shows mineralized matrix formation visualized by Alizarin Red S staining; the lower panel shows fluorescent mineralized matrix formation visualized by OsteoImage staining (20× magnification). (b) Quantification of mineralized matrix formation is shown (left panel), which is normalized to the total number of cells; quantification of ALP activity shown as a percentage at day 14 (right panel). Data are presented as means ± SD of three independent experiments; n = 6; ***p < 0.0005. (c) qRT-PCR quantification of osteogenic markers: RUNX2, ON, BMP4 and COL1A1 mRNA expression in cells exposed to osteogenic differentiation medium. The expression of all target genes was normalized to GAPDH. Data are presented as means ± SD from three independent experiments, n = 9; *p < 0.05; **p < 0.005, ***p < 0.0005. (d) The upper panel shows fluorescence Nile Red staining of mature oil filled adipocytes (20× magnification). Cells were stained on day 7 using Oil Red O staining for adipocytes containing lipid droplets, and shown as microscopic images (lower panel, 20× magnification). (e) qRT-PCR quantification for AP2, AN, LPL and PPARG2 mRNA in hBMSC+Bone, CM and hBMSC−Bone. The expression of all target genes was normalized to the expression of GAPDH. Data are presented as means ± SD from three independent experiments, n = 9; *p < 0.05; **p < 0.005, ***p < 0.0005.
hBMSC−Bone-CM medium impairs TGFβ signaling in hBMSC+Bone cells
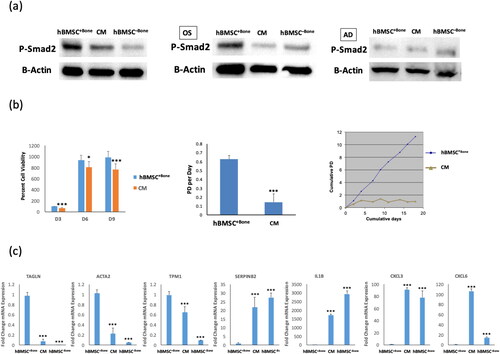
We have previously demonstrated that TGFβ signaling is essential for osteoblast differentiation of BM-MSC [Citation28–30]. Interestingly, CM of hBMSC−Bone impaired TGFβ signaling in hBMSC+Bone as shown by lower levels of p-SMAD2 () at baseline and following osteoblast or adipocyte differentiation (). Standard cell viability AlamarBlue assay and population doubling per day showed decreased cell proliferation in hBMSC+Bone cells treated with CM (). Also, the mRNA expression levels of TGFβ-responsive genes (TGALN, ACTA2, TPM1) were downregulated ().
Figure 2. hBMSC+Bone treated with conditioned medium from hBMSC−Bone cells exhibit low cell proliferation rate and inactivation TGFβ signaling pathway. (a) Western blotting for P-SMAD2 in hBMSC−Bone, hBMSC+Bone cultured in conditioned medium from hBMSC−Bone for 10 days (CM), and hBMSC+Bone (upper panel), whereas β-Actin (ACTB, lower panel) was used as a loading control, under different treatment conditions, non-induced (left panel), osteogenic induced (middle panel), and adipogenic induced (right panel). (b) Cell viability measured using AlamarBlueTM assay for hBMSC+Bone and CM cells on days 3, 6 and 9 (left panel). Cell proliferation rate is shown as population doubling (PD) per day for hBMSC+Bone and CM cells (middle panel). Short-term growth curve showing cumulative PD over the 18-day culture of hBMSC+Bone and CM cells (right panel). (c) qRT-PCR performed for TGFβ responsive genes including TAGLN, ACTA2, TPM1, SERPINB2 and IL1β, in addition to CXCL3 and CXCL6 for hBMSC+Bone, CM and hBMSC−Bone. The expression of each target gene was normalized to the expression of GAPDH. Data are shown as mean values ± SD of three independent experiments, *p < 0.05; **p < 0.005, ***p < 0.0005.
Gene expression profiling of CM-treated hBMSC+Bone cells
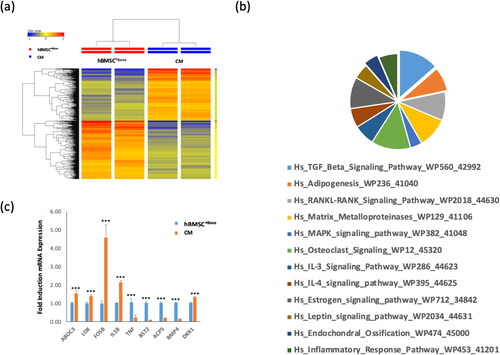
Global gene expression profiling was performed on hBMSC−Bone—CM-treated hBMSC+Bone cells and compared with control hBMSC+Bone cells. Clear separation of control cells from CM-treated hBMSC+Bone cells based on differentially expressed genes was shown by Hierarchical clustering (). We identified 284 up-regulated and 254 down-regulated genes in CM-treated hBMSC+Bone cells compared to control cells (2.0 FC, p < 0.05; Tables S1 and S2, supplementary material). Pathway analysis performed on the de-regulated genes revealed significant enrichment in several genetic pathways related to ‘TGFβ signaling’, ‘adipogenesis’, ‘matrix metalloproteinases’, ‘MAPK signaling’, ‘osteoclast signaling’, ‘IL3 signaling’, ‘IL4 signaling’ and ‘endochondral ossification’ pathways (). Microarray analysis was validated by qRT-PCR for a selected regulated gene (). Among the genes that were significantly upregulated (2 fold) was IL-1B ().
Figure 3. Gene expression profiling of CM cells and hBMSC+Bone. (a) Hierarchical clustering of CM cells compared to hBMSC+Bone, based on differentially expressed mRNA transcripts. Each row represents one replica sample, and each column represents a transcript. The expression level of all genes in a single sample is depicted according to the color scale. (b) Pie chart illustrating the distribution of 12 pathways out of the top pathway designations for the deregulated genes in CM cells compared to hBMSC+Bone. (c) The expression levels of the selected genes from the microarray data were validated using qRT-PCR in CM cells compared to hBMSC+Bone. Data are presented as means ± SD from three independent experiments, n = 6; ***p < 0.0005.
IL-1β inhibited osteoblast differentiation of hBMSC+Bone cells
We identified IL-1β as one out of most up-regulated genes (71.2 fold change) in the whole transcriptome of hBMSC–Bone versus hBMSC+Bone using a DNA microarray platform, in addition to dysregulation of a panel of genes in hBMSC−Bone compared with hBMSC+Bone that are involved in TGFβ pathway (). We corroborated these data by showing that IL1β treatment down-regulated a panel of TGFβ responsive genes: TAGLN, ACTA2, BMP4, COL1A2, and SMAD2 up-regulated SERPINB2, CXCL3 and CXCL6 in hBMSC+Bone cells (). Since IL-1β is a secreted factor and is present in the CM of hBMSC−Bone [Citation13,Citation27,Citation31,Citation32], we assessed the biological effects of IL-1β on hBMSC+Bone cell proliferation and differentiation. IL-1β treatment reduced the cell proliferation rate (), impaired the osteoblast differentiation as evidenced by reduced formation of the mineralized matrix () and reduced osteoblastic makers genes expression: OCN, ON, osteopontin (OPN), COL1A1 and BMP4 ().
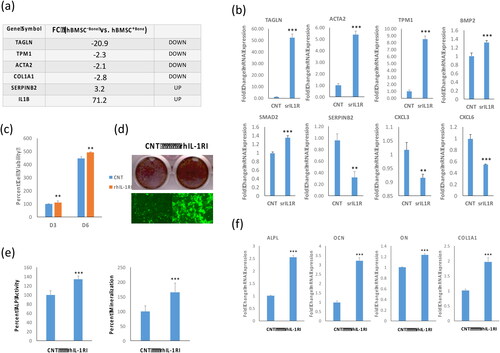
Figure 4. IL-1β inhibitor induces osteoblastic differentiation of hBMSC−Bone cells. (a) List of six of the most differentially expressed genes in hBMSC−Bone cells. (b) qRT-PCR performed for TGFβ responsive genes including TAGLN, ACTA2, TPM1, BMP2, SMAD2 and SERPINB2, in addition to CXCL3 and CXCL6 for hBMSC−Bone cells in the presence or absence of rhIL-1RI. Cells without rhIL-1RI were used as control (CNT). Expression of each target gene was normalized to the expression of GAPDH. Data are shown as mean values ± SD of three independent experiments, *p < 0.05; **p < 0.005, ***p < 0.0005. (c) Cell viability measured using AlamarBlueTM assay on days 3 and 6 for hBMSC−Bone cells in the presence or absence of recombinant human soluble receptor of IL1 (rhIL-1RI, 100 ng/mL). Data are shown as the means ± SD of three independent experiments, p < 0.005. (d) hBMSC−Bone cells were induced for osteoblast differentiation using the standard protocol described in the methods. The upper panel shows mineralized matrix formation visualized by Alizarin Red S staining. The lower panel shows fluorescent mineralized matrix formation visualized by OsteoImage staining (20× magnification). (e) Quantification of ALP activity shown as percentage for hBMSC−Bone cells in the presence or absence of rhIL-1RI is shown (left panel). Quantification of mineralized matrix formation for hBMSC−Bone cells in the presence or absence of rhIL-1RI is shown (right panel). Data are presented as relative mineralization ± SD from three independent experiments, n = 9; ***p < 0.0005. (f) qRT-PCR quantification of osteogenic markers: ALPL, OCN, ON and COL1A1 mRNA expression in hBMSC−Bone cells in the presence or absence of rhIL-1RI and exposed to osteogenic differentiation medium. The expression of each target gene was normalized to the expression of GAPDH. Data are presented as the means ± SD from three independent experiments, n = 9; *p < 0.05; **p < 0.005, ***p < 0.0005.
IL-1β inhibition induced osteoblastic differentiation of hBMSC−Bone cells
Our results suggested that secreted IL-1β by hBMSC−Bone mediates the inhibitory effects of hBMSC−Bone—CM effects on hBMSC+Bone. To examine this hypothesis, we assessed the biological effects of blocking IL-1β singling in hBMSC–Bone. hBMSC–Bone cells treated with recombinant human IL-1 soluble receptor type I (rhIL-1 sRI, 100 ng/mL) exhibited increased cell proliferation (), up-regulation of several TGFβ-responsive genes: TAGLN, ACTA2, TPM1, SMAD2 and BMP2, and down-regulation of SERPINB2 and CXCL3, and CXCL6 (). Besides, adding rhIL-1 sRI (100 ng/mL) to the induction medium enhanced osteoblast differentiation hBMSC−Bone cells as shown by increased mineralized matrix formation () (, right photomicrograph) and ALP activity (, left photomicrograph), as well as the expression of osteoblastic gene markers: alkaline phosphatase (ALPL), RUNX2, osteocalcin (OCN), ON and COL1A1 ().
Figure 5. Recombinant IL-1β suppresses osteoblastic differentiation of hBMSC+Bone cells. (a) Cell viability measured using Alamar blue assay on days 1, 4 and 6 for hBMSC+Bone cells in the presence or absence (control, ‘CNT’) of recombinant interleukin 1 beta (IL-1β, 10 ng/mL). (b) qRT-PCR performed for TGFβ responsive genes including TAGLN, ACTA2, BMP2, COL1A2, SMAD2 and SERPINB2, in addition to CXCL3 and CXCL6 for hBMSC+Bone cells in the presence or absence of IL1β. The expression of each target gene was normalized to the expression of GAPDH. Data are shown as mean values ± SD of three independent experiments, *p < 0.05; **p < 0.005, ***p < 0.0005. (c) hBMSC−Bone cells were induced for osteoblast differentiation using standard protocol described in the methods. The upper panel shows mineralized matrix formation visualized by Alizarin Red S staining. The lower panel shows fluorescent mineralized matrix formation visualized by OsteoImage staining (20× magnification). (d) Quantification of mineralized matrix formation for hBMSC+Bone cells in the presence or absence of IL-1β is shown. Data are presented as relative mineralization ± SD from three independent experiments, n = 9; ***p < 0.0005. (e) qRT-PCR quantification of osteogenic markers: OCN, ON, OPN, BMP4 and COL1A1 mRNA expression preformed on hBMSC+Bone cells in the presence or absence of IL-1β and exposed to osteogenic differentiation medium. The expression of each target gene was normalized to GAPDH. Data are presented as the means ± SD from three independent experiments, n = 9; *p < 0.05; **p < 0.005, ***p < 0.0005.
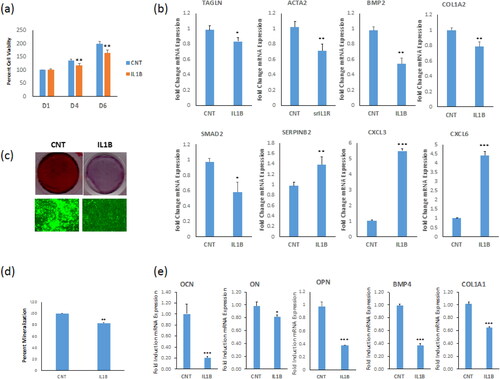
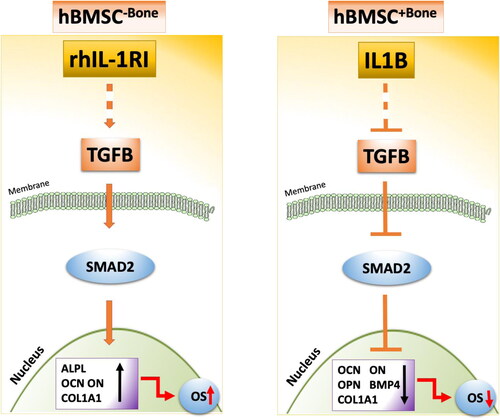
Figure 6. Schematic overview of the interaction between the heterogeneous cell populations of BM-MSC. This model proposed a balance between IL-1β and IL1RA in bone micro-environment, which can determine the osteoblastic differentiation of osteoprogenitor cells through modulating TGFb signaling.
Discussion
Mesenchymal stem cells (MSC)-based regenerative medicine cells can provide a novel approach for treating conditions in which enhanced bone regeneration is required. There is a complicated relationship between microenvironmental conditions and the functional role and differentiation potential of hBMSC. Nevertheless, the mechanism behind this relationship remains unclear.
In the present study, we observed that impaired differentiation and bone formation potential of hBMSC−Bone is associated with enhanced expression of inflammatory cytokines such as IL-1β. We examined the interaction between non-osteoblastic and osteoprogenitor cell populations within cultured BM-MSC. We demonstrate that IL-1b secretion by non-osteoblastic cells inhibits osteoblast differentiation of osteoprogenitor cells through inducing regulatory changes in TGFβ signaling.
We employed immortalized cell lines to study the interaction between functionally different BM-MSC populations. These cell lines have the advantage of being phenotypically stable, lack inter-individual variability, and provide a good model for primary BM-MSC [Citation33]. We also employed CM as a tool to study the humoral interaction between different cell populations. The choice of CM is based on our previous study that demonstrated that CM of BM-MSC contains several secreted factors that regulate the functions of cultured BM-MSC in an either autocrine or paracrine fashion [Citation9].
Thus, to understand the interaction mechanism underlying the effect of microenvironment on hBMSC differentiation, we conducted a comprehensive investigation to characterize the molecular and functional phenotype of hBMSC+Bone cells treated with conditioned media from hBMSC−Bone. Whole genome microarray analysis revealed significant up-regulation of IL-1β (71.2 fold change) in hBMSC−Bone cells, which suggested the regulatory functions related to the inflammatory and immune response of this cell population. Interestingly, suppression of cell proliferation and differentiation into osteoblasts and adipocytes of hBMSC−Bone cells and CM-treated hBMSC+Bone cells was associated with inhibition in SMAD2 phosphorylation before and after osteogenic and adipogenic differentiation and downregulation of some TGFβ-responsive genes including TAGLN, ACTA2 and TPM1, suggesting a possible interaction between TGFβ signaling pathway and IL-1β-mediated inflammatory responses in hBMSC. DNA microarray global gene expression profiling supported this hypothesis, which revealed significant dysregulation of some ostogenesis and adipogenesis-related pathways and inflammatory pathways, including IL-3 signaling pathway, IL-4 signaling pathway and inflammatory response pathway in CM-treated hBMSC+Bone cells.
We have previously demonstrated the role of SERPINB2-mediated TGFβ and NOG-mediated BMP signaling pathways in rescuing the functional phenotype of hBMSC−Bone by directing them to commit into osteoblasts and adipocytes lineages [Citation30,Citation34]. The enhancement effect of TGFβ on hBMSC differentiation into osteoblasts ex vivo is mediated by binding to two cell-surface serine/threonine kinase receptors (type I and II), which then leads to SMAD2/3 phosphorylation [Citation28–30,Citation35,Citation36]. Several studies have reported the inhibition effect of inflammatory microenvironments on BM-MSC’s osteogenic potential [Citation32,Citation37–39]. It is well known that inflammatory cytokines play an essential role as negative modulators of osteogenesis and bone formation [Citation40]. Numerous studies have demonstrated the inhibitory impact of IL-1β on MSC differentiation into osteoblasts and migration and down-regulation of osteoblastic-related gene expression [Citation38,Citation41–43]. IL1β, a pleiotropic cytokine that mediates inflammation and the innate immune system, enhances bone resorption by stimulating osteoclast activation by inducing RANKL expression due to its mediating action by TNF-α [Citation41].
Furthermore, BMP2 suppressed the synthesis of IL-1β in bone marrow cultures, suggesting that BMP2 exerts direct effects on osteogenesis and indirectly hampers the regulation of the inflammatory cytokine production in bone microenvironment [Citation44]. Additional evidence for the role of IL-1β in mediating the adverse effects on osteoblast differentiation and bone formation have been reported. For example, IL-1β upregulates the chemokine CXCL13 in osteoblasts obtained from both osteoarthritis and post-traumatic patients [Citation45] and induces CD200, leading to downregulation of several osteoblastic gene markers [Citation46]. Also, IL-1β impairs Wnt signaling known to be critical for bone formation [Citation47]. A recent study showed that low doses of IL-1β enhance osteogenesis of periodontal ligament stem cells (PDLSCs) by activating BMP/SMAD signaling pathway. In contrast, high dose of IL-1β suppresses osteogenesis by inhibiting BMP/SMAD signaling and at the same time high dose of IL1β activates nuclear factor-κB (NF-κB) and mitogen-activated protein kinase (MAPK) signaling [Citation42].rhIL-1 sRI is a potent antagonist of IL-1 action, and its gene is expressed by bone marrow stromal cells under the influence of TNF and IL-1β [Citation41]. IL-1 RI is expressed at low BM-MSC levels and its expression is increased in mature osteoblasts, suggesting that osteoblast differentiation requires down-regulation of IL-1β signaling [Citation45]. Also, rhIL-1 sRI suppresses the ability of IL-1 to enhance bone resorption in organ cultures [48]. The decoy receptor IL-1 RI rescued the functional phenotype of hBMSC−Bone cell proliferation and differentiation into osteoblasts and up-regulated TGFβ responsive genes (TAGLN, ACTA2, TPM1 and BMP2) (). Simultaneously, down-regulated SERPINB2 acted as a blocker of TGFβ’s effects on hBMSC differentiation and the inflammatory cytokines CXCL3, and CXCL6. On the other hand, we used IL-1β to mimic the inflammatory microenvironment to confirm the inflammatory effect of IL1β on the biological function of hBMSC+Bone, which showed an opposite effect of rhIL-1 sRI on hBMSC−Bone cells (). These data suggested the implication of the inflammatory inhibitory effect of IL-1β on the TGFβ signaling pathway and thus regulating the osteogenic differentiation of hBMSC ().
Based on our data we proposed a schematic model highlighting the biological effect of IL-1β and its inhibitor on hBMSC differentiation into osteoblasts, in which IL-1β treatment suppresses TGFβ/SMAD signaling to inhibit the osteogenic differentiation of hBMSC+Bone, whereas rhIL-1 sRI treatment induces TGFβ signaling pathway, which generates signals strong enough to enhance the phosphorylation of SMAD2 and thus rescue the functional phenotype of hBMSC−Bone differentiation into osteoblasts. In this model, a balance between IL-1β and IL1RA in bone microenvironment can determine osteoprogenitor cells’ osteoblast differentiation through modulating TGFb signaling. This model can be employed to enhance osteoblast differentiation of osteoprogenitor cell population prior to their use in regenerative medicine protocols and provide a molecular mechanism underlying the interactions between osteoblast differentiation and inflammatory microenvironment.
Conclusions
The results showed for the first time that IL-1β-mediated TGFβ signaling pathway inactivation results in impaired ex vivo osteogenic differentiation by suppressing SMAD2 phosphorylation. Understanding the molecular mechanism underlying the mutual interactions between MSC and the inflammatory microenvironment is a promising tool for the clinical potential of hBMSC for therapeutic use.
Supplemental Material
Download MS Excel (80 KB)Supplemental Material
Download MS Excel (76.3 KB)Data availability statement
All data that support the findings reported in this study are available from the corresponding author (A.M.) upon reasonable request.
Disclosure statement
The authors declare no conflict of interest.
Funding
This work was funded by the National Plan for Science, Technology and Innovation (MAARIFAH), King Abdul-Aziz City for Science and Technology, Kingdom of Saudi Arabia, grant Number 10-BIO1308-02.
Related Research Data
References
- Kyurkchiev D, Bochev I, Ivanova-Todorova E, et al. Secretion of immunoregulatory cytokines by mesenchymal stem cells. World J Stem Cells. 2014;6(5):552–570.
- Lorenzo J, Horowitz M, Choi Y. Osteoimmunology: interactions of the bone and immune system. Endocr Rev. 2008;29(4):403–440.
- Phinney DG, Prockop DJ. Concise review: mesenchymal stem/multipotent stromal cells: the state of transdifferentiation and modes of tissue repair-current views. Stem Cells. 2007;25(11):2896–2902.
- Al-Nbaheen M, Vishnubalaji R, Ali D, et al. Human stromal (mesenchymal) stem cells from bone marrow, adipose tissue and skin exhibit differences in molecular phenotype and differentiation potential. Stem Cell Rev Rep. 2013;9(1):32–43.
- Abdallah BM, Haack-Sørensen M, Burns JS, et al. Maintenance of differentiation potential of human bone marrow mesenchymal stem cells immortalized by human telomerase reverse transcriptase gene despite [corrected] extensive proliferation. Biochem Biophys Res Commun. 2005;326(3):527–538.
- Sobacchi C, Palagano E, Villa A, et al. Soluble factors on stage to direct mesenchymal stem cells fate. Front Bioeng Biotechnol. 2017;5:32.
- Chamberlain G, Fox J, Ashton B, et al. Concise review: mesenchymal stem cells: their phenotype, differentiation capacity, immunological features, and potential for homing. Stem Cells Dayt Ohio. 2007;25(11):2739–2749.
- Kristensen LP, Chen L, Nielsen MO, et al. Temporal profiling and pulsed SILAC labeling identify novel secreted proteins during ex vivo osteoblast differentiation of human stromal stem cells. Mol Cell Proteom. 2012;11(10):989–1007.
- Jafari A, Qanie D, Andersen TL, et al. Legumain regulates differentiation fate of human bone marrow stromal cells and is altered in postmenopausal osteoporosis. Stem Cell Rep. 2017;8(2):373–386.
- Severino V, Alessio N, Farina A, et al. Insulin-like growth factor binding proteins 4 and 7 released by senescent cells promote premature senescence in mesenchymal stem cells. Cell Death Dis. 2013;4:e911.
- Gnecchi M, Melo LG. Bone marrow-derived mesenchymal stem cells: isolation, expansion, characterization, viral transduction, and production of conditioned medium. Methods Mol Biol Clifton NJ. 2009;482:281–294.
- Kuljanin M, Bell GI, Sherman SE, et al. Proteomic characterisation reveals active Wnt-signalling by human multipotent stromal cells as a key regulator of beta cell survival and proliferation. Diabetologia. 2017;60(10):1987–1998.
- Danieli P, Malpasso G, Ciuffreda MC, et al. 2016. Testing the paracrine properties of human mesenchymal stem cells using conditioned medium. In: Gnecchi M, editor. Mesenchymal stem cells: methods and protocols. New York, NY: Springer New York. p. 445–456.
- Hering S, Isken E, Knabbe C, et al. TGFbeta1 and TGFbeta2 mRNA and protein expression in human bone samples. Exp Clin Endocrinol Diabetes. 2001;109(4):217–226.
- Sheppard D. Transforming growth factor beta: a central modulator of pulmonary and airway inflammation and fibrosis. Proc Am Thorac Soc. 2006;3(5):413–417.
- Massagué J, Xi Q. TGF-β control of stem cell differentiation genes. FEBS Lett. 2012;586(14):1953–1958.
- Li MO, Flavell RA. TGF-beta: a master of all T cell trades. Cell. 2008;134(3):392–404.
- Garlanda C, Dinarello CA, Mantovani A. The interleukin-1 family: back to the future. Immunity. 2013;39(6):1003–1018.
- Lee S-K, Gardner AE, Kalinowski JF, et al. RANKL-stimulated osteoclast-like cell formation in vitro is partially dependent on endogenous interleukin-1 production. Bone. 2006;38(5):678–685.
- Elsafadi M, Manikandan M, Atteya M, et al. Characterization of cellular and molecular heterogeneity of bone marrow stromal cells. Stem Cells Int. 2016;2016:9378081.
- Hildebrand A, Romarís M, Rasmussen LM, et al. Interaction of the small interstitial proteoglycans biglycan, decorin and fibromodulin with transforming growth factor beta. Biochem J. 1994;302(Pt 2):527–534.
- Serra R, Chang C. TGF-beta signaling in human skeletal and patterning disorders. Birth Defects Res C Embryo Today. 2003;69(4):333–351.
- Gregory CA, Gunn WG, Peister A, et al. An Alizarin red-based assay of mineralization by adherent cells in culture: comparison with cetylpyridinium chloride extraction. Anal Biochem. 2004;329(1):77–84.
- Jurmeister S, Baumann M, Balwierz A, et al. MicroRNA-200c represses migration and invasion of breast cancer cells by targeting actin-regulatory proteins FHOD1 and PPM1F. Mol Cell Biol. 2012;32(3):633–651.
- Simonsen JL, Rosada C, Serakinci N, et al. Telomerase expression extends the proliferative life-span and maintains the osteogenic potential of human bone marrow stromal cells. Nat Biotechnol. 2002;20(6):592–596.
- Larsen KH, Frederiksen CM, Burns JS, et al. Identifying a molecular phenotype for bone marrow stromal cells with in vivo bone-forming capacity. J Bone Miner Res off J Am Soc Bone Miner Res. 2010;25:796–808.
- Elsafadi M, Manikandan M, Almalki S, et al. TGFβ1-induced differentiation of human bone marrow-derived MSCs is mediated by changes to the actin cytoskeleton. Stem Cells Int. 2018;2018:6913594.
- Elsafadi M, Manikandan M, Dawud RA, et al. Transgelin is a TGFβ-inducible gene that regulates osteoblastic and adipogenic differentiation of human skeletal stem cells through actin cytoskeleston organization. Cell Death Dis. 2016;7(8):e2321.
- Elsafadi M, Manikandan M, Atteya M, et al. SERPINB2 is a novel TGFβ-responsive lineage fate determinant of human bone marrow stromal cells. Sci Rep. 2017;7(1):10797.
- Platas J, Guillén MI, del Caz MDP, et al. Conditioned media from adipose-tissue-derived mesenchymal stem cells downregulate degradative mediators induced by interleukin-1β in osteoarthritic chondrocytes. Mediators Inflamm. 2013;2013:357014.
- Bian Z-Y, Fan Q-M, Li G, et al. Human mesenchymal stem cells promote growth of osteosarcoma: involvement of interleukin-6 in the interaction between human mesenchymal stem cells and Saos-2. Cancer Sci. 2010;101(12):2554–2560.
- Twine NA, Harkness L, Adjaye J, et al. Molecular phenotyping of telomerized human bone marrow skeletal stem cells reveals a genetic program of enhanced proliferation and maintenance of differentiation responses. JBMR Plus. 2018;2(5):257–267.
- Elsafadi M, Shinwari T, Al-Malki S, et al. Convergence of TGFβ and BMP signaling in regulating human bone marrow stromal cell differentiation. Sci Rep. 2019;9(1):4977.
- Kolosova I, Nethery D, Kern JA. Role of Smad2/3 and p38 MAP kinase in TGF-β1-induced epithelial-mesenchymal transition of pulmonary epithelial cells. J Cell Physiol. 2011;226(5):1248–1254.
- Heldin CH, Miyazono K, ten Dijke P. TGF-beta signalling from cell membrane to nucleus through SMAD proteins. Nature. 1997;390(6659):465–471.
- Park J-C, Kim J-M, Jung I-H, et al. Isolation and characterization of human periodontal ligament (PDL) stem cells (PDLSCs) from the inflamed PDL tissue: in vitro and in vivo evaluations. J Clin Periodontol. 2011;38(8):721–731.
- Kong X, Liu Y, Ye R, et al. GSK3β is a checkpoint for TNF-α-mediated impaired osteogenic differentiation of mesenchymal stem cells in inflammatory microenvironments. Biochim Biophys Acta. 2013;1830(11):5119–5129.
- Tu B, Peng Z-X, Fan Q-M, et al. Osteosarcoma cells promote the production of pro-tumor cytokines in mesenchymal stem cells by inhibiting their osteogenic differentiation through the TGF-β/Smad2/3 pathway. Exp Cell Res. 2014;320(1):164–173.
- Schett G. Effects of inflammatory and anti-inflammatory cytokines on the bone. Eur J Clin Invest. 2011;41(12):1361–1366.
- Wei S, Kitaura H, Zhou P, et al. IL-1 mediates TNF-induced osteoclastogenesis. J Clin Invest. 2005;115(2):282–290.
- Mao C-y, Wang Y-g, Zhang X, et al. Double-edged-sword effect of IL-1β on the osteogenesis of periodontal ligament stem cells via crosstalk between the NF-κB, MAPK and BMP/Smad signaling pathways. Cell Death Dis. 2016;7:e2296.
- Polzer K, Joosten L, Gasser J, et al. Interleukin-1 is essential for systemic inflammatory bone loss. Ann Rheum Dis. 2010;69(1):284–290.
- Gorskaya YF, Danilova TA, Mezentseva MV, et al. Effect of BMP-2 protein on the count and osteogenic properties of multipotent stromal cells and expression of cytokine genes in primary cultures of bone marrow and spleen cells from CBA mice immunized with bacterial antigens. Bull Exp Biol Med. 2013;155(5):650–654.
- Lisignoli G, Cristino S, Toneguzzi S, et al. IL1beta and TNFalpha differently modulate CXCL13 chemokine in stromal cells and osteoblasts isolated from osteoarthritis patients: evidence of changes associated to cell maturation. Exp Gerontol. 2004;39(4):659–665.
- Pontikoglou C, Langonné A, Ba MA, et al. CD200 expression in human cultured bone marrow mesenchymal stem cells is induced by pro-osteogenic and pro-inflammatory cues. J Cell Mol Med. 2016;20(4):655–665.
- Martino MM, Maruyama K, Kuhn GA, et al. Inhibition of IL-1R1/MyD88 signalling promotes mesenchymal stem cell-driven tissue regeneration. Nat Commun. 2016;7:11051.
- Seckinger P, Klein-Nulend J, Alander C, et al. Natural and recombinant human IL-1 receptor antagonists block the effects of IL-1 on bone resorption and prostaglandin production. J Immunol Baltim Md. 1990;145:4181–4184. 1950