
Abstract
Einkorn (Triticum monococcum L. ssp. monococcum) is an ancient diploid wheat species with many useful traits and used as a wheat gene discovery model. In this research, a total of 41 diploid and tetraploid wheat accessions were tested using simple sequence repeat (SSR) markers. A total of 33 genotypes of T. monococcum along with four genotypes each of tetraploid wheat (T. dicoccon and T. durum) were used as plant material. The analysis utilized 10 polymorphic markers, including a total number of 41 alleles with an average frequency of 4.1 alleles per locus during exploration of the level of genetic variations. Various diversity analyses, which are the effective number of alleles (Ne), gene diversity (h), Polymorphic Information Content (PIC), and Shannon’s information index (I), were performed for 10 ‘A’ genome wheat SSR markers. The results showed a narrow variation in einkorn genotypes, supported by Analysis of Molecular Variance (AMOVA), with 66% maximum variation in all genotypes. The structure analysis divided the whole germplasm into two populations. A dendrogram was constructed to determine the genetic similarities using the unpaired group method with arithmetic averages (UPGMA), which separated tetraploid wheat from other genotypes/accessions. Principal Coordinate Analysis (PCoA) co-supported the clustering of UPGMA and structure by differentiating the diploid and tetraploid wheat. These findings will help understand the genetic relationships among these wheat accessions and their use in breeding programs in the future works.
Introduction
The diploid (Triticum monococcum L., 2n = 14) also known as Einkorn or Siyez in Turkey, and tetraploid (T. dicoccon) are the two oldest hulled wheat species. They were firstly domesticated in the Anatolia (present-day Turkey), and both of them are considered among the ancestors of modern wheat. They are also known as a bridge between cultivated and wild wheat species [Citation1]. Both einkorn and emmer wheat populations have been cultivated in rural areas of several provinces in Turkey till today.
Siyez was domesticated from a wild progenitor T. boeoticum [Citation2]. It originated in the Neolithic period ∼10,000 years ago [Citation3] at Karaca mountains in Tigris-Euphrates valley of the Fertile Crescent in the South East of modern-day Turkey [Citation4–6]. This area is considered the main area in the domestication, and later this species spread to the Caucasia, Turkmenistan, the Middle-East, the Balkans, Central Germany and the Mediterranean region (Italy, Spain) of Europe [Citation6, Citation7].
Furthermore, tetraploid wheat (T. dicoccum), (named Gernik in Turkey), was domesticated from wild Emmer progenitor (T. dicoccoides Koern.) and was the first domesticated wheat species [Citation8]. Tetraploid Emmer wheat was domesticated at a highly debated site, the upper Jordan River valley, either in the same era of T. monococcum or slightly later [Citation9].
Studies have shown that Turkish populations of T. dicoccoides wheat are morphologically and phenologically similar in population structure to the populations mentioned above, as verified by allozyme based on similarity tests [Citation10, Citation11]. T. dicoccum wheat Gernik populations was firstly found at Cayonu excavation [Citation1].
The end products from T. monococcum and T. dicoccon could be considered as organic and healthy food due to high nutritional value, resistance against the number of pests and diseases, lodging and drought resistance with acceptable yields on poor soils; where other species of wheat fail to grow [Citation12, Citation13]. Whereas, T. monococcum besides acting as a good source of many essential alleles in wheat, also serves as a source of variation present only in this species.
Unlike T. dicoccum, it also provides genes for resistance against leaf rust and adaptation to low and poor-input agriculture with high-quality traits for Zn, Fe, Mn, Cu, Mg, P, microelements uptake, and the genes responsible for the formation of carotenoids, tocols, conjugated phenolics, alkylresorcinols and phytosterols with rare glutenin subunits (HMW-GS) [Citation14–20]. They also prevent pre-harvest sprouting [Citation21] and increase zinc uptake efficiency [Citation22–24]. So variation in numerous traits in the diploid Siyez wheat is worthy of exploitation for genetic improvement [Citation25–27] because it is almost untouched since bronze age to the present time without conscious human selection or has not suffered a reduction of its diversity during domestication [Citation28]. Wheat breeders are continuously working to improve wheat grain yield with better quality and resistance against various types of biotic and abiotic stress around the world [Citation16, Citation29]. It is crucial to estimate genetic variation and inheritance modes to start productive wheat breeding [Citation30].
The T. monococcum genome is under-represented in hexaploid wheat. The exploitation of genetic diversity in T. monococcum genome could serve as a novel source of discovering new and additional traits in breeding and genetic improvement of tetraploid and hexaploid varieties [Citation26, Citation31].
In line with the above information, there is a need to identify and compare genetic variations in Siyez populations at its first Centre of Diversity (Karaca Mountains) and first areas of its spread within Turkey like Provinces of Kastamonu, Bolu, Sinop, Balikesir, Bilecik, and Cankiri [Citation32]. Knowledge of distribution and genetic variation in endemic Siyez wheat populations is fundamental to breeders to enrich the genetic base for modern wheat [Citation33, Citation34] that might provide useful sources of genetic variability in several beneficial traits [Citation29]. Therefore, the knowledge of genetic diversity in a germplasm collection will significantly impact wheat breeding [Citation26].
Germplasm characterization is considered a prerequisite for breeding by providing novel information that can be used for future breeding activities [Citation35, Citation36]. Molecular markers can provide opuurtunities to detect precise genetic diversity among different cultivated and wild wheat species with different ploidy levels [Citation37–39]. Studies have shown that highly polymorphic Simple Sequence Repeats (SSRs), or Microsatellite markers, with multi-allelic nature and genome specificity are the most suitable for studying genetic wheat diversity and evolution analyses in the wheat population [Citation40–42]. Genetic variability of diploid and tetraploid wheat from Karaca mountains and many varieties growing in diverse regions of Turkey regions have not been well investigated to date [Citation43, Citation44]. Therefore, the study aimed to identify molecular characteristics of different Gernik (T. dicoccum) and Siyez (T. monococcum) diploid and tetraploid wheat genotypes of diverse origin in Turkey.
Materials and methods
Plant material
A total of 32 Siyez (T. monococcum) landraces from 11 geographically different provinces (Karabük, Samsun, Eskişehir, Çankırı, Kastamonu, Sinop, Aksaray, Nevşehir, Gaziantep, Kars and Kayseri), along with 4 landraces of Gernik species (Triticum dicoccum) were collected from south and north-western Turkey, and four commercial cultivars of Triticum durum were obtained from the Central Field Crops Research Institute, Ankara, Turkey and registered in the National Gene Bank of the same Institute for assesment of phylogenetic relationships among them ( and ).
Figure 1. The Turkish provinces where the Siyez (T. monococcum) experimental accessions were collected from.
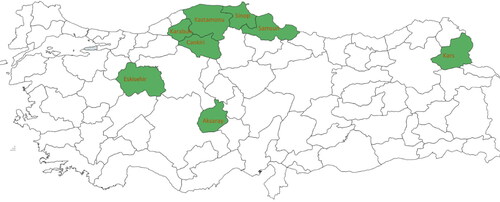
Table 1. Accessions and geographical identity of diploid and tetraploid wheat accessions used in this study.
SSR markers analysis
The seeds of each wheat accession were sown into pots under greenhouse conditions. Genomic DNA was extracted from the bulk of 5 young and fresh leaves (three-week-old seedlings) using a Roche Magna Lyser homogenizer following the ‘Biotecon Foodproof D.N.A. Isolation Kit’. The DNA concentrations were quantified with NanoDrop (NanoDrop™ OneC) and diluted to 20 ng/μl for further use in PCR.
Ten (10) SSR markers represented by chromosome wheat A genome were described by Röder et al. [Citation42] and used for polymerase chain reaction (PCR) amplifications, to asses the genetic diversity among the genotypes [Citation42]. These primers were selected to produce strong bands and very high discrimination and polymorphism (). Each reaction contained 20 ng/μL of template DNA, PCR Master Mix (2×) followed by, 2 μmol/L of each primer. The PCR conditions were 3 min at 94 °C initial denaturation, followed by 35 cycles of denaturation at 94 °C for 1 min, and annealing temperature of 50–65 °C (depending on the SSR markers) for 1 min, ending with an extension of 72 °C for 7 min. The total concentration of 20 μL PCR amplifications contained 20 ng/μL genomic DNA templates from wheat accessions, PCR Master Mix (2×) following the instruction manual, 2 μmol/L of each primer. The PCR products fragmantation and bands were separated using electrophoresis in 3% (w/v) of Nusieve 3:1 agarose and two-thirds of MetaPhor agarose (Cambrex Bio Science, Rockland, ME, USA). Using 1 × TBE buffer containing 1 mL RedSafe Nucleic Acid Staining Solution for detection of fragments for 1.5 h; after the electrophoresis, visualized and photographed under a UV Imager (Kodak GelLogic 200 Image System) ().
Figure 2. PCR amplification profile of SSR marker Xgwm666 in diploid and tetraploid wheat accessions. Lanes 1–41, samples from the geographical identities according to . Molecular size marker (GeneRuler 100 bp DNA Ladder, ThermoFischer Scientific Waltham, Massachusetts, USA).
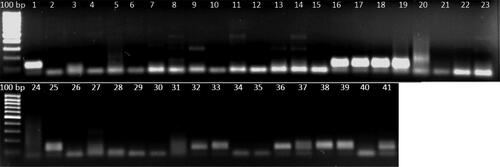
Table 2. The SSR markers used for genetic diversity assessment of wheat accessions used in the study.
Data analysis
Only strong, clear and reproducible amplifiable products were considered for analysis. Each informative allele was scored individually as 1, for the presence and 0 for the absence. To reveal the genetic variations among diploid and tetraploid wheats, various diversity indices like effective number of alleles (Ne), Shannon’s Information Index (I) and gene diversity were calculated for each locus using GenAlEx v6.5 [Citation45]. The same software was also used for the analysis of molecular variance (AMOVA) and principal coordinate analysis (PCoA). The mean polymorphism information contents (PIC) for each selected primer were calculated as described by Roldan-Ruiz et al. [Citation46](2000).
The data in the similarity matrix was used for cluster analysis using UPGMA (Unweighted Pair-Group Method with arithmetic averages). The dendrograms were created using the SAHN module of NTSYS-PC 2.02e software [Citation47]. Jaccard’s coefficient was used to calculate the genetic similarities (GS) for pair-wise comparison of genotypes based on SSR data [Citation48]. A similarity matrix was generated according to Simple Match (SM) coefficients [Citation49]. The cophenetic correlation coefficient (r) between the observed distances and the dendrogram was 0.75, indicating a good fit between observed distances and the dendrogram.
The model-based Bayesian cluster software was applied in STRUCTURE 2.3.4 and [Citation50]. We followed the criteria suggested by Evanno et al. [Citation51] and plotted the number of clusters (K) against logarithm probability relative to standard deviation (ΔK) for the determination of a suitable number of clusters (number of K; number of subpopulations) in the STRUCTURE analysis.
Results
SSR analysis of wheat accessions as assesment in genetic diversity
The genetic diversity of 41 wheat accessions within three different species (T. monococcum, T. dicoccum and T. durum) was analyzed using 10 most polymorphic A genome-specific SSR selected markers [Citation42]. Allten Xgwm markers were used in this study that were polymorphic and produced scorable clear bands representing a total of 41 alleles per primer, with an average of 4.1 alleles per primer (). The highest number of alleles was observed a with number of 5 in xgwm 570, xgwm617 and xgwm666, while the lowest number of alleles (3) were detected in primers xgwm71 and xgwm 635. The PI values of 10 SSR loci ranged 0.15 in Xgwm 136 to 0,56 in Xgwm 296 primers. The polymorphism information content (PIC) values varied broadly, between 0.69 for primer Xgwm296 to 0.98 for primer Xgwm136 among the 10 A genome specific SSR primers (). The effective number of alleles (Ne) per marker were 1.2622 (Xgwm 312) to 1.6221 (Xgwm 136), and the mean values for gene diversity (h) were calculated in the range of 0.1975–0.3718, the lowest being Xgwm312, and Xgwm 136 being the most polymorphic primer, respectively. Shannon’s information index (I) per marker ranged from 0.2974 to 0.5557, which were determined in Xgwm 312 and Xgwm136, respectively ().
Table 3. Various diversity indices for three different wheat species using 10 SSR primers.
Among all the SSR primers used in this study, the primer Xgwm136 had the highest PIC, with 0.98, effective number of alleles (Ne) with 1.6221, Nei’s gene diversity (h), 0.3718 and Shannon’s information index (I) with 0.5557. All SSR markers used in this study produced PIC value > 0.69.
To explore the level of variations, various diversity indices were also calculated on a population basis (). T. monococcum was found more diverse as it reflected maximum values for the calculated diversity indices like polymorphic loci (6.98), number of effective alleles (0.243), expected heterozygosity (0.156) and unbiased expected heterozygosity (0.158). Minimum variations were reflected by T. durum.
Table 4. Diversity indices among three wheat populations using 10 SSR primers.
The genetic distance was also calculated and the maximum genetic distance was noted between T. monococcum and T. durum to explore the relationship among wheat populations ().
Table 5. Nei’s genetic distance among three wheat populations.
Analysis of molecular variance (AMOVA) was performed to reveal the variations, and the results showed maximum variations (66%) in the studied germplasm ().
Table 6. Analysis of molecular variance (AMOVA) for studied germplasm.
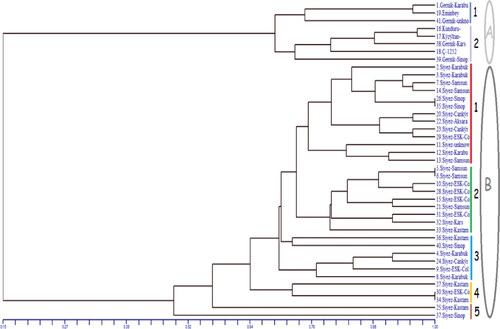
UPGMA dendrogram based on the genetic similarity coefficient among genotypes grouped all genotypes into two main clusters with a similarity index of 0.15 () based on diploid and tetraploid wheat species according to A genome phylogenetics. Cluster I grouped all tetraploid wheats, including T. dicoccum and T. durum genotypes. Cluster II grouped all genotypes belonging to T. monococcum.
Figure 3. UPGMA based clustering of three different wheat species (T. monococcum, T. dicoccum, T. durum).
To identify the likelihood and favourable populations (delta K), the output files from Structure software were uploaded for analysis using the online software Structure Harvester, that confirmed the presence of two populations (K = 2; ). A total of 33 accessions of T. monococcum were clustered in Cluster I (red), while T. dicoccon and T. durum were present in Cluster II (green) (). PCoA was performed to confirm the results of UPGMA and STRUCTURE, and the results showed that the Einkorn genotypes formed their separate group, while T. durum and T. dicoccum were present close to each other ().
Figure 4. Delta K revealing number of populations from population structure analysis.
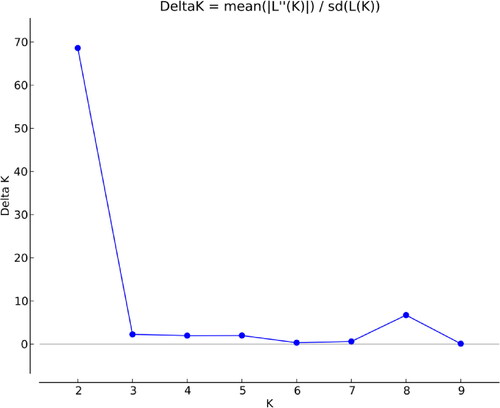
Figure 5. Population structure of three different wheat species (T. monococcum, T. dicoccum, T. durum).
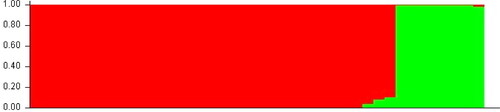
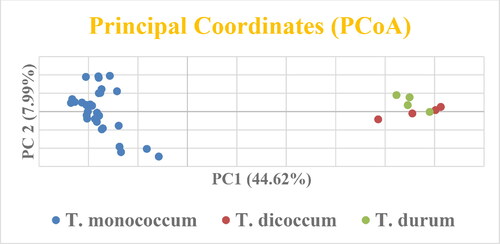
Figure 6. Principal Coorddinates Analysis of three different wheat species (T. monococcum, T. dicoccum, T. durum).
Discussion
T. monococcum (Siyez) from the Karacadağ and T. dicoccum (Gernik) from the Kars regions are considered the most ancient wheat that was first domesticated in Turkey [Citation1]. The genetic diversity in this region of the gene pool, (the wheat’s first domesticated centre), is essential for deciphering the chain of events during adaptation against unfavourable biotic stresses like diseases and pest resistance [Citation55]. These substantial biotic stresses are known to lower the grain quality traits during modern cultivars breeding [Citation56, Citation57]. The study investigated the inter and intra genotypic polymorphism among einkorn, T. dicocum and T. durum genotypes by comparing their loci with A genome-based markers. Additionally, there are very few studies on Turkish hulled einkorn and emmer wheat at the molecular level [Citation9, Citation55]. Microsatellite markers selected in this study are codominant inheritance markers characterized by high polymorphism and wide distribution, with advantages of high sensitivity and reproducibility. These markers are considered powerful and informative tools in many plant species, including wheat, due to their highly accurate detection variability in genetic diversity estimates [Citation58–62]. The 10 most polymorphic SSR markers were applied for the clustering of genotypes in this research, as Gurcan et al. [Citation55] used the 10 most polymorphic SSR markers, including Xgwm 312 markers in their study. All selected markers had 69–94% PIC values with an average value of 0.86. These results showed a higher PIC value in A drive genome markers than the value of 0.71 as noted by Ahmed et al. [Citation58]. Previous studies show that when the PIC > 0.5, the marker has the maximum diversity, indicating high allelic diversity among germplasms. Contrarily when PIC < 0.25, the marker has minimum diversity [Citation63, Citation64]. Thus, these results with an average PIC value of 0.86 indicate a sufficient amount of gene variability and diversity among accessions [Citation65]. This study demonstrated a narrow genetic diversity within T. monococcum and T. diccocum accessions, respectively, with values close to 0.4 and 0.3 in the construct. The A genomes of T. monococcum and T. diccocum are significantly different and have the least similarity, in agreement with Korzun et al. [Citation66] and Jing et al. [Citation26]. The results confirmed that these plant species growing over a number of years in different regions did not show significant genetic changes compared to their parent, which is in agreement with Zohary and Hopf [Citation34]. Various diversity indices were calculated to explore the level of genetic diversity in diploid and tetraploid wheat. Einkorn wheat reflected higher values for all diversity indices compared to tetraploid wheat. Moreover, the genetic distance among diploid and tetraploid wheat was also calculated, and the minimum genetic distance was present between tetraploid wheat (T. diococcum and T. durum). Analysis of molecular variance (AMOVA) was performed by considering within- and between-population components. The AMOVA results revealed higher variations (66%) among the populations and showed a lesser level of variations within the population. Being diploid and tetraploid, wheat were genetically distant from each other and this reflected the extent of genetic similarity among the populations. Therefore, AMOVA showed higher population genetic variations among the genotypes. To explore the genetic relationship among three wheat species, UPGMA based clustering was performed to separate the diploid and tetraploid genotypes clearly under two groups, and the members of each group had relatively close relationships among each other. It was observed that T. durum and T. dicoccum were grouped in the same cluster (Cluster I) by reflecting their genetic similarity with each other, as they are tetraploid wheat species. A total of eight genotypes belonging to T. dicoccum and T. durum were present in Cluster I. This cluster was further divided into two subgroups: Subgroup I consisting of three samples, two Gernik belonging to T. dicoccum, and one Emin bey belonging to T. durum. Besides, Kunduru, Kiziltan Gernik (Kars), C-1252 belonging to T. durum and one Gernik (Sinop) belonging to T. dicoccum genotypes classified into Subgroup II.
In this study, a total of 33 einkorn genotypes were present in Cluster II. It was further subdivided into five subgroups. Subgroup I was the largest subgroup in this cluster. However, all 33 einkorn genotypes used in this study belonged to six different groups: Çankırı, ESK-Collect (Eskisehir), Karabuk, and Kars Kastamonu, Samsun, Sinop region. Furthermore, 22 out of 33 of these genotypes could be accommodated into two subgroups with a similarity of 0.74. Therefore, our results showed that these genotypes are more similar to each other. Maximum genetic similarity was observed for both Siyez 26 – Siyez 35 and Siyez 5 – Siyez 6 from Sinop and Samsun regions, respectively. Indeed, these two regions are geographically neighbouring on the map.
STRUCTURE software was used for investigating the population structure of three wheat species, and the whole germplasm was grouped into two populations. The STRUCTURE algorithm supported the findings of UPGMA by clearly separating the diploid and tetraploid genotypes. All 33 einkorn genotypes were present in Cluster I, while T. dicoccon and T. durum were clustered together under cluster II (). Principal Coordinate Analysis (PCoA) is performed to graphically represent the similarity/dissimilarity between individuals or populations. In this study, PCoA was also performed to check the clustering of UPGMA and structure algorithms. PCoA differentiated the diploid and tetraploid wheat and supported the findings of UPGMA and structure algorithms (). All einkorn genotypes made their separate group, while T diococcum and T. durum were present close to each other. The genetic distance among the populations also revealed the existence of lower genetic distance (0.061) between T. diococcum and T. durum. As tetraploid wheat was more genetically similar compared to einkorn, they were present close to each other in all three (UPGMA, STRUCTURE, PCoA) clustering algorithms.
Conclusions
This study explored the genetic diversity in diploid and tetraploid wheat comprehensively. Einkorn wheat reflected a higher level of genetic diversity for calculated diversity indices and confirmed its potential for wheat breeding. The results of AMOVA revealed the existence of higher genetic diversity among two populations. All three clustering algorithms differentiated the diploid and tetraploid wheat based on their genetic makeup. We believe that the findings of this study will help understand the genetic relationships among various wheat species.
Data availability
All data that support the findings reported in this study are available from the corresponding author upon request.
Disclosure statement
No potential conflict of interest was reported by the authors.
Correction Statement
This article has been republished with minor changes. These changes do not impact the academic content of the article.
Additional information
Funding
References
- Harlan JR. 1995. The living fields: our agricultural heritage. Cambridge: Cambridge University Press.
- Dvorák J, Terlizzi P, Zhang HB, et al. The evolution of polyploid wheats: identification of the a genome donor species. Genome. 1993;36(1):21–31.
- Heun M, Schäfer-Pregl R, Klawan D, et al. Site of einkorn wheat domestication identified by DNA fingerprinting. Science. 1997;278(5341):1312–1314.
- Abbo S, Lev-Yadun S, Gopher A. Origin of near Eastern plant domestication: Homage to claude Levi-Strauss and “La pensée sauvage”. Genet Resour Crop Evol. 2011;58(2):175–179.
- Haldorsen S, Akan H, Çlik B, et al. The climate of the younger dryas as a boundary for einkorn domestication. Veget Hist Archaeobot. 2011;20:305–318. DOI
- Zaharieva M, Monneveux P. Cultivated einkorn wheat (Triticum monococcum L. subsp. monococcum): the long life of a founder crop of agriculture. Genet Resour Crop Evol. 2014;61(3):677–706.
- Løje H, Møller B, Laustsen AM, et al. Chemical composition, functional properties and sensory profiling of einkorn (Triticum monococcum L.). J Cereal Sci. 2003;37(2):231–240.
- Aaronsohn A. Agricultural and botanical exploration in palestine. Bull. Bur. Pl. Industr. U. S. D. A. 1910;180:1–64.
- Ozkan B, Ceylan RF, Kizilay H. Comparison of energy inputs in glasshouse double crop (fall and summer crops) tomato production. Renew. Energy. 2011;36(5):1639–1644.
- Nevo E, Beiles A. Genetic diversity of wild emmer wheat in Israel and Turkey. Theoret Appl Genetics. 1989;77(3):421–455.
- Nevo E, Beiles A, Kaplan D. Genetic diversity and environmental associations of wild emmer wheat in Turkey. Heredity. 1988;61(1):31–45.
- 12. Padulosi S., Hammer K., Heller J., editors. 1996. Hulled wheats, promoting the conservation and used of underutilized and neglected crops. IPGRI, Rome, 262. p.
- Zhukovsky PM. 1964. Kulturnye rasteniya i ikh sorodichi. [Cultivated plants and their relatives]. Lausanne Switzerland: Kolos, Leningrad, 791 p (in Russian).
- Hidalgo A, Brandolini A . Nutritional properties of einkorn wheat (Triticum monococcum L.). J Sci Food Agric. 2014;94(4):601–612.
- Feuillet C, Travella S, Stein N, et al. Map-based isolation of the leaf rust disease resistance gene Lr10 from the hexaploid wheat (Triticum aestivum L.) genome. Proc Natl Acad Sci U S A. 2003;100(25):15253–15258.
- Lebedeva TV, Peusha HO. Genetic control of the wheat Triticum monococcum L. resistance to powdery mildew. Russ J Genet. 2006;42(1):60–66.
- Shi AN, Leath S, Murphy JP. A major gene for powdery mildew resistance transferred to common wheat from wild einkorn wheat. Phytopathology. 1998;88(2):144–147.
- Sodkiewicz W, Strzembicka A. Application of Triticum monococcum for the improvement of triticale resistance to leaf rust (Puccinia triticina). Plant Breed . 2004;123(1):39–42.
- Stein N, Feuillet C, Wicker T, et al . Subgenome chromosome walking in wheat: a 450-kb physical contig in Triticum monococcum L. spans the Lr10 resistance locus in hexaploid wheat (Triticum aestivum L.). Proc Natl Acad Sci U S A. 2000;97(24):13436–13441.
- Vasu K, Singh H, Singh S, et al. Microsatellite marker linked to a leaf rust resistance gene from Triticum monococcum L. transferred to bread wheat. J Plant Biochem Biotechnol. 2001;10(2):127–132.
- Sodkiewicz W. Diploid wheat: Triticum monococcum as a source of resistance genes to preharvest sprouting of triticale. Cereal Res Commun. 2002;30(3–4):323–328.
- Cakmak I, Cakmak O, Eker S, et al. Expression of high zinc efficiency of Aegilops tauschii and Triticum monococcum in synthetic hexaploid wheats. Plant and Soil. 1999;215(2):203–209.
- Rogers WJ, Miller TE, Payne PI, et al. Introduction to bread wheat (Triticum aestivum L.) and assessment for bread-making quality of alleles from T-Boeoticum Boiss ssp Thaoudar at Glu-A1 encoding two high-molecular-weight subunits of glutenin. Euphytica. 1997;93(1):19–29.
- Tranquilli G, Cuniberti M, Gianibelli MC, et al. Effect of Triticum monococcum glutenin loci on cookie making quality and on predictive tests for bread making quality. J Cereal Sci. 2002;36(1):9–18.
- Fregeau-Reid J, Abdel-Aal E-SM. 2004. Einkorn: a potential functional wheat and genetic resource. In: Abdel-Aal E, Wood P, editors. Specialty grains for food and feed. St Paul (MN): American Association of Cereal Chemists, 37–61.
- Jing HC, Kornyukhin D, Kanyuka K, et al . Identification of variation in adaptively important traits and genome-wide analysis of trait-marker associations in Triticum monococcum. J Exp Bot. 2007;58(13):3749–3764.
- Brandolini A, Volante A, Heun M. Geographic differentiation of domesticated einkorn wheat and possible neolithic migration routes. Heredity (Edinb). 2016;117(3):135–141.
- Kilian B, Özkan H, Pozzi C, et al. 2009. Domestication of the triticeae in the fertile crescent. In: C. Feuillet, G.J. Muehlbauer, editors. Genetics and genomics of the triticeae, plant genetics and genomics: Crops and models. 7, Springer SciencetBusiness Media, LLC, pp 81–119.
- Ceccarelli S, Grando S, van Leur JAG. Barley landraces of the fertile crescent offer new breeding options for stress environments. Diversity. 1995;11:112–113.
- Islam MR, Gregorio GB, Salam MA, et al. Validation of SalTol linked markers and haplotype diversity on chromosome 1 of rice. Mol. Plant Breed. 2012;3(10):103–114.
- Wang SC, Wong DB, Forrest K, et al . Characterization of polyploid wheat genomic diversity using a high-density 90,000 single nucleotide polymorphism array. Plant Biotechnol J. 2014;12(6):787–796.
- Kilian B, Özkan H, Walther A, et al. Molecular diversity at 18 loci in 321 wild and 92 domesticate lines reveal no reduction of nucleotide diversity during Triticum monococcum (einkorn) domestication: Implications for the origin of agriculture. Mol Biol Evol. 2007;24(12):2657–2266.
- Tanno K, Willcox G. How fast was wild wheat domesticated?Science. 2006;311(5769):1886.
- Zohary D, Hopf M. 1993. Domestication of plants in the old world: the origin and spread of cultivated plants in West Asia, Europe, and the Nile Valley, 2nd ed. Oxford: Oxford University Press.
- Barut M, Nadeem MA, Karaköy T, et al. DNA fingerprinting and genetic diversity analysis of world quinoa germplasm using iPBS-retrotransposon marker system. Turk J Agric For. 2020;44(5):479–491.
- Nadeem MA, Gündoğdu M, Ercişli S, et al. Uncovering phenotypic diversity and DArTseq marker loci associated with antioxidant activity in common bean. Genes. 2019;11(1):36.
- Aliyev T, Abbasov MA, Mammadov AC. Genetic identification of diploid and tetraploid wheat species with RAPD markers Ramiz. Turk J Biol. 2007;31:173–180.
- Figliuolo G, Perrino P. Genetic diversity and intraspecific phylogeny of Triticum turgidum L. subsp. dicoccon (schrank) Thell. revealed by RFLPs and SSRs. Genet Resour Crop Evol. 2004;51(5):519–527.
- Hajyzadeh M, Cavusoglu A, Sulusoglu M, et al. DNA SSR fingerprinting analysis among cherry laurel (Prunus laurocerasus L.) types. J Food Agric Environ. 2013;11(2):630–638.
- Henkrar F, El-Haddoury J, Ouabbou H, et al. Genetic diversity reduction in improved durum wheat cultivars of Morocco as revealed by microsatellite markers. Sci Agric (Piracicaba, Braz). 2016;73(2):134–141.
- Huang S, Sirikhachornkit A, Su X, et al. Genes encoding plastid acetyl-CoA carboxylase and 3-phosphoglycerate kinase of the triticum/aegilops complex and the evolutionary history of polyploid wheat. Proc Natl Acad Sci U S A. 2002;99(12):8133–8138.
- Röder MS, Korzun V, Wendehake K, et al. A microsatellite map of wheat. Genetics. 1998;149(4):2007–2023.
- Abbasov M, Akparov Z, Gross T, et al. Genetic relationship of diploid wheat (Triticum spp.) species assessed by SSR markers. Genet Resour Crop Evol. 2018;65(5):1441–1453..
- Arystanbekkyzy M, Nadeem MA, Aktas H, et al. Phylogenetic and taxonomic relationship of turkish wild and cultivated emmer (Triticum turgidum ssp. dicoccoides) revealed by iPBS-retrotransposons markers. Intl. J. Agric. Biol. 2019;21:(1):155–163.
- Peakall R, Smouse PE. GenAlEx 6.5: genetic analysis in excel. Population genetic software for teaching and research-an update. Bioinformatics. 2012;28(19):2537–2539. P.
- Roldán-Ruiz I, Dendauw J, Van Bockstaele E, et al. AFLP markers reveal high polymorphic rates in rye grasses (Lolium spp.) Mol Breed. 2000;6:125–134.
- Rohlf FJ. 1988. NTSYS-PC: Numerical taxonomy and multivariate analysis system, version 1.40. Setauket (NY): Exeter Publishing, 298. p.
- Jaccard P. Nouvelles recherches sur la distribution florale. Bul. Soc. Vaud. Sci. Nat. 1908;44:223–270.
- Sneath PHA, Sokal RR. Numerical taxonomy. W. H. Freeman and Company, San Francisco. 1973;230–234.
- Kimura M, Crow JF. The number of alleles that can be maintened in a finite population. Genetics. 1964;49:725–738.
- Pritchard JK, Stephens M, Donnelly PJ. Inference of population structure using multilocus genotypedata. Genetics. 2000;155(2):945–959.
- Evanno G, Regnaut S, Goudet J. Detecting the number of clusters of individuals using the software structure: A simulation study. Mol Ecol. 2005;14:2611–2620.
- Nei M. Analysis of gene diversity in subdivided populations. Proc Natl Acad Sci USA. 1973;70(12):3321–3323.
- Lewontin RC. Testing the theory of natural selection. Nature. 1972;236:181–182
- Gurcan K, Demirel F, Tekin M, et al. Molecular and agro-morphological characterization of ancient wheat landraces of Turkey. BMC Plant Biol. 2017;17(Suppl. 1):171.
- Galili G, Galili S, Lewinsohn E, et al. Genetic, molecular, and genomic approaches to improve the value of plant foods and feeds. CRC Crit Rev Plant Sci. 2002;21(3):167–204.
- Newton AC, Akar T, Baresel JP, et al. Cereal landraces for sustainable agriculture. A review. Agron Sustain Dev. 2010;30(2):237–269.
- Ahmed HGMD, Kashif M, Rashid MAR, et al. Genome wide diversity in bread wheat evaluated by SSR markers. Intl J Agric Biol. 2020;24:263–272.
- Feng S, He R, Lu J, et al. Development of SSR markers and assessment of genetic diversity in medicinal Chrysanthemum morifolium cultivars. Front Genet. 2016;7:113
- Gupta PK, Rustgi S, Sharma S, et al. Transferable Est-SSR markers for the study of polymorphism and genetic diversity in bread wheat. Mol Genet Genomics. 2003;270(4):315–323.
- Ren X, Jiang H, Yan Z, et al. Genetic diversity and population structure of the major peanut (Arachis hypogaea L.) cultivars grown in China by SSR markers. PLoS ONE. 2014;9(2):e88091
- Shiferaw E, Pe ME, Porceddu E, et al. Exploring the genetic diversity of Ethiopian grass pea (Lathyrus sativus L.) using EST-SSR markers. Mol Breed. 2012;30(2):789–797.
- Ramadugu C, Keremane ML, Hu X, et al. Genetic analysis of citron (Citrus medica L.) using simple sequence repeats and single nucleotide polymorphisms. Sci Hortic. 2015;195:124–137.
- Sönmezoğlu ÖA, Terzi B. Characterization of some bread wheat genotypes using molecular markers for drought tolerance. Physiol Mol Biol Plants. 2018;24(1):159–166.
- Raza A, Mehmood SS, Shah T, et al. 2019. Applications of molecular markers to develop resistance against abiotic stresses in wheat. In: Hasanuzzaman M, Nahar K, Hossain M, editors. Wheat production in changing environments. Singapore: Springer, 393–420.
- Korzun V, Röder M, Ganal M, et al. Genetic diversity and evolution of the diploid wheats T. urartu, T. boeoticum and T. monococcum revealed by microsatellite markers. Schriften zu Genetischen Ressourcen. 1998;8:244–247.