
Abstract
Snap bean (Phaseolus vulgaris L.) is low in fat and high in nutrients; however, it also contains toxigenic factors such as phytohemagglutinin (PHA), which is poisonous to humans. Here, we aimed to determine the distribution of PHA in natural populations of snap bean by analyzing a candidate gene (PHA-E) related to PHA content. Functional genome-wide single nucleotide polymorphisms (SNPs) were then scanned to identify SNPs related to PHA content. A total of 150 snap bean varieties were examined. PHA content and PHA-E expression levels were determined 10, 14, 18, 22, 26 and 30 days after anthesis. Then, association analyses were carried out to identify causal SNPs in PHA-E via genotyping and association tests. PHA-E expression was positively-correlated with PHA content. Among 59 detected SNPs, the ratio of synonymous to nonsynonymous changes was 1:8. P190 was identified as a novel SNP associated with PHA content. The allele carrying the GG genotype at P190 was detected in 130 varieties, of which 86 had an above-average PHA content, while the allele carrying the AA genotype at P190 was detected in 20 varieties, of which 17 (85%) had a low PHA content. Analyses of the PHA content and gene expression in fresh pods of 150 snap bean cultivars revealed population-level distribution and genetic variation, providing a unique measure for screening of low-level or nontoxic cultivars and aiding future breeding of new cultivars.
Supplemental data for this article is available online at https://doi.org/10.1080/13102818.2021.1985613.
Introduction
Snap bean (Phaseolus vulgaris L.) is a highly nutritious edible plant in the family Leguminosae, low in fat, high in protein, and rich in minerals and nutrients. However, a number of antinutritional factors, such as phytohemagglutinin (PHA), saponin, trypsin inhibitor and phytic acid, are also endogenous to snap bean [Citation1]. PHA is a major toxicogenic factor and causes human poisoning; consumption of raw or undercooked snap beans may, therefore, be fatal [Citation2]. However, PHA also plays an important role in biological nitrogen fixation. Rhizobium bacteria form a symbiotic relationship with host legumes and PHA in legume roots is important for this interaction [Citation3]. Snap bean PHA is therefore significant in biological research and also has potential biomedical applications [Citation4].
Safety guidelines have been established because of the high prevalence of lectin toxicity in snap bean (PHA is a lectin) [Citation5]. However, bean lectins are attracting increasing attention owing to their potential biological benefits in, for example, crop protection, antifungal application, cell agglutination, mitogenic stimulation, and in antitumor and anti-human immunodeficiency virus application [Citation6–10]. Studies have shown that PHA can improve the ability of crops to resist diseases and insects [Citation11]. Some lectin genes have been isolated, transgenic plants have been obtained, and expression of exogenous lectin was found to affect levels of insect and aphid resistance in a number of plants [Citation12].
Research into lectin regulation genes has also been carried out in various plants [Citation13]. For example, a PHA gene was isolated from Arcelin (Arc) 3, 4 and 7 genotypes of snap bean [Citation14], whereas [Citation15] isolated and then amplified a new lectin gene, Lec-S (DQ235094), from the soybean variety Hefeng 29. A homologous gene encoding artichoke tuber agglutinin (HTA) was also isolated via a protease inhibitor activity assay [Citation16]. In soybean seeds, PHA activity can recognize and specifically link to carbohydrates in the membranes of epithelium cells in the digestive tract. Soybean PHA is able to link to carbohydrate chains found in glycoproteins and glycolipids, and has strong affinity towards N-acetyl-D-galactosamine and, to a lower extent, D-galactose. This lectin–carbohydrate interaction consequently alters the morphology of the intestinal epithelium, as well as decreases digestion and nutrient absorption [Citation17]. Most PHA is resistant to proteolytic degradation in the small intestine, allowing it to exert deleterious effects.
Peptide sequence data from a 31-kDa protein were previously isolated from the black turtle bean using liquid chromatography-tandem mass spectrometry (LC-MS/MS) analysis with in-gel tryptic digests [Citation2]. The protein was subsequently identified as a lectin by de novo sequencing and a database search with MASCOT and BLAST, in agreement with its hemagglutinating activity. A high degree of sequence homology with PHA-E was confirmed via phylogenetic analysis. It was also suggested that black turtle bean lectin possesses the Arc 7 genotype, as supported by the evolutionary relationships among known PHA genotypes obtained using phylogenetic trees [Citation2].
In this study, analysis of PHA content and association analysis of candidate genes in natural populations were carried out to determine the regulatory mechanism of PHA-related genes in snap bean. The findings provide a theoretical basis for future breeding of nontoxic snap bean varieties.
Materials and methods
Plant material
The plant material consisted of 150 snap bean varieties obtained from Heilongjiang University, China. Snap bean pods were sampled when fully ripe in August 2018 and 2019 in a green house. Dynamic analysis of PHA content was performed 10, 14, 18, 22, 26 and 30 days (d) after anthesis. Pods were randomly selected from three plants per variety to give 400 g of sample each. Samples were then stored at −80 °C until PHA analysis and RNA extraction.
Determination of PHA content
PHA content was determined according to the method of [Citation18]. Blood erythrocytes (2 × 10⁸ erythrocytes mL−1) were prepared by drawing rabbit venous blood. PHA solution (0.5 mg mL−1) was diluted to eight concentrations. The PHA agglutination effect on the rabbit red blood cells was determined using a microplate reader to give a standard curve. Fresh snap bean pods were smashed into a homogenate to give 10 g per sample. Samples were then weighed before diluting with phosphate-buffered saline (PBS, 0.075 mol L−1, pH 7.2) to 10 mL. Liquid extract was then obtained by shaking at 4 °C for 24 h followed by centrifugation at 8000 r min−1 for 10 min (Germany, Hettich Universal 320 R). The supernatant was collected, and the absorption value was obtained. The lectin content of each sample was then calculated using the standard curve. Three biological replicates of each sample were examined.
Quantitative real-time polymerase chain reaction (qRT-PCR) analysis
Dynamic analysis of PHA-E expression was performed 10, 14, 18, 22, 26 and 30 d after anthesis, respectively. RNA was extracted from the pods of three independent biological repeats per sample at each sampling time, then used for qRT-PCR. A reverse transcription kit (Tiangen Beijing) was then used to synthesize cDNA from total RNA extracted from all tissues, and this cDNA was used for quantitative real-time PCR (qPCR) detection. Primer Premier 6 was used to design primers for all genes, including the gene encoding actin, which was used as an internal reference. The primer sequences are shown in . qPCR analysis was carried out using the Roche fluorescence quantitative PCR system (Roche Molecular Systems Inc., Branchburg, NJ, USA). The 20-μL qPCR reaction system comprised 2.5× RealMasterMix (9 μL), 1 μL of forward and reverse primers, and 4 μL of cDNA. The thermal cycling parameters were: 95 °C for 5 min, followed by 40 cycles of 95 °C for 10 s and 58 °C for 1 min. The 2−ΔΔCt method [Citation19] was used to quantify the relative gene expression.
Table 1. Nucleotide diversity of PHA-E in snap bean.
Genotyping and association tests
The full open reading frame (ORF) of PHA cDNA was amplified by PCR with the following forward and reverse primers: 5′-GAGAGAGAGTGCAGTTGTTGTTGT-3′ and 5′-CAGTGATTTAGTGTCACAGGGAAG-3′, using high-fidelity Phusion polymerase (Takara Japan). The PCR cycling conditions were: 98 °C for 2 min, followed by 32 cycles of 98 °C for 10 s, 60 °C for 10 s, and 72 °C for 30 s, with a final elongation at 72 °C for 2 min. PCR products were purified from agarose gels using a PCR Purification Kit (Takara) according to the manufacturer’s instructions. The PCR products were sent to Qingke Biological Company (China) for first-generation sequencing. Fragments were then subcloned and 20 clones were randomly selected for further analysis. A pair of alleles from the PHA-E sequence in each variety was obtained after cloning from all 150 snap bean varieties.
Gene sequences were aligned using MegAlign software (DNAStar) (Burland 2000). Tajima’s D and Fu and Li’s D* tests were then performed using the DnaSP program [Citation20,Citation21], and the neutral mutation parameter θ was also calculated for all mutations [Citation22]. Nucleotide diversity was analyzed using the parameter π [Citation23], which represents the average number of nucleotide differences per site between two sequences, and a general linear model was used to obtain association results using TASSEL version 5.0 [Citation24].
Results
Distribution of PHA content in snap bean
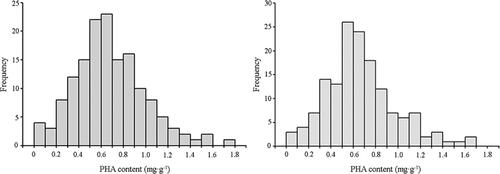
Minor differences in PHA content were found between the two sampling years (), and, overall, the PHA concentrations were within a narrow range (0–1.8 mg g−1), with an average of 0.5–0.7 mg g−1. Few varieties had a PHA content <0.3 mg g−1 or >1.0 mg g−1. These findings show the universality of PHA content among samples.
Figure 1. Distribution of PHA concentrations in 150 snap bean varieties in 2018 (left) and 2019 (right).
Dynamic relationship between candidate gene expression and PHA content
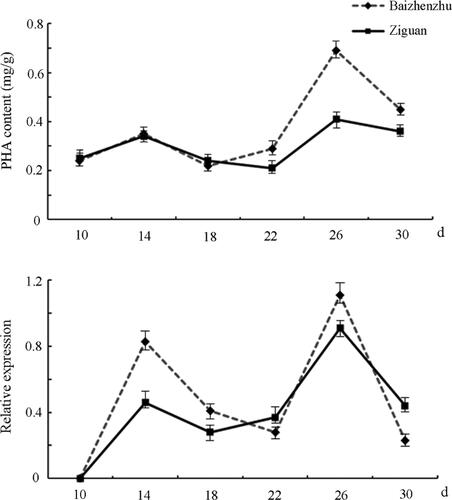
The PHA-E gene was translated from P. vulgaris phytohemagglutinin mRNA (GenBank accession number: AJ439714). Analysis of PHA content and dynamic analysis of PHA-E expression were performed 10, 14, 18, 22, 26 and 30 d after anthesis (). The PHA content changed little before 22 d, reaching a maximum at 26 d. Meanwhile, the expression levels of the PHA-E gene also peaked at 26 d, and the trend in gene expression was consistent with the trend in PHA content. These results suggest that the expression of PHA-E is positively correlated with the PHA content ().
Figure 2. PHA content (up) and corresponding PHA-E expression (down) in snap bean during pod development.
PHA-E nucleotide diversity
The PHA-E open-reading frame (ORF) was 828-bp long; this encoded a 275-amino-acid protein sequence, starting with a methionine residue. A total of 59 SNPs were found in the PHA-E ORF sequences. The ratio of synonymous to nonsynonymous mutations was 1:8, and the single nucleotide polymorphism (SNP) frequency was 1:98 in the nucleotide sequence. Negative and positive Tajima’s D and Fu and Li’s D* values were obtained, respectively, with a P-value < 0.05, suggesting that the evolution of this population was affected by positive selection ().
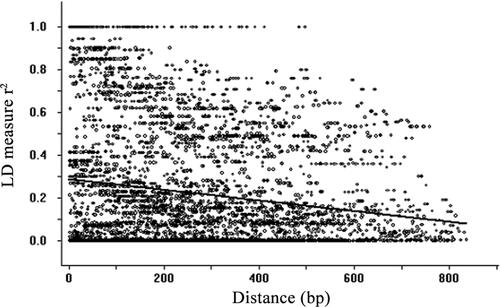
Linkage disequilibrium (LD) was also estimated by calculating the square of the correlation coefficient of allele frequencies (r2) and the LD distance for all pairs of polymorphic sites in the sequenced region of the PHA-E ORF (). The LD levels decreased very rapidly and the extent of LD across the polymorphic sites was 600 bp for PHA-E using r2 = 0.2 as the critical threshold estimated from a logarithmic equation. This rapid decrease is consistent with a highly effective recombination rate in an outcrossing mating system.
Figure 3. Plot showing the squared correlations of allele frequencies (r2) against the weighted distance between polymorphic sites.
Association analysis between SNPs and PHA content
Correlation analysis revealed that 10 nonsynonymous mutation sites were significantly associated with PHA content (). Of these, P225, P325, P353, P474, P698 and P806 were significantly associated with PHA in both 2018 and 2019. Meanwhile, P139, P161 and P184 were significantly and highly-significantly associated with PHA content in 2018 and 2019, respectively. P190 was highly-significantly associated with high PHA content in both years (p < 0.01). The site contribution rate was 7.97% and 8.77% in 2018 and 2019, respectively.
Table 2. Significant associations between PHA content and SNP markers in 2018 and 2019.
There was a significant difference in PHA content between genotypes. Individuals with the GG genotype (87% of all accessions) had a higher average content of PHA compared with the AA genotype (13% of all accessions) at site P190 (), with similar results in 2018 and 2019. The functional effect of aspartic acid (D)/serine (S) substitution at amino acid position 64 resulting from these two genotypes was verified by comparing the amino acid sequences of PHA-E. The range of variation in PHA concentrations was large for the GG and AA genotypes at site P190, suggesting a typical dominant action at this locus. P190 was therefore identified as a novel SNP associated with PHA content in snap bean (). The allele carrying the GG genotype at position P190 was subsequently detected in 130 varieties, 86 of which had an above-average PHA content. Meanwhile, the allele carrying the AA genotype at position P190 was detected in 20 varieties, 17 of which had a low PHA content.
Table 3. Mean PHA concentrations according to the genotype at P190.
Table 4. Relationships between the genotype at P190 and PHA concentration.
Discussion
Breeders and researchers have recently become interested in plant species with low PHA content; however, little is known about gene function-related PHA content. In this study, we identified a functional SNP in a candidate PHA gene using association analysis, by determining the PHA content of 150 snap bean varieties and resequencing the candidate gene in each. The results provide a basis for investigation of structure, expression, and regulatory mechanisms of PHA production, and enable analysis of potential roles of this compound in controlling pests and fungal diseases via gene transfer.
Progress has been made in the study of PHA in legumes. For example, [Citation25] aimed to develop soybean lines devoid of PHA in their seeds. The population under study was obtained by crossing the normal cv. Monarca with a soybean line lacking PHA. Specific DNA primers were then designed to identify recessive alleles in the absence of PHA. Meanwhile, another study in soybean showed that PHA mRNA present in tobacco seeds accumulates and decays with seed development, and is translated into a protein that accumulates before dormancy [Citation26]. Soybean non-seed protein mRNA was present in tobacco leaves, roots, stems and seeds at levels similar to that found in soybean plants [Citation27]. Moreover, differentially-expressed soybean gene clusters are correctly regulated in transformed tobacco plants, and the sequences controlling their expression are recognized by regulatory factors present in the tobacco cells [Citation28,Citation29]. Meanwhile [Citation2], identified a 31-kDa protein from the black turtle bean by liquid chromatograph-mass spectrometer/mass spectrometer (LC-MS/MS) analysis using in-gel tryptic digests. The protein was later identified as a lectin by de novo sequencing and a database search with MASCOT and BLAST, in agreement with its hemagglutinating activity. MS analysis revealed that the primary structure of this lectin exhibited >50% similarity to PHA-E. The authors further revealed that the lectin has a potential Arc 7 genotype, as supported by the evolutionary relationships among known PHA genotypes obtained using phylogenetic trees. Thus, the identification and sequencing of lectin from black turtle bean provides a valuable basis for investigation of areclin variants, which will improve our understanding of glycoproteins [Citation30].
In this study, PHA-E was chosen as a candidate gene and was sequenced in a set of snap bean varieties to determine the association between SNPs and PHA content, with verification of the functional effect of D64S substitution on the PHA genotype. However, this system is limited in terms of its use in analysis of antinutritional factors in snap bean, and candidate-gene-association studies between PHA-E and PHA content are deemed more effective for further investigations of the relationship between aroma and genetic variation. SNPs can cause relevant changes in gene expression or protein function, accompanied by phenotypic alterations. The main purpose of candidate gene-association studies, therefore, is to detect polymorphic sites that cause phenotypic variation.
Conclusions
In this study, PHA-E was chosen as a candidate gene and sequenced in a set of 150 snap bean varieties to determine the association between SNPs and PHA content. The functional effect of aspartic acid (D)/serine (S) substitution at amino acid position 64 in PHA-E in low-PHA genotype varieties was subsequently determined. P190 was revealed as a candidate SNP for potential use in screening of snap bean varieties with low PHA concentration, and it could be used as a functional marker in marker-assisted breeding, thereby accelerating the breeding process. However, despite these findings, it is necessary to determine the functional effects of polymorphisms to fully understand the effects on the content and overall biological functions of PHA.
Supplemental Material
Download PDF (109.3 KB)Data availability
The data supporting the findings of this study are available from the authors upon reasonable request.
Disclosure statement
No potential conflict of interest was reported by the authors.
Funding
This work was supported by the National Natural Science Foundation of China Youth Science Foundation Project (grant number 32002031); Heilongjiang Provincial Natural Science Foundation of China (grant numbers LH2020C090 and LH2019C058); and the Basic Scientific Research Operating Expenses of Provincial College in Heilongjiang Province (grant numbers 2020-KYYWF-1027 and 2020-KYYWF-1026).
References
- Batista KA, Prudêncio SH, Fernandes KF. Changes in the functional properties and antinutritional factors of extruded hard-to-cook common beans (Phaseolus vulgaris, L.). J Food Sci. 2010;75(3):C286–290.
- He S, Shi J, Li X, et al. Identification of a lectin protein from black turtle bean (Phaseolus vulgaris) using LC-MS/MS and PCR method. LWT-Food Sci Technol. 2015;60(2):1074–1079.
- Chen G, Wu H, Dai XD, et al. Dynamic changes of anti-Nutritional factors in common bean on different growth periods. J. Jianghan Univ. 2017;45(4):317–322.
- He S, Simpson BK, Sun H, et al. Phaseolus vulgaris Lectins: a systematic review of characteristics and health implications. Crit Rev Food Sci Nutr. 2018;58(1):70–83.
- Sadeghi A, Van Damme EJM, Peumans WJ, et al. Deterrent activity of plant lectins on cowpea weevil Callosobruchus maculatus (F.) oviposition. Phytochemistry. 2006;67(18):2078–2084.
- Gabriele M, Sparvoli F, Bollini R, et al. The impact of sourdough fermentation on Non-Nutritive compounds and antioxidant activities of flours from different Phaseolus vulgaris L. Genotypes. J Food Sci. 2019;84(7):1929–1936.
- Ren J, Shi J, Kakuda Y, et al. Phytohemagglutinin isolectins extracted and purified from red kidney beans and its cytotoxicity on human H9 lymphoma cell line. Sep Purif Technol. 2008;63(1):122–128.
- Shi J, Xue SJ, Kakuda Y, et al. Isolation and characterization oflectins from kidney beans (Phaseolus vulgaris). Process Biochem. 2007;42(10):1436–1442.
- Van Damme E. Plant lectins as part of the plant defense system against insects. In: Schaller A, editor. Induced plant resistance to herbivory. New York: Springer Science; 2008. pp 285–307.
- Ye X, Ng T, Tsang P, et al. Isolation of a homodimeric lectin with antifungal and antiviral activities from red kidney bean (Phaseolus vulgaris) seeds. J Protein Chem. 2001;20(5):367–375.
- Campion B, Perrone D, Galasso I, et al. Common bean (Phaseolus vulgaris L.) lines devoid of major lectin proteins. Plant Breed. 2009;128(2):199–204.
- Zhou Y, Xie H, Liu C, et al. Cloning of lectin Le4 gene from leguminosaeand the aphid resistance effect of its protein production. Genom Appl Biol. 2016;35(12):3474–3480.
- Venturelli GL, Brod F, Rossi GB, et al. A specific endogenous reference for genetically modified common bean (Phaseolus vulgaris L.) DNA quantification by real-time PCR targeting lectin gene. Mol Biotechnol. 2014;56(11):1060–1068.
- Lioi L, Sparvoli F, Galasso I, et al. Lectin-related resistance factors against bruchids evolved through a number of duplication events. Theor Appl Genet. 2003;107(5):814–822.
- Guo P. 2012. Cloning and functional study of soybean lectin gene LEC-S using transenic tobacco [Dissertation]. Nanjing (China): Nanjing Agricultural University.
- Chang T, Gao H. Size-dependent elastic properties of a single-walled carbon nanotube via a molecular mechanics model. J Mech Phys Solids. 2003;51(6):1059–1074.
- Schulze H, Saini HS, Huisman J, Hessing M, et al. Increased nitrogen secretion by inclusion of soya lectin in the diets of pigs. J Sci Food Agric. 1995;69(4):501–510.
- Shang R, Wu H, Guo R, et al. The diversity of four anti-nutritional factors in common bean. Hortic Plant J. 2016;2(2):97–104.
- Livak KJ, Schmittgen TD. Analysis of relative gene expression data using real-time quantitative PCR and the 2(-Delta Delta C(T)) method. Methods. 2001;25(4):402–408.
- Pritchard JK, Stephens M, Donnelly P. Inference of population structure using multilocus genotype data. Genet. 2000;155(2):945–959.
- Rozas J, Sánchez-DelBarrio JC, Messeguer X, et al. DnaSP, DNA polymorphism analyses by the coalescent and other methods. Bioinformatics. 2003;19(18):2496–2497.
- Nei M, Li WH. Mathematical model for studying genetic variation in terms of restriction endonucleases. Proc Natl Acad Sci U S A. 1979;76(10):5269–5273.
- Watterson GA. On the number of segregating sites in genetical models without recombination. Theor Popul Biol. 1975;7(2):256–276.
- Bradbury PJ, Zhang Z, Kroon DE, et al. Tassel: software for association mapping of complex traits in diverse samples. Bioinformatics. 2007;23(19):2633–2635.
- Moraes R, Soares T, Colombo LR, et al. Assisted selection by specific DNA markers for genetic elimination of the Kunitz trypsin inhibitor and lectin in soybean seeds. Euphytica. 2006;149(1-2):221–226.
- Sudhakar P, Marwan D, Yin F, et al. Genomic analysis of storage protein deficiency in genetically related lines of common bean (Phaseolus vulgaris L.). Frontiers Plant Sci. 2016;7(3396):389.
- Sparvoli F, Lanave C, Santucci A, et al. Lectin and lectin-related proteins in Lima bean (Phaseolus lunatus L.) seeds: biochemical and evolutionary studies. Plant Mol Biol. 2001;45(5):587–597.
- Goldberg RB, Hoschek G, Vodkin LO. An insertion sequence blocks the expression of a soybean lectin gene. Cell. 1983;33(2):465–475.
- Okamuro JK, Jofuku KD, Goldberg RB. Soybean seed lectin gene and flanking nonseed protein genes are developmentally regulated in transformed tobacco plants. Proc Natl Acad Sci U S A. 1986;83(21):8240–8244.
- Wang HH, Liang JB, Diao YY, et al. Identification and expression pattern analysis of jacalin-relate lectin genes in morus notabilis. Acta Sericologica Sinica. 2019;45(03):313–320.