
Abstract
Nanobodies belong to a new generation of antibodies produced by recombinant engineering and have high perspectives in biopharmaceutical drug formulations. In this work, we tested a new nanobody (ALNb18) against Leishmania, a parasitic intracellular pathogen, and optimized various conditions to enhance its expression yield in Escherichia coli. Many bacterial growth conditions were optimized for better expression, including host cell, inducer concentration, medium, pre-induction growth, incubation temperature and incubation duration. Nanobody expression levels were compared between these conditions using enzyme-linked immunosorbent assay (ELISA) against immobilized leishmania antigens. As an alternative strategy, nanobody ALNb18 was produced fused with super-folder green fluorescent protein (sfGFP) to enhance its yield of expression. The nanobody levels of expression were approximately the same regardless of the host E. coli strain with superiority to WK6 strain in time saving. Using LB medium, 0.1 mmol/L of expression inducer isopropyl β-d-1-thiogalactopyranoside (IPTG) and incubation at 37 °C for only 4 h showed better nanobody expression. Adding sfGFP downstream the sequence of ALNb18 resulted in a fully antigen-reactive fusion protein that was recovered from the periplasm of E. coli, with a slight increase in expression levels. Recombinant ALNb18 could be collected and purified in its effective form in quantities up to a milligram per litter of liquid cultures in flask. Affordable, time saving and economical methods were optimized to enhance the expression yield of ALNb18 nanobody, including its fusion to sfGFP. This nanobody could be a promising tool for ensuing pharmaceutical studies with a particular emphasis on leishmania infection.
Keywords:
Introduction
Camelids produce both conventional antibodies and heavy-chain antibodies (HCAbs). The latter have lower molecular weight because they contain only 2 heavy chains and lack light chains in their structure [Citation1]. They are homodimers composed of antigen-binding variable domains known as VHHs and several constant domains. The ease of identification of the VHH and its economic and biochemical advantages have encouraged the engineering of these antibodies and their investment in several medical and biotechnological fields. Large genetic libraries are usually prepared from immunized camels and used to isolate antigen-specific recombinant forms of VHHs in Escherichia coli, also known as nanobodies (NbsFootnote1) [Citation2]. Nbs are characterized by their nano size of 15 kDa, high solubility, monomer-like behaviour, stability, relatively low production cost and non-immunogenic properties. Nbs have been employed properly in biotechnology and pharmaceutical applications especially after the expiration of patent restrictions [Citation3–7].
Bacterial or mammalian cells can be used to express Nbs. However, the high cost of mammalian systems reasons the tendency to use bacterial systems, especially since there is no actual need for more complex systems to express functional Nbs [Citation8]. Fusion and non-fusion Nbs can be expressed preferably in E. coli periplasm where the oxidizing conditions favour the formation of disulphide bonds required for Nb stability. On the other hand, recombinant protein periplasmic expression has certain limitations, one of them is the low yield, which led to development of new techniques for VHH production [Citation9]. Simple modifications of culture conditions can be employed to improve Nbs expression yield recovered from E. coli periplasm by Osmotic shock [Citation10]. Another way to extract the maximum of expressed Nb is by treating the bacterial biomass with lysis buffer after testing different culture conditions [Citation11].
Nanobody fusion protein systems like maltose binding protein (MBP-Nb) have also been designed to increase Nb expression in culture media [Citation12]. Larger amounts of pure Nb was harvested using this technique, which includes several complex purification steps.
The great structural variation in Nbs paratope region explains their high specificity and great diversity [Citation13]. Large spectrum of Nbs conformational 3 D structures which involve complementary determining regions (CDRs) and framework residues, make it necessary to develop more expression systems for these Nbs, and each Nb sequence needs an optimized method to improve its expression for intended future use [Citation14,Citation15].
Cutaneous leishmaniasis (CL) has been reported in Syria since a long time ago. The number of cases rose to reach its peak in 2015 during the war, which has impacted the health services in the country [Citation16]. L. tropica is a protozoan parasite afflicting the population health. Anthroponotic CL caused by L. tropica is the prevailing form in Syria. Zoonotic CL caused by L. major has also been reported [Citation17,Citation18]. Globally, CL is responsible for one million infections annually around the world [Citation19].
In our previous work, an ALNbFootnote2 library was constructed after immunization of a camel with L. tropica. Phage display biopanning of the library resulted in several ALNbs (ALNb-2, 3, 6 and 36), showing the ability to recognize L. tropica or/and L. major in a similar way as a leishmania polyclonal antibody [Citation20]. These ALNbs showed significant anti protozoal infection properties in human macrophages [Citation21]. The characteristics of Nbs make ALNbs the focus of attention for developing diagnostic tools or effective treatment to fight CL.
Anti-leishmania nanobody-18 (ALNb18), which was characterized and found to have higher affinity to leishmania lysate, is a promising agent against leaishmania. To study this Nb in depth, it is necessary to obtain higher quantities of it. This study aims to optimize the expression conditions of ALNb18 to produce high quantities of the effective pure form. E.coli is considered the most common and efficient host for production of proteins in their stable folded globular state [Citation22]. Nb and Nb-fusion can be expressed preferably in E. coli periplasm [Citation8]. Green fluorescent protein (GFP) has been intensively used as a reporter for gene expression and specific protein targeting because of its stable fluorescence [Citation23–25]. Super folder GFP (sfGFP), which is a mutant GFP, has better solubility properties than GFP as fusion protein. sfGFP can help achieve soluble expression of genetically engineered antibodies as a fusion partner, providing a cost-effective model for preparation of modified antibodies against pandemic diseases [Citation26–28]. It has better folding properties than wild-type GFP for exported recombinant proteins [Citation29]. sfGFP was successfully used in detecting the biochemical changes in apoptotic cells when fused with annexin V [Citation30]. Similarly, sfGFP was used as fusion protein with recombinant human growth hormone rhGH to increase its solubility and immunogenicity [Citation31]. In this work sfGFP was used as fusion protein with the nanobody ALNb18 (ALNb18-sfGFP) in order to enhance its folding and expression properties as well as to follow visually and spectrally the protein localization during the expression and purification process.
Materials and methods
Cell transformation using heat shock method
Chemically competent E. coli strains JM 110 (Agilent), K12 TB1 (New England Bio-lab), and WK6 (ATCC) were transformed by heat shock method with the plasmids containing ALNb18 encoding sequence. Briefly, bacteria were incubated with each of the plasmids for 10 min in ice then placed at 42 °C for 40 s, then placed again in ice for two minutes. One millilitre of SOC (0.4% Glucose, 20 mmol/L Mg++, 2% bacto-tryptone, 0.5% yeasts extract, 10 mmol/L NaCl and 2.5 mmol/L KCl) was added and incubated for one hour at 37 °C with agitation at 650 rpm, then centrifuged for 2 min at 5000 ×g. Finally, bacteria were gently seeded on agar plates containing ampicillin (Sigma) and incubated overnight at 37 °C [Citation32]. pMES4 was nobly provided by Prof. S. Muyldermans (VUB, Brussels, Belgium).
DNA amplification by polymerase reaction (PCR)
The plasmid pMES4-sfGFP was constructed by sub-cloning the sfGFP coding sequence into the plasmid pMES4 after being extracted from the plasmid pRSET-sfGFP that was described in a previous work [Citation33]. PCR amplifications were performed using specific primers: pMES4 Forward (TACCTATTGCCTACGGCAGC)/pMES4 Reverse (AACAGTGGAACCGTAGTCCG) or pMES4 Forward/GFP-Reverse (TGGCCATTAACATCGCCATC) for pMES4-ALNb18 and pMES4-ALNb18-sfGFP plasmids, respectively. The PCR reaction tube included the following components: 2.5 µL buffer 10× (200 mmol/L Tris - HCl pH:8.8, 100 mmol/L KCl, 100 mmol/L (NH4)2SO4, 1 µg/µL bovine serum albumin (BSA), and 1% Triton X-100), 1.5 µL (50 mmol/L MgSO4), 0.5 µL nucleotides mixture (10 mmol/L dNTPs), 1 µL primers (10 µmol/L forward and reverse), 5 µL DNA sample (colony suspension), 0.5 µL (5 unit/µL Taq polymerase) and sterile distilled water to a final volume of 25 µL. Tubes were placed in a PCR device (Eppendorf) and the device was operated with annealing temperature at 55 °C for 32 cycles. After the completion of the PCR process, DNA samples were prepared for electrophoresis using 1.5% agarose (Carl Roth) gel containing ethidium bromide (0.01 mg/mL, Sigma) where DNA fragments were separated according to their size. Standard DNA ladder (Vivantis) was charged on the gel as well. Bands visualization was performed by UVP Transilluminator (UVP UVsolo touch, USA).
ALNb18 expression according to the initial method
E. coli WK6 strain was used as a host for the plasmids pMES4-ALNb18. Transformed bacteria were cultured in Luria-Bertani broth (LB) medium (1% bacto-tryptone, 0.5% yeast extract and 171 mmol/L NaCl) supplemented with ampicillin (100 µg/mL) at 37 °C overnight, the resulted pre-culture was added (5 μL/mL) to 50 mL Terrific Broth (TB) medium (1.2% bacto-tryptone, 2.4% yeast extract and 0.8% glycerol) within 250 mL flasks. Glucose, ampicillin and magnesium chloride in final concentration 0.1%, 100 µg/mL and 2 mmol/L respectively were added to TB, as it was suggested that addition of glucose is essential for higher protein production [Citation34]. Cultures had been incubated at 37 °C with agitation (200 rpm) until suspension optical density at 600 nm (OD600)) became between 0.6-0.9. Then, ALNb18 expression was induced by adding isopropyl β-d-1-thiogalactopyranoside (IPTG) at a final concentration of 1 mmol/L, and bacterial suspension was incubated for 16 h with agitation at 28 °C. In subsequent steps, the periplasmic proteins were extracted by osmotic shock using two different concentrations of TES buffer (200 mmol/L Tris pH: 8, 0.5 mmol/L EDTA and 500 mmol/L sucrose). Using AKTA purification system, the supernatant extract was passed over a nickel-charged column (5 mL). Binding of the C-terminal 6× histidine-tagged ALNb18 was performed using buffered solution adjusted to pH: 8 (50 mmol/L Tris-HCl, 300 mmol/L NaCl and 20 mmol/L imidazole). A 500 mmol/L imidazole buffer was employed to competitively elute the bound Nbs from the column. Finally, pure ALNb18 was washed and concentrated by Vivaspin 6 concentrator tubes (Sartorius Stedim Biotech) with pore dimensions of 10 kDa. To optimize ALNb18 expression, several variations of culture condition were tested, including host cells, culture media during expression process, pre-induction growth, concentration of the expression inducer IPTG, incubation temperature after expression induction and incubation period after induction.
Proteins electrophoresis and Western blot
SDS-PAGE were prepared using acrylamide 4% for stacking gel and 15% for running gel. Samples were run through the gel with protein molecular weight marker (Vivantis) using BioRad mini-Protein II system according to the manufacturer’s instructions. After electrophoresis, the gel was incubated for five minutes with coomassie brilliant blue staining buffer (0.25% coomassie R250, 10% acetic acid and 45% methanol) with agitation after warming in microwave for 30 s. The organic dye was removed from the gel using destaining solution (5% acetic acid and 10% methanol) for one hour with agitation after warming in microwave for a minute [Citation35]. For western blot, separated proteins were transferred from the gel to a nitrocellulose membrane (AmershamTM ProtranTM 0.45 µm) using transfer buffer (25 mmol/L tris − base, 200 mmol/L glycine, 0.1% SDS and 20% methanol). After incubation with blocking buffer (5% skimmed milk) in phosphate buffered saline pH: 7.4 (PBS) (10.14 mmol/L Na2HPO4. 2H2O, 0.13 mmol/L NaCl, 1.76 mmol/L KH2PO4 and 2.7 mmol/L KCl) and washing several times with washing buffer (PBS and 0.05% Tween-20), the membrane was incubated with appropriate dilutions in blocking buffer ×1 (1% skimmed milk) of primary antibody (1:1000, Rabbit-anti-Nb rIgG, homemade) [Citation36] for a full hour at room temperature (RT). In the next step goat anti-rabbit antibody conjugated to horseradish peroxidase (HRP) (1:3000, G-a-R-HRP, Bethyl Laboratories Inc.) was added. Peroxidase substrate 3-amino-9-ethylcarbazole (AEC-Sigma) in phosphate citrate buffer pH:5 (100 mmol/L sodium phosphate and 50 mmol/L citric acid) was added with 0.015% H2O2 for bands visualization.
Initial vs. optimized method in plate for conventional and sfGFP-fused ALNb18
In order to enhance its solubility and detectability during expression and purification, ALNb18 was fused with sfGFP. A down-scale experiment in a 24-well polystyrene plate (Primo® multiwall plate) was applied to compare the periplasmic expression in 1 mL medium for ALNb18 and ALNb18-sfGFP in E. coli using indirect ELISA. All steps for the two expression methods were executed in the plate to compare the effect of these conditions on the ALNb18 and ALNb18-sfGFP expression and localization in bacterial cells.
Indirect enzyme-linked immunosorbent assay (ELISA)
Promastigote L. tropica extraction was fixed in a 96-well microplate (BRAND plates®-immunogradTM) at a concentration of 1 μg/well with carbonate buffer pH: 9.6 (100 mmol/L NaHCO3 and 100 mmol/L Na2CO3). The plate was washed three times the day after with washing buffer using (Thermo Scientific, Well wash plate washer, Finland). To prevent non-specific binding to the microtiter well, blocking buffer was used and the plate was incubated for 2 h at RT followed by additional washes. Supernatant TES containing ALNb18 or ALNb18-sfGFP expressed under different conditions were added and incubated for 1 h at RT to be detected using home-made polyclonal rabbit antibody. After washing the plate, (1:500, rabbit-anti-Nb) was added to ALNb18 or ALNb18-sfGFP extract respectively. Antigen–antibody binding was detected finally using (1:3000, G-a-R-HRP), and the plate was incubated for an hour at RT. After washing the plate, the peroxidase substrate 3,3′,5,5′-tetramethylbenzidine (TMB-Sigma) and 0.015% H2O2 in phosphate citrate buffer pH:5 was added at 50 µL/well. Then the reaction was stopped using 50 µL/well of 500 mmol/L sulphuric acid. Finally, absorbance at λ = 450 nm was measured using ELISA plates reader (Thermo Scientific, Multiskan Go, Finland). Indirect ELISA was also employed to calculate the values of half maximal effective concentration (EC50) by adding serial dilutions of ALNbs (2, 3, 6, 18 and 36) to ELISA plate precoated with leishmania antigen.
Competitive ELISA
After extracting ALNb18 from bacterial periplasm, ALNb18 concentrations in the extracts were titrated using competitive ELISA. Briefly, pure Nbs mix (1000 ng/ml) was used as bait, so it was prepared in carbonate buffer pH: 9.6 and immobilized (100 µl/well) in 96-well microplate at 4 °C overnight. The next day, plate was washed and blocked for 1 h at RT, in the same time, duplicates of ALNb18 periplasmic samples (1:100 dilution) or Nb mix standard series (4 to 3000 ng/mL) were incubated with rabbit-anti-6 × Histidine rIgG R-a-His (1:5000, R-a-His, Bethyl Laboratories Inc.) for 1 h at RT in a final volume of 100 μL. They were then transferred to the blocked wells of 96-well microplate and incubated for further an hour. Plate was washed and bait-attached R-a-His antibodies were detected with (1:3000, G-a-R-HRP). Then absorption at 450 nm was measured after adding TMP peroxidase substrate. Expectedly, bait-attached antibodies are inversely proportional to the amount of free nanobodies in the samples. A linear regression standard curve was drawn in function of absorbance values by serial concentrations (ng/mL) logarithm of purified Nb mix.
Statistical analysis and graphs
The coding sequence of ALNb18 was defined using genetic analyzer (applied bio system ABI 310) and compared with other ALNbs using Geneious Basic 4.8.4 software, which also enabled the prediction of the amino acid sequence of this nanobody and was used to generate the phylogenetic tree with other ALNbs. The ALNB18 structure was predicted in-silico by Phyre2 web portal for protein modelling, prediction and analysis [Citation37]. ALNb18 codons were analyzed for suitability in E. coli expression using a proprietary algorithm, GenScript Rare Codon Analysis Tool (GenScript®, USA) [Citation38]. Experiments in this work were made in three replicates and analysis of variance (ANOVA) one-way test was applied in order to compare data, by means of Prism v7.0 software (GraphPad Statistics, USA). Differences were considered statistically significant at the p < 0.05 level.
Results
Characteristics of the nanobody ALNb18
Sequencing revealed that nanobody ALNb18 consists of 122 amino acids with 4 cysteine amino acids able to make 2 disulphide bridges () [Citation39]. The neighbour-joining rooted tree showed the distance between ALNb18 and other ALNbs which can be related to the specificity of this nanobody to other different leishmania antigens (). ALNb18 was found to have higher affinity to the antigen proved by its lowest effective concentration (EC50 = 3.85 *10−6 mg/mL) comparing to other ALNbs (ALNb2, 3, 6, 18 and 36) obtained in previous biopanning attempts ().
Figure 1. ALNb18 identification properties. (A) Amino acids sequence of the nanobody ALNb18 showing the three hypervariable complementarity-determining regions (CDR 1, 2 and 3). Numbers above the sequence are according to IMGT numbering [Citation39]. (B) Neighbor-joining rooted tree layout generated by Geneious 4.8.4 software after alignment between amino acid sequences of ALNb18 and other ALNbs resulting from previously published works. (C) Dose-response graph as obtained from ELISA plate. Immobilized leishmania antigens (1 µg/well) were incubated overnight at 4 C◦. After several steps of washing, final detection of bound nanobodies in the wells was achieved using rabbit anti-nanobody antibody (1:500) followed by a G-a-R-HRP (1:3000).
![Figure 1. ALNb18 identification properties. (A) Amino acids sequence of the nanobody ALNb18 showing the three hypervariable complementarity-determining regions (CDR 1, 2 and 3). Numbers above the sequence are according to IMGT numbering [Citation39]. (B) Neighbor-joining rooted tree layout generated by Geneious 4.8.4 software after alignment between amino acid sequences of ALNb18 and other ALNbs resulting from previously published works. (C) Dose-response graph as obtained from ELISA plate. Immobilized leishmania antigens (1 µg/well) were incubated overnight at 4 C◦. After several steps of washing, final detection of bound nanobodies in the wells was achieved using rabbit anti-nanobody antibody (1:500) followed by a G-a-R-HRP (1:3000).](/cms/asset/4e89c342-d68a-49cc-9073-02df2cef7739/tbeq_a_2044381_f0001_c.jpg)
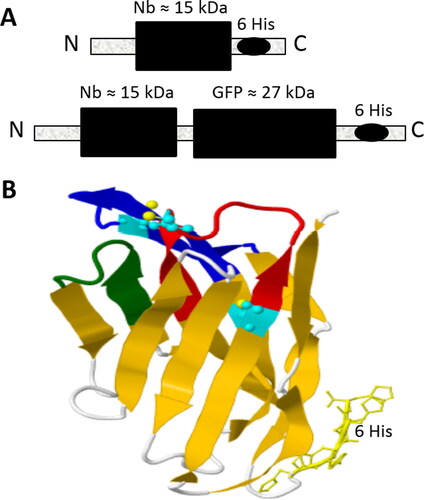
ALNb18 with a six-histidine tail and ALNb18-sfGFP were designed (). ALNb18 3 D structure showed disulphide bonds that stabilize its structure and can be formed preferably in E. coli periplasm. ALNb18 CDRs were predicted regarding other Nbs variable regions and illustrated by colours ().
Figure 2. The predicted structures of the expressed nanobodies. (A) Schematic representation of Nb and Nb-sfGFP fusion proteins with their theoretical sizes in kDa. (B) 3D drawing of the ALNb18 nanobody as computationally predicted by Phyre2 website (http://www.sbg.bio.ic.ac.uk/phyre2.). The two expected disulphide bonds are shown in light blue colour and the three CDRs (1, 2 and 3) are colored in red, green and dark blue, respectively. 6x His tag is shown at the C-terminus of the nanobody 3D structure.
Expression of ALNb18 using the initial method
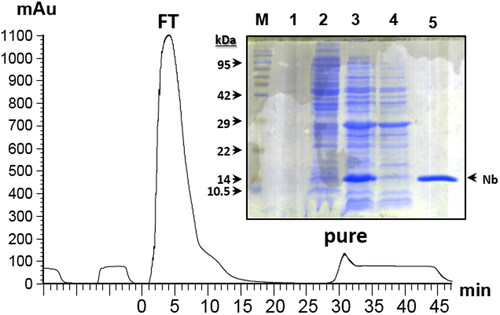
Expression effectiveness of the initial method was confirmed by electrophoresis. Samples at different expression steps were run through SDS-PAGE. ALNb18 band appeared in bacterial lysate and periplasmic extract samples after expression, which indicated expression effectiveness. Affinity chromatography was used for ALNB18 purification. The eluted fraction which contains only pure ALNb18 after purification of periplasmic extract was also run through the same SDS-PAGE where the Nb band appeared at 15 kDa according to the marker. The purification chromatogram for 5 mL periplasmic extract sample showed two peaks: the first is related to escaped protein from the column, and the second represented the eluted pure ALNb18, which proved the purification efficiency ().
Figure 3. Expression and purification of ALNb18. The chromatogram of nanobody purification run on an AKTA plus system equipped with nickel charged column is shown. After injecting 5 mL bacterial periplasmic extract (from 50 mL culture), pure ALNb18 nanobody (pure) was recovered from the column in the elution peak which appeared after the peak of Flow-Through (FT) of bacterial extract. (Inset) 15% acrylamide gel electrophoresis stained with coomassie brilliant blue of several samples (∼ 5 µg/lane) from the expression and purification stages of the nanobody ALNb18; bacterial lysate before (lane 1) and after 16 hours (lane 2) of expression induction with IPTG, periplasmic extract (lane 3), FT (lane 4) and pure nanobody (lane 5). Protein molecular weight marker was loaded in the first lane (M) and its bands are indicated with arrows with the expected sizes (in kDa).
Optimization of expression conditions for ALNb18
Host cell optimization
Three competent strains (JM 110, K12 TB1 and WK6) were transformed with pMES-4 containing ALNb18 encoding sequence to select the most suitable strain for ALNb18 production. It was notable during expression by the initial method that different strains need different times to reach exponential phase as shown in . After expressing ALNb18, ELISA plate showed no superiority in expression for any strain over the other strains, which were all practically capable of ALNb18 expression (). In our experiment WK6 was the best candidate for our consequent expression optimization steps, because of its time-saving properties considering its faster reaching to exponential phase than the other strains ().
Figure 4. Expression variations using different strains of E. coli. Three E. coli strains were transformed with pMES4-ALNb18 and grown on agar plate to be tested for ALNb18 expression. Nanobody reactivity in periplasmic and cytoplasmic (inclusion bodies) lysates (diluted 1:100 in 1 × blocking buffer), from three individual colonies for each strain, was tested by ELISA as described in .
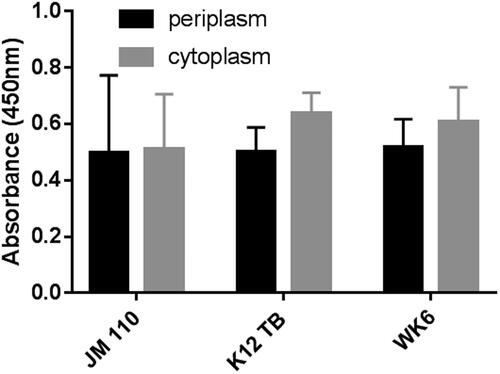
Table 1. Time needed to reach exponential phase by different hosts.
Optimizing the concentration of expression inducer
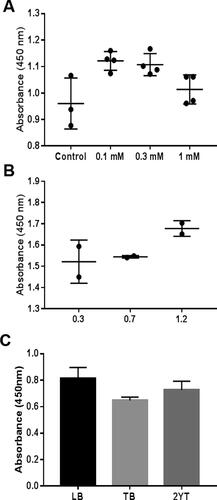
Because the protein activity and expression capability are sensitive to inducer concentration [Citation40], IPTG was added to reach final concentrations (0, 0.1, 0.3 and 1 mmol/L) in 3 replicates. After comparing the expression efficacy of ALNb18 in the periplasmic extract, it was found that using 0.1 and 0.3 mmol/L concentrations gave significantly higher expression than control (0 mmol/L) with P-values of 0.017 and 0.0292, respectively (), while there was no statistically significant difference at 1 mmol/L concentration.
Figure 5. Optimizing the expression parameters of the nanobody ALNb18. Nanobody in the periplasmic lysates (diluted 1:100 in 1 × blocking buffer) from different expression conditions were tested using the previously described indirect ELISA. The conditions for bacterial growth (50 mL medium in 250 mL flasks) and protein expression were as follows: (A) IPTG was used at different concentrations (0, 0.1, 0.3 and 1 mmol/L) to induce nanobody expression in bacteria at exponential phase. (B) IPTG (0.1 mmol/L) was added at early (OD600 = 0.3), mid (OD600 = 07) or late (OD600 = 1.2) points of the exponential phase of bacterial culture. (C) Different media (LB, TB and 2× YT) were used for bacterial growth.
Pre-induction growth optimization
Pre-induction growth can affect the expression of proteins as an important parameter [Citation41]. In this experiment, two replicates were tested at 3 different OD600 points (0.3, 0.7 and 1.2) of bacterial suspension in early, mid and late exponential phase just before the addition of the inducer. After that, IPTG was added to reach a final concentration of 0.1 mmol/L as it was optimized in the previous step. It was found that the increase in OD600 of the bacterial suspension leads to little increase in ALNb18 expression (P-value > 0.05), which may indicate an inverse relationship between the density of cells in the bacterial suspension at the beginning of induction and cell capability to initiate protein expression ().
Growth media optimization
Media and additives have an impact on protein expression according to its components [Citation42]. Pre-culture was added to 3 different media: TB, LB and 2× YT (bacto-tryptone 1.6%, yeast extracts 1%, and NaCl 85 mmol/L). ELISA showed a slight increase in ALNb18 expression in the periplasm of E. coli when using LB medium compared to other two media. The difference was statistically significant (P-value = 0.0404) comparing with TB ().
Optimizing the post-induction incubation temperature
Several incubation temperatures (24, 28 and 37 °C) were tested in three replicates after adding IPTG into LB culture medium. There were no significant differences in the expression yield between the tested temperatures ().
Figure 6. Optimizing the incubation conditions for expressing nanobody ALNb18. Using similar bacterial culturing and ELISA strategies as described in , different growth conditions were tested, either at different temperatures (A) or for different incubation times (hours) (B) after induction with IPTG (0.1 M) in LB medium.
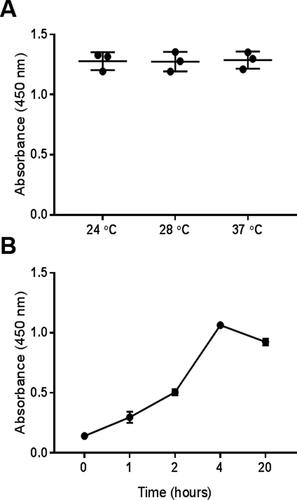
Optimizing the post-induction incubation time
In addition to temperature, incubation time is another essential parameter to be taken into account for protein expression and folding issues [Citation42]. Here, 0.1 mmol/L IPTG was added into LB medium, and incubated at 37 °C with shaking 250 rpm for periods (1, 2, 4 and 20) hours. The protein concentration increased in the periplasm as time increased to 4 h with a statistically significant difference, then it dramatically decreased at 20 h compared to its concentration at 4 h with a statistically significant difference ().
Initial vs. optimized method in flask
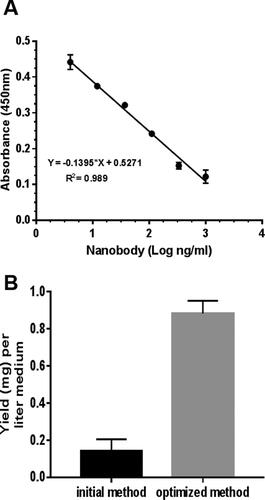
LB medium, IPTG 0.1 mmol/L, incubation temperature at 37 °C and 4 h post-induction incubation time were used as optimized conditions in 3 replicates for comparison with initial method to express ALNb18 in E. coli WK6 strain. Yields were compared using Nb-quantitative competitive ELISA. The results indicated that the optimized method for ALNb18 expression in the periplasm resulted in approximately four folds higher concentrations than the primary method and the difference was significant. The ALNb18 yield in the expression medium reached approximately 1 mg/L ().
Figure 7. Comparison in ALNb18 yield between the expression conditions. A competitive ELISA on immobilized mixture of nanobodies (0.1 µg/well) for binding R-a-His antibody (1:5000), was used to estimate ALNb18 nanobody expression yield (mg/L) of bacterial growth medium. (A) Serial concentrations (ng/mL) logarithm of a purified nanobody were used to draw a linear regression standard curve as a function of absorbance values. The linear equation was extracted and used to interpolate the unknown ALNb18 concentrations in the periplasmic samples. R2 represent the goodness of the fit of the standard curve. (B) A comparison of nanobody yield in the periplasmic lysates from two growth conditions; initial (TB growth medium, 1 mmol/L IPTG and 16 hours incubation at 28 °C) or optimized (LB growth medium, 0.1 mmol/L IPTG and 4 hours incubation at 37 °C) conditions.
Analyzing rare codons of ALNb18 for expression suitability in E. coli
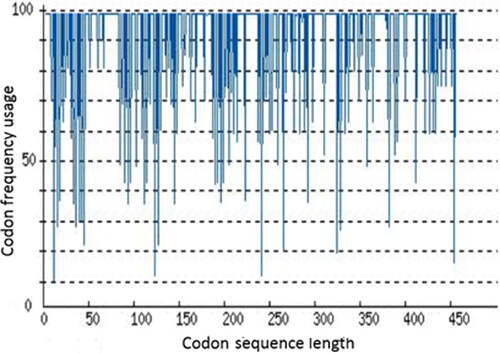
The codon adaptation index (CAI) value for ALNb18 sequence in E. coli was 0.65 regarding the distribution of codon frequency usage along the ALNb18 encoding sequence (). This result could explain the low expression yield for ALNb18 in E. coli strains, and pointed to the importance of either choosing another host or optimizing ALNb18 codons to improve its expression in E. coli.
Figure 8. Codon frequency usage along ALNb18 sequence to be expressed in E. coli. ALNb18 codons were analyzed starting from ATG for suitability in E. coli expression using rare codon analysis tool (GenScript®, USA). Possibility of high ALNb18 expression was correlated to the value of CAI which was 0.65 reflecting low chance for ALNb18 to be expressed well in E. coli.
Bacterial cell transformation and colony PCR
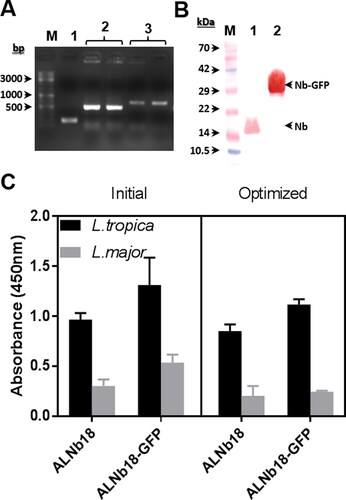
Two plasmid constructs (pMES4 and pMES4-sfGFP), containing the coding sequence of ALNb18, were used to transform E. coli WK6 strain. Transformed bacteria were grown on ampicillin selective medium and plasmid containing colonies were added to PCR reaction mix and PCR reaction was performed. When DNA was run through an agarose gel, three types of bands were obtained. The bands of approximately ≈500 bp represent the fragment of DNA amplified from the bacterial colonies containing the plasmid with Nb sequence (pMES4-ALNb18), and bands of ≈700 bp indicate Nb-sfGFP sequence (pMES4-ALNb18-sfGFP), while the bands of ≈200 bp represent the amplified DNA from the bacterial colonies that contain empty (pMES4) as control (). After transformation, expression and purification, ALNb18 and ALNb18-sfGFP were separated by SDS-PAGE and western blot was performed to inspect their identity using specific antibodies ().
Figure 9. sfGFP fusion impact on ALNb18 expression in plate using initial and optimized expression conditions. (A) PCR reaction was performed directly on bacterial colonies after transformation with two different plasmids using two pairs of primers for plasmid with Nb sequence and Nb-sfGFP sequence (pMES4-F/R and pMES4-F/GFP-R) respectively. The DNA molecular weight marker was loaded in the first lane (M). Lane 1 represents the amplified DNA fragment from a bacterial colony containing pMES-4 plasmid as control (200 bp). Lane 2 represents duplicate of the DNA fragment resulted from the plasmid containing Nb sequence (500 bp). Lane 3 represents duplicate of the DNA fragment resulted from the plasmid containing Nb-sfGFP sequence (700 bp). (B) Western blot after 15% SDS page of pure ALNb18. The protein molecular weight marker was loaded in the first lane (M). (lane 1) and ALNb18-sfGFP (lane 2) samples (0.5 µg/lane) using rabbit anti-nanobody antibody (1:500) followed with a G-a-R-HRP (1:3000). (C) ELISA results for expressed ALNb18 and ALNb18-sfGFP in the periplasm of WK6 grown and induced under initial or optimized conditions against immobilized antigens (1 µg/well) from L. tropica and L. major. Bound conventional nanobody or sfGFP fused nanobody were detected with Rabbit-anti-nanobody (1:500). G-a-R-HRP (1:3000) was used in the following step as described before.
Initial vs. optimized method in plate for conventional and sfGFP-fused ALNb18
Comparing the initial and optimized condition for expressing ALNbs-18 showed no significant differences between these methods for ALNb18 expression in the down-scale experiment. Adding sfGFP as fusion protein expedited visual reporting of ALNb18 expression because of its green colour which indicates the localization of ALNb18 in the periplasm extract and cytoplasm as well. One-way ANOVA for ELISA results demonstrated no significant differences between ALNb18-sfGFP and ALNb18 expression in periplasm reflecting a high performance of sfGFP in preserving ALNb18 folding after export to periplasm (). T test showed a slight increase in ALNb18-sfGFP expression comparing to ALNb18 in both initial and optimized expression methods.
Discussion
Naturally occurring HCAbs in Camelids serum have recently Drawn researcher’s attention to genetically engineered Nbs. This novel design of low molecular weight antibodies having distinct characteristics has nominated Nbs for further investigations for biomedical and pharmaceutical applications. In this work, more stringent phage display selection conditions were applied to retrieve new Nbs from an immune library, which was constructed from camel immunized with leishmania in our previous work [Citation21]. Stringency in biopanning was achieved through increasing wash numbers and adding detergents to washing buffers between phage enrichment cycles. ALNb18 was isolated after the fourth elution round of phage display biopanning on leishmania immobilized antigens. ALNb18 was more reactive to leishmania immobilized antigens than other generated Nbs from the same anti-leishmania immune library. This reactivity motivated the aim to produce high yield of ALNb18 in a fast and cost-effective manner. We started by testing several E. coli strains for their capacity to produce this new Nb. Our findings indicated no significant differences between tested strains and disagreed with a previous report, where high variation in Nb expression was obtained when using various E. coli strains [Citation43]. However, there was another parameter for choosing WK6 strain among other tested strains, which was its rapid growth before expression induction. For expression induction 0.1 mmol/L IPTG promoted expression better than 1 mmol/L concentration, which may be attributed to the toxic effect of IPTG on E. coli at high concentrations [Citation44]. Moreover, high levels of inducer can increase protein production in its insoluble state as inclusion bodies in the cytoplasm [Citation45]. Using LB medium improved ALNb18 expression, which indicated the role of less nutrient-rich media in improving protein solubility and activity, because of low metabolic load on bacterial cells [Citation46,Citation47]. ALNb18 showed high stability at high temperature during expression. These findings can give additional proof that Nbs are more resistant than other recombinant proteins that lose their folding during expression at high temperature and form more inclusion bodies at the expense of periplasmic expression [Citation48]. Prolonging incubation time after induction did not result in the desired expression outputs. These results could be interpreted by a decline in the ability of cells to actively express ALNb18 at a certain level due to high biomass density in the liquid culture. The newly optimized conditions according to these findings elevate the ALNb18 yield 4 times. However, this improved yield did not exceed 1 milligram per litter of growth medium.
Codon usage is an important parameter to be considered for recombinant proteins expression in different organisms. This is especially the case when the codon usage frequency of the original organism and expression host organism differ significantly. Therefore, it is crucial to identify rare codons in ALNb18 sequence to understand gene expression behaviour in the selected expression host [Citation49]. The CAI index is used for prediction of gene expression level because it clarifies mathematically how fine the coding sequence represents the usage of codons in certain organisms [Citation50]. A CAI of 0.8–1.0 is considered ideal according to GeneScript’s optimization statement [Citation38]. The lower the CAI number, the lower the chance for a gene to be expressed well. According to the value of the CAI index for the ALNb18 sequence in E. coli, codon optimization of ALNb18 coding sequence using overlapping synthetic primers might be an interesting approach to improve the expression in E. coli. ALNb18-sfGFP was designed in order to improve the ALNb18 folding in the periplasm, especially since the sequence of sfGFP itself was codon optimized to enhance its expression [Citation51]. Even though it is easy to predict codon optimized ALNb18 in silico, it is expected to be complicated to synthesize the optimized sequence using splicing by overlap extension method [Citation52].
Besides its advantages in enhancing the solubility and folding of its fused moieties, the photophysical property of sfGFP is very useful during expression and purification steps. The spectrally detectable colour of sfGFP gave the advantage of simple and direct absorbance measurement using spectrophotometric method at λ = 490 in buffered solution [Citation53]. Thus, the ALNb18 content in periplasmic and cytoplasmic extracts during expression and purification could be easily determined. A similar approach was successfully applied in a previous study to increase the solubility and productivity of human GH by its fusion with sfGFP in pRSET derived plasmids, before being used in camel immunization and anti-GH Nbs production [Citation31, Citation54]. As expected, fusing ALNb18 to sfGFP did not affect its antigen binding activity. This finding confirms the general concept focusing on the use of Nbs fusions with different fluorophores, as GFP or RFP, as efficient labels for intra- and extra- cellular targets [Citation55]. Finally, it is worth mentioning that our work is still the first report showing an example of Nbs fusion with this outstanding superfolder form of GFP, resulting in an active form recovered from the periplasm of E. coli. Investigating the structure and properties of such a fusion construct and the extent to which it affects the binding affinity of the ALNb18 toward its antigen, will require further in-depth studies.
Conclusions
The results of the optimized conditions for ALNb18 expression showed that WK6 strain was better than other tested strains. Using poor medium such as LB and low concentration of IPTG (0.1 mmol/L) is sufficient to fully induce ALNb18 expression in this strain. Adding IPTG in the early or late periods of the exponential growth phase does not affect the efficiency of ALNb18 production. Incubation at 37 °C for 4 h was more optimal to obtain larger yield of active ALNb18 than leaving it overnight and wasting time. Fusing ALNb18 to sfGFP helps better detection properties of expressed fusion protein in host cells and increased slightly the yield of expression. Consequent codon optimization strategy could be envisaged in future for improving ALNb18 expression chances in E. coli. In addition to the improved solubility and yield properties expected to be offered by sfGFP, its photophysical properties can be of great advantage as an indicator to track Nbs expression and purification in real time. To conclude, using the optimized conditions was cost-effective without time wasting to get higher amounts of ALNb18 for further pharmaceutical researches and applications.
Availability of data and material
All data that support the findings reported in this study are available from the corresponding author upon reasonable request.
Acknowledgment
MKQ Acknowledges support from Atomic Energy Commission of Syria.
Disclosure statement
No potential conflict of interest was reported by the authors.
Additional information
Funding
Notes
1 Nanobodies
2 Anti leishmania nanobody
References
- Hamers-Casterman C, Atarhouch T, Muyldermans S, et al. Naturally occurring antibodies devoid of light chains. Nature. 1993;363(6428):446–448.
- Arbabi Ghahroudi M, Desmyter A, Wyns L, et al. Selection and identification of single domain antibody fragments from camel heavy-chain antibodies. FEBS Lett. 1997;414(3):521–526.
- Arbabi-Ghahroudi M. Camelid single-domain antibodies: historical perspective and future outlook. Front Immunol. 2017;8:1589–1589.
- Bannas P, Hambach J, Koch-Nolte F. Nanobodies and Nanobody-Based human heavy chain antibodies as antitumor therapeutics. Front Immunol. 2017;8:1603.
- Saerens D, Ghassabeh GH, Muyldermans S. Single-domain antibodies as building blocks for novel therapeutics. Curr Opin Pharmacol. 2008;8(5):600–608.
- Van MV, Fujimori T, Bintu L. Nanobody-mediated control of gene expression and epigenetic memory. Nat Commun. 2021;12(1):537.
- Wesolowski J, Alzogaray V, Reyelt J, et al. Single domain antibodies: promising experimental and therapeutic tools in infection and immunity. Med Microbiol Immunol. 2009;198(3):157–174.
- de Marco A. Recombinant expression of nanobodies and nanobody-derived immunoreagents. Protein Expr Purif. 2020;172:105645.
- Veggiani G, de Marco A. Improved quantitative and qualitative production of single-domain intrabodies mediated by the co-expression of Erv1p sulfhydryl oxidase. Protein Expr Purif. 2011;79(1):111–114.
- Kariuki CK, Magez S. Improving the yield of recalcitrant nanobodies® by simple modifications to the standard protocol. Protein Expr Purif. 2021;185:105906.
- Van Noi N, Chung Y-C. Optimization of expression and purification of recombinant S1 domain of the porcine epidemic diarrhea virus spike (PEDV- S1) protein in Escherichia coli. Biotechnology & Biotechnological Equipment. 2017;31(3):619–629.
- Salema V, Fernandez LA. High yield purification of nanobodies from the periplasm of E. coli as fusions with the maltose binding protein. Protein Expr Purif. 2013;91(1):42–48.
- Mitchell LS, Colwell LJ. Comparative analysis of nanobody sequence and structure data. Proteins. 2018b;86(7):697–706.
- Mitchell LS, Colwell LJ. Analysis of nanobody paratopes reveals greater diversity than classical antibodies. Protein Eng Des Sel. 2018a;31(7-8):267–275.
- Zimmermann I, Egloff P, Hutter CA, et al. Synthetic single domain antibodies for the conformational trapping of membrane proteins. Elife. 2018;7:34317.
- Muhjazi G, Gabrielli AF, Ruiz-Postigo JA, et al. Cutaneous leishmaniasis in syria: a review of available data during the war years: 2011-2018. PLoS Negl Trop Dis. 2019;13(12):e0007827.
- Alvar J, Velez ID, Bern C, et al. Leishmaniasis worldwide and global estimates of its incidence. PLoS One. 2012;7(5):e35671.
- Rioux JA, Dereure J, Khiami A, et al. [Ecoepidemiology of leishmaniasis in syria. 1. Leishmania major yakimoff and schokhor (Kinetoplastida-Trypanosomatidae) infestation of psammomys obesus cretzschmar (Rodentia-Gerbillidae)]. Ann Parasitol Hum Comp. 1990;65(5-6):203–207.
- Ruiz-Postigo JA, Grouta L, Jaina S. Global leishmaniasis surveillance, 2017–2018, and first report on 5 additional indicators. WHO, Weekly Epidemiological Record No. 2020;25(95):265–280. https://www.who.int/publications/i/item/who-wer9525
- Alshamat EA, Kweider M, Soukkarieh C, et al. Phage-nanobody as molecular marker for the detection of Leishmania tropica. Gene Rep. 2020;19:100577.
- Abu Alshamat E, Kweider M, Abbady AQ. Camel nanobodies: Promising molecular tools against leishmaniasis. Parasite Immunol. 2020;42(9):e12718.
- Rosano GL, Ceccarelli EA. Recombinant protein expression in Escherichia coli: advances and challenges. Front Microbiol. 2014;5:172.
- Puckett LG, Dikici E, Lai S, et al. Investigation into the applicability of the centrifugal microfluidics platform for the development of protein-ligand binding assays incorporating enhanced green fluorescent protein as a fluorescent reporter. Anal Chem. 2004;76(24):7263–7268.
- Shimomura O. Discovery of green fluorescent protein (GFP) (nobel lecture). Angew Chem Int Ed Engl. 2009;48(31):5590–5602.
- Tsien RY. The green fluorescent protein. Annu Rev Biochem. 1998;67:509–544.
- Cabantous S, Waldo GS. In vivo and in vitro protein solubility assays using split GFP. Nat Methods. 2006;3(10):845–854.
- Liu M, Wang B, Wang F, et al. Soluble expression of single-chain variable fragment (scFv) in Escherichia coli using superfolder green fluorescent protein as fusion partner. Appl Microbiol Biotechnol. 2019;103(15):6071–6079.
- Pedelacq JD, Cabantous S, Tran T, et al. Engineering and characterization of a superfolder green fluorescent protein. Nat Biotechnol. 2006;24(1):79–88.
- Dinh T, Bernhardt TG. Using superfolder green fluorescent protein for periplasmic protein localization studies. J Bacteriol. 2011;193(18):4984–4987.
- Abbady AQ, Twair A, Ali B, et al. Characterization of annexin V fusion with the superfolder GFP in liposomes binding and apoptosis detection [original research]. Front Physiol. 2017;8:317.
- 31. Abbady AQ, Al-Shemali R, Mir Assaad J, et al. Generation and characterization of nanobodies against rhGH expressed as sfGFP fusion protein. Gen Comp Endocrinol. 2014;204:33–42.
- Froger A, Hall JE. Transformation of plasmid DNA into E. coli using the heat shock method. J Vis Exp. 2007;(6):e253.
- 33. Al-Homsi L, Al-Assad JM, Kweider M, et al. Construction of pRSET-sfGFP plasmid for fusion-protein expression, purification and detection. Jordan J Biol Sci. 2012;5(4):279–288.
- Sivashanmugam A, Murray V, Cui C, et al. Practical protocols for production of very high yields of recombinant proteins using Escherichia coli. Protein Sci. 2009;18(5):936–948.
- Simpson RJ. Rapid coomassie blue staining of protein gels. Cold Spring Harb Protoc. 2010;2010(4):pdb.prot5413.
- Haddad M, Soukkarieh C, Khalaf HE, et al. Purification of polyclonal IgG specific for camelid’s antibodies and their recombinant nanobodies. Open Life Sci. 2016;11(1):1–9.
- Kelley LA, Mezulis S, Yates CM, et al. The Phyre2 web portal for protein modelling, prediction and analysis. Nat Protoc. 2015;10(6):845–858.
- 38. GenScript Rare Codon Analysis Tool. 2002. 8 September. https://www.genscript.com/tools/rare-codon-analysis.
- Lefranc MP, Pommie C, Ruiz M, et al. IMGT unique numbering for immunoglobulin and T cell receptor variable domains and Ig superfamily V-like domains. Dev Comp Immunol. 2003;27(1):55–77.
- Turner P, Holst O, Karlsson EN. Optimized expression of soluble cyclomaltodextrinase of thermophilic origin in Escherichia coli by using a soluble fusion-tag and by tuning of inducer concentration. Protein Expr Purif. 2005;39(1):54–60.
- Beigi L, Karbalaei-Heidari HR, Kharrati-Kopaei M. Optimization of an extracellular zinc-metalloprotease (SVP2) expression in Escherichia coli BL21 (DE3) using response surface methodology. Protein Expr Purif. 2012;84(1):161–166.
- Chambers SP, Swalley SE. Designing experiments for high-throughput protein expression. Methods Mol Biol. 2009;498:19–29.
- Li D, Ji F, Huang C, et al. High expression achievement of active and robust anti-beta2 microglobulin nanobodies via E. coli hosts selection. Molecules. 2019;24(16):2860.
- Dvorak P, Chrast L, Nikel PI, et al. Exacerbation of substrate toxicity by IPTG in Escherichia coli BL21(DE3) carrying a synthetic metabolic pathway. Microb Cell Fact. 2015;14:201.
- Rizkia PR, Silaban S, Hasan K, et al. Effect of isopropyl-β-D-thiogalactopyranoside concentration on prethrombin-2 recombinan gene expression in Escherichia Coli ER2566. Procedia Chem. 2015;17:118–124.
- Li XL, Robbins JW, Jr., Taylor KB. The production of recombinant beta-galactosidase in Escherichia coli in yeast extract enriched medium. J Ind Microbiol. 1990;5(2-3):85–93.
- Nancib N, Branlant C, Boudrant J. Metabolic roles of peptone and yeast extract for the culture of a recombinant strain of Escherichia coli. J Ind Microbiol. 1991;8(3):165–169.
- Sahdev S, Khattar SK, Saini KS. Production of active eukaryotic proteins through bacterial expression systems: a review of the existing biotechnology strategies. Mol Cell Biochem. 2008;307(1-2):249–264.
- Daniel E, Onwukwe GU, Wierenga RK, et al. ATGme: Open-source web application for rare codon identification and custom DNA sequence optimization. BMC Bioinformatics. 2015;16(1):303.
- Raab D, Graf M, Notka F, et al. The GeneOptimizer algorithm: using a sliding window approach to cope with the vast sequence space in multiparameter DNA sequence optimization. Syst Synth Biol. 2010;4(3):215–225.
- Wu X, Wu D, Lu Z, et al. A novel method for high-level production of TEV protease by superfolder GFP tag. J Biomed Biotechnol. 2009;2009:591923–591928. (
- Al-Homsi L, El-Din HN, Murad H, et al. Assessing the bioactivity of the codon optimized sfGFP-IGF1 fusion protein via interaction with IGFBP3 and induction of cell proliferation. Gene Reports. 2019;17:100496.
- Stepanenko OV, Stepanenko OV, Kuznetsova IM, et al. Sensitivity of superfolder GFP to ionic agents. PLoS One. 2014;9(10):e110750.
- 54. Murad H, Ali B, Makeya R, et al. Prokaryotic overexpression of TEV-rhGH and characterization of its polyclonal antibody. Gene. 2014;542(1):69–76.
- 55. Rothbauer U, Zolghadr K, Tillib S, et al. Targeting and tracing antigens in live cells with fluorescent nanobodies. Nat Methods. 2006;3(11):887–889. http://www.ncbi.nlm.nih.gov/entrez/query.fcgi?cmd=Retrieve&db=PubMed&dopt=Citation&list_uids=17060912