
 ?Mathematical formulae have been encoded as MathML and are displayed in this HTML version using MathJax in order to improve their display. Uncheck the box to turn MathJax off. This feature requires Javascript. Click on a formula to zoom.
Abstract
This study analysed the changes in the reimbursed cost, prices and utilization of biological medicines for a 5-year time horizon, encompassing three major arthropathic diagnoses, rheumatoid arthritis (RA), psoriatic arthropathies (PsA) and ankylosing spondylitis (AS), from the point of view of the third-party payer in Bulgaria. National; population based; macroeconomic; top-down budget analysis was performed based on official data about the number of inhabitants, reimbursed diagnoses and medicines, reimbursed cost, treated patients, and prices of medicines. The utilization of medicines was calculated in DDD per 1000/inh/day. There was an increase of 41% in the number of patients treated with biological medicines. The reimbursement cost of biologicals increased by 21%; however, the per-patient reimbursement costs per diagnosis fell by 40% due to price decreases. Out of 21 reimbursed diagnoses, we saw a significant difference in prevalence (612 SD in 2016 to 1216 SD in 2020; p < 0.05). RA accounted for 2736 patients in 2016, increasing by 131% to 4662 patients in 2020; AS with 1933 patients in 2016 reached 3196 patients by 2020, and PsA with 1128 patients ranked third with a 75% increase. The cost of therapy of RA was the highest, accounting for appr. 15 mill Euro in 2016. The utilization decreased only for 2 INNs (infliximab and rituximab). All INNs experienced a nearly two-fold increase in their utilization: from 0.5244 to 0.9252 DDD/1000inh/day. The cost analysis shows an important place of biologicals for arthropathic diseases therapy; introduction of biosimilars leads to prices and cost decreases.
Introduction
Biologic disease modifying antirheumatic drugs (bDMARDs) are recommended for patients with arthropathic diseases [Citation1,Citation2] which do not respond to the conventional antirheumatic medicines [Citation3].
There are several bDMARDs on the European market for the treatment of moderate-to-severe rheumatoid arthritis, moderate-to-severe psoriasis, psoriatic arthritis or ankylosing spondylitis. The TNF (tumour necrosis factor) blockers such as etanercept, infliximab, adalimumab, golimumab, ixekisummab, etc. have approval for use in adults with any of these conditions, and their prices and utilization are monitored closely [Citation4]. Recently the JAK inhibitors were also added in the armamentarium of arthropathic diseases therapy. There is a need to continually forecast the costs of bDMARDs and JAK inhibitors from the point of view of third-party payers owing to differences in dosing schedules, treatment gaps, switching between them, and dose increase over time [Citation5].
There are few reports about the long-term health outcomes and cost associated with patterns of bDMARD utilization in the symptom management of arthropathies [Citation6]. At a national level, it is important to consider the economic aspects of real-world medication utilization patterns to manage and control the symptoms of arthropathies. Reports indicate that bDMARDs are cost-effective for the treatment of moderate-to-severe arthropathies, because bDMARDs improve symptoms: they decrease the disease activity, prevent radiographic progression and improve the functional status and quality of life [Citation7]. However, reportedly the cost of therapy is constantly increasing, which possess challenges to payers [Citation8].
Some studies showed that the cost of ankylosing spondylitis is lower than that of rheumatoid arthritis and psoriatic arthritis and that the biological therapy is the factor with the highest impact on the overall cost of these diseases. On the other hand, scientists report that bDMARDs are important for preventing hospital admissions and can contribute to lower costs for the whole system [Citation9].
Studies have estimated the annual bDMARDs cost per treated patient with rheumatoid arthritis, psoriasis, psoriatic arthritis, and/or ankylosing spondylitis receiving different types of bDMARDs and JAK inhibitors like etanercept, abatacept, adalimumab, certolizumab, golimumab, infliximab, rituximab or ustekinumab [Citation10].
The relative cost of biologics in the treatment of autoimmune disorders, including rheumatoid arthritis, psoriatic arthritis, psoriasis and ankylosing spondylitis, is reported to be a key consideration for managed care payers [Citation11].
Having in mind the significance of the issue, we set as a goal of this study to analyse the changes in the reimbursed cost, prices and utilization of biological medicines for a 5-year time horizon for three major arthropathic diagnoses from the point of view of the third-party payer in Bulgaria.
The diseases of interest were rheumatoid arthritis (RA), psoriatic arthropathies (PsA) and ankylosing spondylitis (AS) as the major arthropathies with highest prevalence in this country. We explored the number of affected patients, introduction of biological agents (originator and biosimilar) to their therapy, prices and utilization changes for a 5-year period. The research questions focussed on the changes in the overall reimbursed cost for a 5-year period for different arthropathic diagnoses, prescribed biologicals for their therapy, and the influence of their prices and utilization on the overall reimbursed cost.
Materials and methods
National; population based; macroeconomic; top-down budget analysis was performed. Information was extracted from three national databases at the macro level.
The National Statistical Institute (NSI) database provides information on the number of people nationwide [Citation12]. The National health Insurance Fund (NHIF) database was searched for information about the reimbursed medicines, reimbursed cost and treated patients [Citation13]. These data served as a basis for calculations of the reimbursed cost per patient with a particular diagnosis [Citation14] and on a particular medicine.
The prices for every dosage form were extracted from the database of the National Council of prices and reimbursement of medicinal products (NCPRMP) at the end of every observed year [Citation15]. The reference price per defined daily dose (DDD) for every international non-proprietary name (INN) was used in the comparison as the lowest price per DDD that is reimbursed from the NHIF [Citation16].
Utilization of medicines was calculated in defined daily doses per 1000 inhabitants per day by the modified World Health Organisation formula:
Descriptive statistics was applied towards the cost changes, treated patients and bDMARD utilization.
The statistical significance in the changes of the observed parameters was tested with Friedman test for dependent variables, with Kruskal-Wallis’s test for independent variables. The correlation between prices, utilization and cost of therapy was explored via Spearman correlation analysis.
All costs are presented in national currency (BGN) at the fixed exchange rate of 1 Euro = BGN 1,95583.
Results
Cost, prices and utilization analysis
The number of patients treated with biological medicines increased by 41% over the 5-year period (). For the same period, the total reimbursed cost of biologicals increased with 21% but the per-patient reimbursed cost fell with 40%. Two major reasons might reflect this change: the decrease in prices or the introduction of less costly biosimilars.
Table 1. Reimbursed cost per diagnosis during 2016–2020 (BGN).
The number of patients attributed to the 21 reimbursed diagnoses differed significantly (612 SD in 2016 to 1216 SD in 2020; p < 0.05) – . Rheumatoid arthritis (International classification of diseases (ICD) code M05.8) accounted for 2736 patients in 2016, which increased by 131% to 4662 patients in 2020. The second largest diagnosis was ankylosing spondylitis (ICD M45.0), with 1933 patients reimbursed at the beginning of the observed period reaching 3196 patients in 2020 (80% increase). Psoriatic arthropathies (ICD M07.3) with 1128 in 2016 patients took the third place in the rank list of reimbursed diagnoses with a 75% increase in the number of reimbursed people at the end of the observed period. For the other diagnoses, the number of patients was relatively low and varied between 92 (ICD M08.3) to 1 patient (ICDM45.2; M45.4, and M45.7).
Logically, the cost of therapy of RA was with highest value accounting for nearly 30 mill BGN (appr. 15mill Euro) in 2016 with the growth of 10 million BGN (appr. With 5 Mill Euro) at the end of the period. The per-patient yearly cost of therapy decreased from 10896 BGN (app. 5400 Euro) to 8299 BGN (app. 4250 Euro). The PsA therapy accounted for 26.5 mill BGN (13.3 mill Euro) and increased to 30.3 mill BGN (15.2 mill Euro), while at the same time the per-patient cost also decreased from 13662 to 9481 BGN. The third largest diagnosis, AS, consumed 15 mill BGN (7.5 mill Euro) in 2016 and reached 20.5 mill BGN (10.3 mill Euro) at the end of the period with a similar decrease in the per-patient cost by 3000 Euros for the 5-year period ().
Most of the biological disease modifying antirheumatic medicines (n = 11 INNs), and one JAK inhibitor (tofacitinib) were reimbursed for patients’ therapy during the observed period. Out of them 7 INNs were reimbursed during the whole period (infliximab, adalimumab, secukinumab, etanercept, tocilizumab, golimumab and ustekinumab). Biosimilars were reimbursed for only 2 INNs (infliximab and adalimumab), both with 2 biosimilar products (). We might conclude that patients with arthropathies have a well-balanced access to a variety of biological disease modifying antirheumatic drugs (bDMARD).
Table 2. Reimbursed medicines, cost, and utilization indicators.
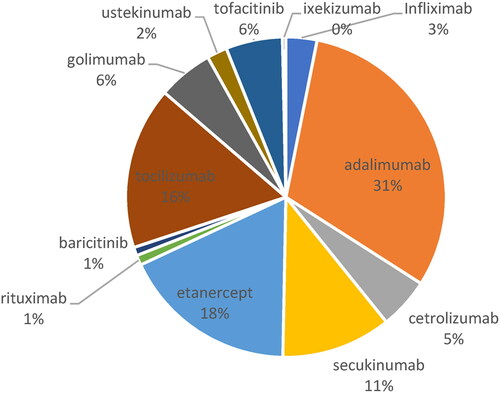
In 2019, adalimumab was the product with highest relative share in the expenditures (31%), followed by etanercept (18%); tocilizumab (16%) and secukinumab (11%) – .
Figure 1. Relative share of the INN expenditures.
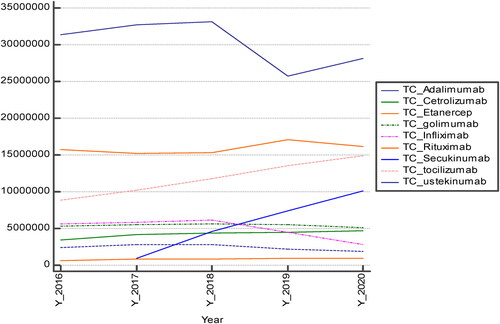
Per year expenditures decreased for adalimumab and infliximab for which biosimilar versions are available and increased for tocilizumab (). All other expenditures remain stable and have statistically significant differences per INN (Kruskal-Wallis p = 0.000005).
Figure 2. Total cost (TC) per year for all observed INNs.
In 2019, the lowest prices per DDD were observed for rituximab (3.40 BGN), followed by that of infliximab (17.92 BGN). The prices of adalimumab (38.13 BGN) and etanercept (34.40 BGN) were twice higher than that of infliximab and almost 10 times higher than that of rituximab (). Therefore, we can consider that the prices of the products are not the leading factor in their prescribing and utilization.
Adalimumab was prescribed for the therapy of 12 ICD codes. The original product held the leading position in expenditures. Before the introduction of the biosimilars, the prices of the original product slightly decreased by 25%, but after the introduction of the two biosimilars in 2019 the prices fell by 43% in comparison with the beginning of the observed period (). The latter resulted also in the decrease of the total reimbursed cost of adalimumab with 11% in 2020 in comparison with 2016. Conversely, the utilization in DDD/1000inh/day rose by 48% within the observed period. We might suggest that the introduction of biosimilars is one of the major reasons for the price decrease, reimbursed cost and utilization increase.
In contrast to adalimumab, the infliximab originator entered the reimbursement practice later than the biosimilars, probably due to company policy. The reimbursed cost of infliximab up to 2018 saw an increase but after the inclusion of the infliximab originator in the reimbursement list, the prices fell by 38% and the reimbursed cost also decreased more than twice when compared to the beginning of the observed period (). It is worth mentioning that, at the beginning of the period, infliximab was prescribed for 5 diagnoses (ICD M05.8; M07.1; M07.3; M07.3; M45.0) but at the end of the period it was prescribed for 4 diagnoses. Patients with ICD M07.1 arthritis mutilans were probably transferred to other biologicals. This change could have also influenced the drop in the reimbursed cost.
The prices of INNs with no biosimilar in the reimbursement list also decreased over the 5-year period but not by such high percentages, which confirms our previous suggestion about the important influence of biosimilars on prices and their decrease. This might explain the high yearly reimbursed cost of secukinumab and tocilizumab. The decrease in the prices of almost all INNs was probably due to the national pricing legislation, which requires price revision every time the price decreases in any one of the 10 reference countries. Such changes happen relatively frequently, so prices are very dynamic.
Comparison of the utilization in DDD/1000inh/day showed that only 2 INNs decreased their utilization (infliximab and rituximab). Adalimumab and etanercept sharply increased their utilization data, as well as tocilizumab and secukinumab with a smaller trend. All other INNs had either stable utilization or a period of reimbursement too short to reveal long-term trends (). Summarising the utilization of all INNs, we can say that it increased nearly two-fold, from 0.5244 to 0.9252 DDD/1000inh/day, for the 5-year period.
Statistical analysis
The correlation analysis among the reimbursed costs of individual INNs showed strong correlation between the expenditures of adalimumab and all other INNs (). There was positive correlation between the expenditures for adalimumab, golimumab, infliximab and ustekinumab, indicating that the increase in the expenditures of adalimumab led to an increase in the expenditures of all other 3 INNs; and vice versa, if the correlation is negative, there is an opposite relation between the expenditures. The rest of the INNs in behaved in a similar manner. What is worth mentioning is that this correlation is important for regulators to monitor more tightly the budget, and in case of an increase in expenditures for high priced INNs, to try to control the costs for other INNs correlated with them.
Table 3. Cost data correlation analysis.
The second correlation analysis was performed to evaluate the influence of the price changes on the utilization and reimbursed cost of all INNs (). We found very strong, positive correlation between the prices and utilization changes for adalimumab during the different years of the observed period. For all medicines, the total cost, utilization and prices were strongly correlated, and statistically significant for most of them. The general tendency was that when prices decreased, the total cost also decreased but the utilization increased, meaning that more people could benefit from biological therapy.
Table 4. Correlation analysis between prices, utilization, and reimbursed cost of observed INNs.
Discussion
There are a few national studies on the prices of biological products and the cost of therapy of arthropathic disorders, but none focussed on the overall reimbursed cost per diagnosis for a 5 year period [Citation4,Citation6,Citation17]. The prices of biological products were explored by Manova et al. [Citation17], which was confirmed by our results that the prices significantly decreased upon the entry of biosimilars or other biological products’ onto the market. The quality of life and disease control were also explored [Citation17], showing that biologicals are effective in the therapy of arthropathies. These results are in accordance with wider studies performed in other central and eastern European countries [Citation18]. Authors found that no specific criteria were applied for the pricing and reimbursement of biosimilars in the selected CEE countries, and that the price of biosimilars was usually reduced compared to original drugs [Citation18]. A decrease in prices with nearly 50% for molecules with biosimilar products were reported by Tachkov et al. [Citation4]. In contrast with previous studies, our study focussed on the overall reimbursed cost for a 5-year period for different arthropathic diagnoses, prescribed biologicals for their therapy, and influence of their prices and utilization on the overall reimbursed cost.
Our results are in agreement with those reported by Schabert et al. [Citation5], according to whom the most often prescribed biologicals were etanercept (15,488 patients; 51.4%), followed by adalimumab (8,959 patients; 29.8%) and infliximab (5,660 patients; 18.8%) . These authors also found that the annual TNF-blocker cost per treated patient was lowest for etanercept, followed by adalimumab and then infliximab [Citation5]. In conclusion, the authors found that in adult patients with rheumatoid arthritis, psoriasis, psoriatic arthritis or ankylosing spondylitis, etanercept had a lower cost per treated patient. In contrast, we found the cost of therapy with rituximab was lower, but the prescribing of adalimumab was the highest.
Another study showed that the cost of therapy could be influenced by the treatment patterns across indications and that etanercept, adalimumab and infliximab were in descending order regarding to the persistence to therapy (52, 49, 67%, respectively) [Citation9]. The limitation of our study is that we did not explore what influenced the physicians’ preferences towards a particular biological therapy.
A longitudinal study performed in Ontario, Canada, with 104,933 patients found that the health care costs associated with RA increased to $8,591 and $4,142 [Citation19]. The comorbidities contributed $1,242. The authors conclude that a large proportion of disease related health care costs are a result of costs associated with RA comorbidities, which may appear many years before diagnosis [Citation19].
Other authors found that the total annual health care costs were nearly 3-fold higher in RA versus non-RA patients ($20 919 vs $7197) and that the major driver of costs in the RA cohort were outpatient costs especially biological therapy [Citation20].
Regarding our study questions, we found that the three major cost driving diagnoses are RA, PsA and AS. Those are the diagnoses with the majority of the patients. None of the INNs was used for all reimbursed diagnoses. One INN was used in the therapy of maximum 12 diagnoses, although almost all are indicated for the treatment of all mentioned arthropathies. Probably other factors such as physicians’ preferences, and companies’ policy play an important role in the prescribing of biologicals.
Conclusions
The cost analysis shows an important place of biologicals for arthropathic diseases therapy. The introduction of biosimilars led to prices and cost decreases, and more patients could benefit from these innovations.
Data availability statement
The data used for the analysis are available from the corresponding author upon reasonable request.
Disclosure statement
No potential conflict of interest was reported by the authors.
Additional information
Funding
References
- Lubrano E, Spadaro A. Pharmacoeconomic burden in the treatment of psoriatic arthritis: from systematic reviews to real clinical practice studies. BMC Musculoskelet Disord. 2014;15:25.
- Martinez-Cutillas J, Alerany-Pardo C, Borrás-Blasco J, et al. The use of adalimumab, etanercept, golimumab and infliximab in rheumatic pathologies: variation between label dosage and real-world use. Expert Rev Pharmacoecon Outcomes Res. 2015;15(5):851–858.
- Moots RJ, Mays R, Stephens J, et al. Burden of dose escalation with tumour necrosis factor inhibitors in rheumatoid arthritis: a systematic review of frequency and costs. Clin Exp Rheumatol. 2015;33(5):737–745.
- Tachkov K, Mitkova Z, Boyadzieva V, et al. Did the introduction of biosimilars influence their prices and utilization? The case of biologic disease modifying antirheumatic drugs (bDMARD) in Bulgaria. Pharmaceuticals. 2021;14(1):64. https://doi.org/10.3390/ph14010064.
- Schabert V, Watson C, Joseph G, et al. Costs of tumor necrosis factor blockers per treated patient using real-world drug data in a managed care population. J Manag Care Pharm. 2013;19(8):621–630.
- Boyadzieva V, Stoilov N, Stoilov R, et al. Quality of life and cost study of rheumatoid arthritis therapy with biological medicines. Front Pharmacol. 2018;9:794.
- Joensuu JT, Aaltonen KJ, Aronen P, et al. Cost-effectiveness of biologic compared with conventional synthetic disease-modifying anti-rheumatic drugs in patients with rheumatoid arthritis: a register study. Rheumatology (Oxford). 2016;55(10):1803–1811. https://doi.org/10.1093/rheumatology/kew264.
- Dalal DS, Zhang T, Shireman TI. Medicare expenditures for conventional and biologic disease modifying agents commonly used for treatment of rheumatoid arthritis. Semin Arthritis Rheum. 2020;50(5):822–826.
- Martínez-López-de-Castro N, Álvarez-Payero M, Samartín-Ucha M, et al. Direct costs in patients with chronic inflammatory arthropathies on biological therapy: a real-world data study. Clin Exp Rheumatol. 2021;39(4):736–745.
- Bonafede M, Joseph G, Princic N, et al. Annual acquisition and administration cost of biologic response modifiers per patient with rheumatoid arthritis, psoriasis, psoriatic arthritis, or ankylosing spondylitis. J Med Econ. 2013;16(9):1120–1128.
- Gu T, Shah N, Deshpande G, et al. Comparing biologic cost per treated patient across indications among adult US managed care patients: a retrospective cohort study. Drugs Real World Outcomes. 2016;3(4):369–381.
- National Statistical Institute. Population database [Internet]. Available from: www.nsi.bg.
- National Health Insurance Fund. Medicines, medical devices, and cost database [Internet]. Available from: www.nhif.bg. Accessed May 2022.
- World Health Organisation. International statistical classification of diseases and related health problems (ICD 10) [Internet]. Available from: https://www.who.int/standards/classifications/classification-of-diseases.
- National Council on Prices and Reimbursement of Medicinal Products. Price registries [Internet]. Available from: www.ncpr.bg.
- World Health Organisation. Introduction to DDD indicators [Internet]. Available from: https://www.who.int/tools/atc-ddd-toolkit/indicators.
- Manova M, Savova A, Vasileva M, et al. Comparative price analysis of biological products for treatment of rheumatoid arthritis. Front Pharmacol. 2018;9:1070. DOI: 10.3389/fphar.2018.01070.
- Kawalec P, Stawowczyk E, Tesar T, et al. Pricing and reimbursement of biosimilars in Central and Eastern european countries. Front Pharmacol. 2017;8:288. DOI: 10.3389/fphar.2017.00288.
- Tatangelo M, Tomlinson G, Paterson JM, et al. Health care costs of rheumatoid arthritis: a longitudinal population study. PLoS One. 2021;16(5):e0251334. https://doi.org/10.1371/journal.pone.0251334.
- Chen C-I, Wang L, Wei W, et al. Burden of rheumatoid arthritis among US medicare population: co-morbidities, health-care resource utilization and costs. Rheumatol Adv Prac. 2018;2:1316–1319.