
 ?Mathematical formulae have been encoded as MathML and are displayed in this HTML version using MathJax in order to improve their display. Uncheck the box to turn MathJax off. This feature requires Javascript. Click on a formula to zoom.
Abstract
The duplication of genetic information (DNA replication) is central to life. Numerous control mechanisms ensure the exact course of the process during each cell division. Disturbances of DNA replication have severe consequences for the affected cell, and current models link them to cancer development. One of the most accurate methods for studying DNA replication is labelling newly synthesised DNA molecules with halogenated nucleotides, followed by immunofluorescence and microscopy detection, known as DNA fibre labelling. The method allows the registration of the activity of single replication complexes by measuring the length of the “trace” left by each of them. The major difficulty of the method is the labor-intensive analysis, which requires measuring the lengths of a large number of labelled fragments. Recently, the interest in this kind of image analysis has grown rapidly. In this project we have developed an algorithm and a lightweight Java application to automatically analyse single DNA molecule images that we have named “DNA size finder”. DNA size finder significantly simplified the analysis of the experimental data while increasing reliability by the standardised measurement of a greater number of DNA molecules. It is freely available and does not require any paid platforms or services to be used. We hope that the application will facilitate both the study of DNA replication control and the effects of various compounds used in human activity on the process of DNA replication.
Introduction
DNA replication is the process in which the cell reproduces an exact copy of its genetic material. Replication of the genome is one of the two main events in the cell life cycle, the other being its division between daughter cells, known as mitosis. In the S-phase, replication in eukaryotes starts from multiple sites called origins of replication. The parallelisation of the process allows it to be completed fast enough (within a few hours) and provides backup replication complexes if any of them stop functioning. The activated replisome complex operates until meeting another one coming from the opposite direction. However, the movement of the replisome complex along the DNA molecule is not unimpeded. Many intrinsic factors (e.g. specific DNA sequences and proteins tightly bound to DNA) and environmental factors (various chemical compounds) slow down or stop replication forks. The state of slowing down or stopping DNA replication complexes is known as “replication stress.” A consequence of replication stress is DNA damage accumulation [Citation1,Citation2]. Damage caused by replication stress is considered to drive the multistep process of converting a normal cell into a cancerous one (called tumorigenesis) [Citation3–5].
On the other hand, excessive replication stress would not allow the completion of the S-phase, and the cell would die. The latter suggests that rapidly dividing cancer cells (and therefore having higher levels of replication stress) would be more susceptible to replication-blocking compounds and thus could be selectively destroyed [Citation6]. These determine the importance of studying the speed of the replication forks and the factors that slow them. In practical terms, they facilitate the discovery of new therapeutic agents and help understand the environmental contaminants’ effects on DNA replication.
DNA fibre analysis is a central technique to gain mechanistic insight into how genotoxic agents (or the deficit of a protein) perturb replication fork dynamics genome-wide at single-molecule resolution [Citation7]. In this assay, cells are fed (consecutively two different) halogenated nucleotide analogues, which get incorporated into the newly synthesised DNA. After a fixed time, cells are lysed, and their DNA is stretched on a glass surface. Then, using antibodies that bind specifically to the incorporated nucleotide analogues, newly synthesised DNA is visualised microscopically. The length of the DNA tracks divided by the labelling time (during which the nucleotide analogue was present in the culture medium) gives the rate of each replication fork. In addition, several key replication parameters such as fork symmetry, origin density, and nucleolytic degradation of nascent DNA following replication stress induction could be monitored [Citation7].
The major disadvantage of this method is the complexity of image analysis - to obtain reliable data, it is necessary to measure many newly synthesised DNA fragments. This is both time-consuming and requires highly trained researchers. In addition to being very laborious, manual counting tends to introduce biases in the results. To increase the quality of fibre labelling data, it is necessary to increase the number of analysed images for statistical reliability and to use strictly set evaluation parameters.
To address the problems associated with the analysis of DNA fibre images, we developed “DNA size finder” - an application for image analysis written from scratch in Java, implementing our own algorithms to automate the image analysis. Thus, we provide a cross-platform, lightweight, easy-to-set-up, easy-to-use and completely free software solution to analyse DNA fibre labelling data. Furthermore, the users can opt for either a completely automated analysis or, by being presented with a detailed visual representation, can manually correct what the software “sees”.
Description of methods and algorithms
Overview of the developed image-processing pipeline
We have developed an image processing pipeline that performs an automated analysis of the image data. The pipeline consists of the following 5 main stages: (1) At the beginning, the images obtained from the hardware are subjected to intensity scaling and noise-removal. This step is optional. (2) The processed images are subjected to greyscale segmentation where the fibre foreground is extracted from the background. (3) Afterwards, the foreground isolated from the images is subjected to thinning. (4) Fibres are isolated by locating their corresponding representing paths with a special traversal system that we have developed. (5) The quality of the located paths is increased via post-processing and their colouring is analysed. An overview of the process is illustrated in .
Figure 1. Overview of the image data during the consecutive processing stages: fibre image after the pre-processing stage (A); separated foreground after the greyscale segmentation (B); skeletons remaining after the thinning process (C); detected fibres after post-processing and feature extraction (D).
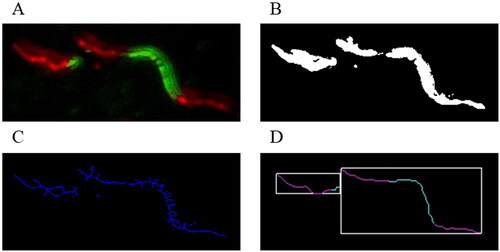
The novelty of our work is mainly in the new methodology that we introduce for feature extraction of multi-coloured fibre structures, more specifically an algorithm for fitting a representing path onto a fibre object in the image, which is crucial for the given task.
Pre-processing of the microscopic images
After the images are acquired they could, if necessary, be subjected to signal enhancement prior to being subjected to future processing. For this purpose, we developed a pre-processing macro in Fiji [Citation8]. It processes original microscopic images by providing intensity scaling and noise removal (using the “Subtract Background” and “Enhance Contrast” built-in commands and median filter).
Greyscale segmentation
After the pre-processing step, each microscopic image is represented as a set of two separate 2D greyscale planes, one for each channel. Due to variations in the intensity of these images, global greyscale segmentation is applied separately for each channel, in order for the pixels of the foreground to be separated from the background for each colour. The used thresholding values are selected automatically by using Otsu’s histogram technique [Citation9]. (In the implemented application, it is also possible to apply manual thresholding instead.) The produced binary images for each channel are combined into a single plane by using the bitwise OR operator. As a result, a single binary image is produced, in which the foreground of the multi-colour fibre is extracted from the background.
Skeletonisation
After the global thresholding, the produced binary image is subjected to skeletonisation using our modification of the Zhang-Suen thinning algorithm [Citation10]. The modification was required because when the original algorithm was tested with experimental images, the produced skeletons often appeared scattered, making them unusable for further processing. The modification consists of the following: Pixels surrounded by four adjacent pixels (with a common side) with a value of true are marked as inner pixels. Then the Zhang-Suen thinning algorithm is modified to remove only pixels (set their value in the binary image to false) only if they have a common side with an inner pixel. This modification significantly reduces the number of occurrences of the problem (of the unmodified algorithm), but as a side effect, it sometimes creates lines in the skeleton with a width of two or three pixels. However, due to the way the produced skeletons are processed later, this problem was not found to create complications later in this algorithm.
Combining binary thresholding with skeletonisation allows a much better definition of the region of interest (ROI) that will be used for further processing.
Fibre detection
After the skeletonisation process is complete, a binary image is produced where only the skeletons of the fibres are separated from the background. This binary image needs to be analysed by locating all fibres on it. Initially the fibres are segmented on a simple connectivity basis, where each two pixels that are a part of the foreground after the thinning are set to be part of a single connected component, only if the distance between them is smaller than an integer parameter called “Maximum Jump Distance”.
- The maximum jump distance defined by the user (in pixels).
This is important, because due to artefacts in the original images of the fibres, the skeletons in the image often appear split, although they belong to the same fibre. Based on the value of this parameter visually split skeletons will be unified during traversal and will be considered parts of the same fibre. To achieve successful results, J needs to be kept low - between 5 and 15 pixels (typically corresponding to 0.5 micrometres).
Afterwards, paths that represent the located fibres must be isolated in the segmented connected components. Each of these paths must lie on pixels that are part of the corresponding component. For this purpose, we have developed a system of two shortest-path traversals based on the concept of the algorithm for finding a diameter of a graph of type tree. Let us denote a previously non-iterated random pixel from the connected component as P1. A shortest-path traversal algorithm (in our case we use a modification of the Breadth first search algorithm) is called to find the distances from P1 to every other pixel in the current segment. After that, the pixel with the largest distance from P1 is marked, and let us denote this farthest pixel as P2. Since P2 will always be in the farthest corners of the skeleton, this algorithm uses it as the first endpoint of the path that will represent the fibre. After P2 is found, with P2 as a starting point, our special traversal is called again; however, in this case, it is also modified with an orientation check. The orientation check limits the turning angle with a maximum value defined from a parameter that may be tuned by the user ().
Figure 2. Description of the orientation check technique. A is the currently traversed pixel, B is the pixel from which A was reached during the traversal and C is the pixel that is checked whether it is reachable. The current turning angle to reach C is represented with α. “α max” is the maximum turning degree. C must lie in the area of the angle A1AA2 in order to be traversed.
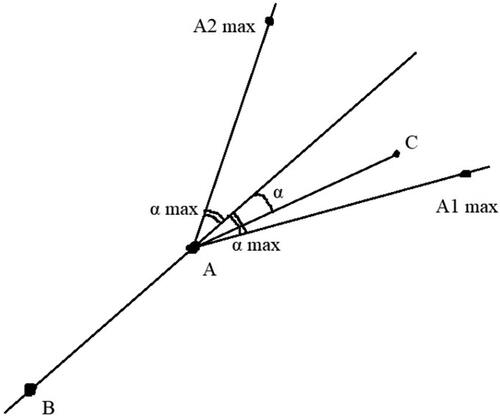
In the cases of intersecting fibres, sharp turns in the skeletons can distinguish what can be part of the same fibre, as a single fibre is extremely unlikely to be curved at a sharp angle after the stretching process. This orientation check helps in the detection of those situations. After the run of the second version of our modified traversal algorithm, the longest shortest path starting from P2 is retrieved, and at this stage, it represents the located fibre. Later, via post-processing its accuracy will be improved.
Post-processing of the data from the detected fibre
After the described method is executed, a path is retrieved whose length represents the fibre’s length. It can be observed that the produced path consists mostly of edges with the maximum possible length – the parameter J. That is because the previously used shortest-path traversal algorithm will find the path’s endpoint by trying to use a minimum number of edges. Using the minimum number of edges to create a path and connecting fixed endpoints in the 2D plane of the image leads to using edges with the longest lengths possible, which leads to the mentioned problem. Calculating the length of the skeletons of small objects in the image with a large value of the maximum jump distance creates a low-quality measurement of the length of these small objects. This can lead to problems in cases of images where it is required to use a larger value for J and smaller fibres are present on the image.
We have solved the following problem by post-processing the path produced by the previous method. Let the initial path consist of E edges and be found with a value for the maximum jump distance defined from the user J. The value of J is set to J/2 (rounded down to the nearest decimal value). The edges are traversed from the first to the last one. Let the current edge be Ex. For Ex is checked if the endpoint of Ex can be reached from the starting point of Ex by using the shortest path algorithm (described previously), but this time the updated value of J is used for the traversal. When the endpoint of Ex is reached, in the original path, Ex is replaced by the path (retrieved from the last run of the shortest path algorithm of edges) connecting the endpoints of Ex. If the other endpoint of Ex is not reached, Ex is left in the original path. The number of times this process is repeated is controlled by a parameter called “Lower resolution bound”. This parameter acts as a lower boundary for the value of J and in the produced path at the end.
Analysis of the fibre colouring
After a path that holds detailed information about the detected fibre’s location on the image is retrieved, it remains to be analysed how the located fibre is coloured. The way we handled the greyscale segmentation, allowed us to separate an entire multi-coloured fibre from the background in a single binary image, including all of its segments stored on separate channels, and to treat it as a single fibre, when fitting a representing path on it. This allows us to traverse each edge of the previously produced path, to calculate the average intensity for each channel in a small area around it and to decide its colour as the channel with the higher average intensity. With this simple trick we can effectively analyse fibres with multiple origins of replication, unlike many previously developed algorithms for this task.
DNA fibre labelling
DNA fibre analysis was performed as described before [Citation11,Citation12]. Briefly, exponentially growing PC3 cells were first incubated with 25 µmol/L chlorodeoxyuridine (CldU) for 10 min and then with 250 µmol/L iododeoxyuridine (IdU) for 30 min [Citation13]. Hydroxyurea (HU) at the indicated concentrations was added simultaneously with the second label (IdU). Spreads were prepared from 2500 cells (suspended in PBS at 1x10⁶ cells/mL). Cell lysis was carried out in fibre lysis solution (50 mmol/L EDTA and 0.5% SDS in 200 mmol/L Tris-HCl, pH 7.5). DNA fibres were spread by tilting the slides ∼25 degrees until the drop of the fibre solution reached the bottom of the slide and was let to dry. Dried slides were processed immediately. Slides were suspended in 2.5 mol/L HCl for 80 min, washed in PBS, and then incubated in blocking buffer (5% bovine serum albumin in PBS) for 40 min. Primary antibodies - mouse anti-BrdU antibody (Becton Dickinson, cat # 347580) to detect IdU and rat anti-BrdU antibody (Abcam cat# Ab6326) to detect CldU - were diluted in blocking buffer and applied overnight. Slides were washed several times in PBS, incubated with secondary antibodies for 60 min and mounted with ProLong Gold anti-fade reagent (Molecular Probes). Images were acquired with Axiovert 200 M microscope (Carl Zeiss) equipped with an Axiocam MR3 camera (Carl Zeiss).
Results
Software implementation details
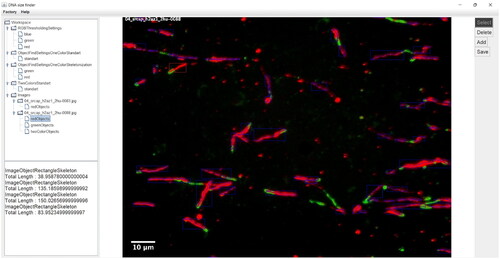
The application “DNA size finder” was developed as a desktop application written in Java [Citation14] (). Our application provides implementation of the entire image processing pipeline without the image pre-processing part. We have developed it in this way so that users can have complete flexibility when choosing the underlying microscopic image pre-processing pipeline. This abstraction in our platform is crucial for making our application platform and experiment independent. Images (pre-processed or not) are imported into our software using the Bio-Formats library [Citation15]. Our application interacts with the API of Bio-Formats by retrieving separate planes from the microscopic images and the associated metadata. The platform “DNA size finder” uses a settings system to store the parameters that are used when the image processing pipeline is being executed. For every setting type, many profiles (instances) can be created by the user with different parameter values, so when a user analyses an image, a pre-created settings profile can be chosen. Each settings profile is automatically saved in the computer’s permanent memory and can be transferred as a file. This allows the analysis performed in our application to be easily reproduced. Another important feature is the batch processing mode called “Factory mode” that allows entire image databases to be analysed without researcher supervision.
Figure 3. An image of the graphical user interface of the “DNA size finder”.
Testing the application
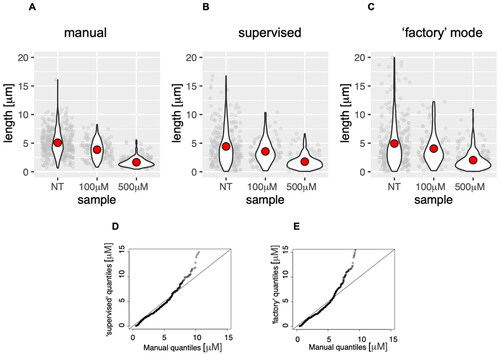
We tested the DNA size finder on images obtained in control cells and cells treated with the low doses of the replication inhibitor HU during the incubation with the second label. Cells were subjected to DNA fibre labelling, and the images were either analysed manually or using the DNA size finder. Data indicated that the application produced similar results to manual counting () both in “normal” (supervised) mode () and in the fully automated “factory” mode (). The comparison of distributions () indicated that DNA size finder results in very good overlap (on the diagonal) with manual data until about 10 µm of length, which are the overwhelming majority under standard labelling conditions. The program output diverged from manual measurements at large fibre lengths, especially evident in the unsupervised analysis. This is due to overlapping fibre images, which could easily be avoided by using fewer cells during spreading to give a smaller number of fibres per frame.
Figure 4. Analysis of DNA fibres (length of the second label) obtained from cells treated with the indicated concentration of HU, subjected to manual analysis (A), or analysis by the DNA size finder in user-supervised (B) and fully automated modes (C). The red dot on violin plots indicates the mean of all measurements (plotted in grey behind the violin plots). Q-Q plots of data distributions produced by DNA size finder in supervised (D) and automated ‘factory’ mode (E).
Discussion
The need to study replication dynamics and the difficulty of analysing images obtained via DNA fibre labelling has spurred the interest in creating automated solutions to the problems in the last two years [Citation13, Citation16]. Here, we describe the algorithm and provide as an example a lightweight Java application to automatically analyse single DNA molecule images. DNA size finder significantly simplified the analysis of the experimental data while increasing reliability by the standardised measurement of a greater number of DNA molecules. Unlike similar solutions, it does not rely on other software tools (except freely available Java Runtime Environment), is multi-platform, does not need a complicated setup, and uses explicitly described algorithms. Furthermore, the DNA size finder offers several modes of operations – single or dual colour evaluation and user-corrected or fully automated image analysis. In addition, by adjusting the object detection settings, the DNA size finder operation can be user optimised for the specific experiment. Finally, the approaches applied may be helpful in other settings requiring image analysis.
Author contributions
All authors contributed equally to this work
Acknowledgements
The opinions, findings, and conclusion or recommendations expressed in the paper are those of the authors and do not necessarily reflect the view of the Antisel Bulgaria Ltd.
Disclosure statement
No potential conflict of interest was reported by the authors.
Data availability statement
The application is free to use and can be accessed at the following link: https://github.com/Teodor03/DNA-size-finder
Additional information
Funding
References
- Branzei D, Foiani M. Maintaining genome stability at the replication fork. Nat Rev Mol Cell Biol. 2010;11(3):1–7.
- Hills SA, Diffley JF. DNA replication and oncogene-induced replicative stress. Curr Biol. 2014;24(10):R435–44.
- Gorgoulis VG, Vassiliou L-VF, Karakaidos P, et al. Activation of the DNA damage checkpoint and genomic instability in human precancerous lesions. Nature. 2005;434(7035):907–913.
- Bartkova J, Rezaei N, Liontos M, et al. Oncogene-induced senescence is part of the tumorigenesis barrier imposed by DNA damage checkpoints. Nature. 2006;444(7119):633–637.
- Halazonetis TD, Gorgoulis VG, Bartek J. An oncogene-induced DNA damage model for cancer development. Science. 2008;319(5868):1352–1355.
- Lecona E, Fernández-Capetillo O. Replication stress and cancer: it takes two to tango. Exp Cell Res. 2014;329(1):26–34.
- Quinet A, et al. Methods enzymol, DNA fiber analysis. Mind the Gap!. 2017;591:55–82.
- Schindelin J, Arganda-Carreras I, Frise E, et al. Fiji: an open-source platform for biological-image analysis. Nat Methods. 2012;9(7):676–682.
- Otsu N. A threshold selection method from gray-level histograms. IEEE Trans Syst, Man, Cybern. 1979;9(1):62–66.
- Zhang TY, Suen CY. A fast parallel algorithm for thinning digital patterns. Commun ACM. 1984;27(3):236–239.
- Hristova RH, Stoynov SS, Tsaneva IR, et al. Deregulated levels of RUVBL1 induce transcription-dependent replication stress. Int J Biochem Cell Biol. 2020;128:105839.
- Schwab RA, Niedzwiedz W. Visualization of DNA replication in the vertebrate model system DT40 using the DNA fiber technique. J Vis Exp 2011;56:e3255.
- Linkert M, Rueden CT, Allan C, et al. Metadata matters: access to image data in the real world. J Cell Biol 2010;189(5):777–82.
- Arnold K, Gosling J, Holmes D. The java programming language. Addison Wesley Professional; 2005.
- Ghesquière P, Elsherbiny A, Fortier E, et al. An open-source algorithm for rapid unbiased determination of DNA fiber length. DNA Repair (Amst). 2019;74:26–37.
- Mohsin A, et al. FiberAI: a deep learning model for automated analysis of nascent DNA fibers; 2020.