
 ?Mathematical formulae have been encoded as MathML and are displayed in this HTML version using MathJax in order to improve their display. Uncheck the box to turn MathJax off. This feature requires Javascript. Click on a formula to zoom.
Abstract
Pulmonary sarcoidosis is a complex inflammatory disease characterized by granulomas in the lung tissue, leading to breathing difficulties and chest pain. Its etiology remains not fully understood, with factors such as allergies, autoimmune responses and genetics playing a role. This study explores the potential of blood microbiome dysbiosis, defined as an imbalance in the microbial ecosystem, as a missing piece of the puzzle in understanding the etiology of the disease. Our objective was to apply a decision-tree supervised machine learning hierarchical model to distinguish potential patterns of microbiome dysbiosis in blood samples from patients with pulmonary sarcoidosis as compared to healthy age-matched controls. Blood microbiome analysis, being individually-specific and stable, offers a unique perspective. Utilizing 16S rRNA gene amplicon sequencing, we analyzed the blood microbiome composition characterized by non-normally distributed and sparse data. Because of the rarity of the disease in Bulgaria, we studied a relatively small patient group, n = 7. The findings were compared to 21 healthy age-matched controls. Bioinformatics and statistical analysis play a pivotal role in microbiome analysis, especially when discerning associations between taxonomic composition and disorders such as pulmonary sarcoidosis. By analyzing the microbial diversity, we identified alterations in the blood microbiome composition between healthy individuals and those with sarcoidosis, which potentially may trigger the disease. Advanced machine learning techniques provided additional power to the analysis, that might be overlooked by the usual group statistics, confirming the differentiation of the diversity within the studied microbiome.
Introduction
Pulmonary sarcoidosis, is an inflammatory disease that has long been a subject of medical concern. It is characterized by the formation of granulomas in the lung tissue and lymph nodes a blood microbiome and may lead to breathing problems, chest pain, wheezing, and significant impairment of the patient’s quality of life [Citation1]. The complete evaluation of the etiology of sarcoidosis is essential, and the potential role of pulmonary microbiome dysbiosis [Citation2–4] and blood microbiome dysbiosis [Citation5, Citation6] is emerging as a significant area of interest.
Dysbiosis refers to the imbalance or maladaptation of the microbial ecosystem within the body, which can lead to various health issues [Citation7]. Among factors such as allergies, autoimmune responses, and genetic predisposition [Citation8], the dysbiosis of the pulmonary and blood microbiome might be the missing piece of the puzzle in unravelling the etiology of pulmonary sarcoidosis.
Blood as a medium is capable of easily translocating microbial species across different body systems, such as the lung-gut axis and gut-brain axis [Citation9, Citation10]. The composition and abundance of the blood microbiome are highly individually specific [Citation6] and dynamically stable, not influenced dramatically by daily factors, such as diet, as compared to the gut microbiome [Citation11]. This makes it highly probable for the blood microbiome to reflect and be involved in the etiology of systemic diseases [Citation12], such as pulmonary sarcoidosis.
Microbiome analysis is typically based on metagenomic sequencing, either amplicon or whole-genome-based. These methods provide complex microbiome taxonomy descriptions and produce abundance composition datasets, characterized by being non-normally distributed, non-balanced, heterogenous, sparse, stratified and hierarchically organized [Citation13]. The necessary data analytical approaches are a mix of machine learning, bioinformatics and statistics, aiming not only toward the analysis per se but also for a reasonable validation [Citation14, Citation15].
Pulmonary sarcoidosis is a complex and relatively rare disease in Bulgaria with an incidence of less than 10 cases per 100,000 people [Citation16]. It is difficult to collect a large number of patients, which is also a challenge in data analysis. Thus, throughout the study period, only a small group of eligible patients potentially met the full extent of predefined inclusion/exclusion criteria.
Machine learning methods, with their ability to find meaningful information below the level of noise, i.e. random data variations, can address these challenges [Citation17]. Decision tree methods are particularly interesting in the context of biostatistics upgrade, as they can deal with complex data, are not dependent on data distribution, and can work with smaller sample sizes, among other benefits [Citation14].
In our previous study [Citation18], we applied a more conventional aproach to characterize the blood microbiome dysbiosis in sarcoidosis patients. Here, the aim was to reanalize the patterns of microbiome dysbiosis by applying a decision tree model. The meta-analysis in this study searched for novel taxonomic compositional patterns in blood microbiomes, aiming to uncover potential associations of specific microbial phyla and genera to the etiology of sarcoidosis.
Subjects and methods
Ethical considerations
The study was approved by the Institutional review board/Institutional ethics committee (IRB/IEC) of the National Center of Infectious and Parasitic Diseases at Sofia, Bulgaria (Number IRB00006384; Protocol Number 3/27.07.2020). All patients and healthy volunteers signed informed consent forms.
Study participants and sample collection
The study analyzed the blood microbiome data of patients diagnosed with pulmonary sarcoidosis and 21 healthy age-matched controls [Citation18]. Between November 2020 and November 2022, 7 patients diagnosed with pulmonary sarcoidosis stage two were enlisted in the study. The seven patients (mean age ± SD, 48.33 ± 19.14; 4 males) were diagnosed positively with stage two pulmonary sarcoidosis [Citation18]. None of the patients were receiving antibiotics or other sarcoidosis-related medicinal treatment at the time of the sample collection. The healthy controls included 11 males and 10 females (mean age ± SD, 49.21 ± 17.45). Blood samples of the patients and 21 clinically healthy individuals were collected in 5 mL Vacutainer tubes with K3EDTA as an anticoagulant (Vacutainer K3E, BD, USA).
DNA extraction and microbiome analysis
DNA extraction: Three mililiters of whole blood were lysed in 10 mL of 0.2 µm filtered and autoclaved dH2O with DNase I 1 U/mL for 1 h at 37 0C. DNase I was added to eliminate cell-free and human DNA. Microbial cells were collected after centrifugation at 4000 rpm for 20 min (MPW M-diagnostics, cat. 102MD/V56, rotor cat. 12139; Med. Instruments, Warsaw, Poland). The microbial pellet was washed twice with 10 mL dH2O. Each wash was followed by centrifugation. The cell pellet was resuspended in 1 mL of lysis buffer (500 mmol/L NaCl, 50 mmol/L Tris-HCl, pH 8.0, 50 mmol/L EDTA, and 4% sodium dodecyl sulphate). The cell suspension was subjected three times to vigorous vortexing or optional homogenization with silica/zirconium 0.1/0.3 mm beads (cat. 11079101z and 11079103z, Biospec Products, Bartlesville, OK, USA) on a microtube homogenizer (cat. D1030-E, Benchmark Scientific Inc., Sayreville NJ, USA) for 3 min at 4000 rpm. After the microbial cell lysis, DNA isolation was performed according to the previously described procedure [Citation6,Citation19,Citation20]. The extracted DNA was resuspended in 100 µL of sterile DNA/RNA-free dH2O (cat. W4502, Sigma-Aldrich, Burlington, VT, USA). DNA typical yield was >150 ng/µL with a 260/280 nm ratio > 1.7. 16S rRNA amplicon sequencing was performed in-house. The V4 hypervariable region of the 16S rRNA gene was sequenced with NEXTFLEX® 16S V4 Amplicon-Seq Kit 2.0 for Illumina Platforms, cat. 4203-03, PerkinElmer, Inc. Waltham, MA, USA. Sequencing was performed by Illumina NovaSeq 6000 (Illumina Inc., San Diego, CA, USA). Sequencing data were subjected to quality control measures to ensure accuracy and reliability. The Illumina software MiSeq Reporter version 2.5.1.3 (Illumina Inc., San Diego, CA, USA) and the Illumina Sequence Analysis Viewer version 2.1.8 (Illumina Inc., San Diego, CA, USA) were used for imaging and evaluation of the sequencing run performance. Primary data analysis and quality control (QC), including signal processing and de-multiplexing, were performed by the MiSeq Reporter. The Trimmomatic tool was used to trim low quality bases and sequencing adapters. Remaining short reads below 75 bp were filtered out as well as DNA of human origin.
Data analysis
Data preprocessing. The raw data were preprocessed to remove noise and artifacts Metagenomic taxonomical identification was based on clean data after quality control. Kraken2 taxonomic classification software (v2 2.1.2; SILVA database, version 2022-02-02T162959Z) was used for taxonomic profiling [Citation21, Citation22]. We used the European server of the Galaxy platform for biostatistics (https://usegalaxy.eu/) [Citation23]. Further, Bayesian Reestimation of Abundance was applied to the taxonomy reports produced by Kraken 2 to compute accurately the microbial abundancy level for each metagenomic sample [Citation21]. The bioinformatic workflow for taxonomic identification is available at https://usegalaxy.eu/u/yhodzhev/w/taxonomic-profiling-and-visualization-of-metagenomic-data. The Operational Taxonomic Units (OTUs) table with genus-level microbiome abundance information was generated using the Pavian package [Citation24]. Sequence clustering was performed with a similarity index of 97% [Citation25, Citation26]. We set up an abundance threshold of ≥ 10 reads to accept a valid OTU. Microbial genera found in negative controls (water, reagents and air) were excluded from further analysis. OTU tables were subjected to statistical evaluation for microbial composition and raw read abundance for the purposes of the study. In this study, the number of reads per OTU/taxon per condition, being the simplest index average count of OTUs, will be referred to as abundance further in the text.
Statistical analysis
Upon inspection of the overall microbial composition (), OTU counts from the four predominant phyla and the top ten genera were chosen to characterize the potential association of the microbiome with sarcoidosis.This subsetting was greatly influenced by the pronounced rise in data sparsity observed in subsequent taxa. Descriptive statistics (Mean ± Standard deviation) were performed on taxonomic abundance data for the initial characterization of the sarcoidosis and control groups [Citation27]. For illustration purposes dispersion of the mean was represented by the Standard error of the mean (± SEM, ), which is a conservative estimate of the population dispersion [Citation28]. To assess the abundance data normality, the non-parametric Shapiro–Wilk test was applied [Citation29]. The microbiome abundance data, as anticipated, did not conform to a normal distribution, a conclusion supported by the Shapiro–Wilk test results (results are given in ).
Figure 1. Overall characterization of the core blood microbiome abundance (mean ± SEM) at two levels: (A) abundance difference in sarcoidosis and control groups plotted on a decimal logarithmic scale. (B) Top 4 phyla and (C) top 10 genera. (D) Average divergence between the sarcoidosis and control groups according to individual taxon abundance at phylum and (E) genus level. Asterisks indicate significant differences (Kruskal-Wallis group statistics) as follows: ***p < 0.001; **p < 0.01; *p < 0.05; ns – not significant; SEM – standard error of the mean.
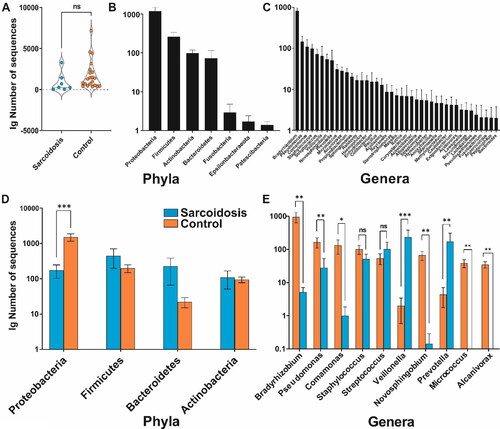
Table 1. Confusion matrix for assessing binary classification model.
Assuming this non-normal distribution, the Kruskal–Wallis test was employed to compare the sarcoidosis and control groups [Citation30]. The Kruskal-Wallis test is an appropriate choice in this context because it is a non-parametric method designed to test for differences between two or more groups without the assumption of normally distributed data. Moreover, the Kruskal-Wallis statistics tests if samples originate from one and the same distribution regardless of the shape of this distribution, even if the central tendency (median) differs making it robust against outliers and skewed distributions [Citation30]. For all statistical calculations SciPy library was used under Python version 3.11.4 [Citation31].
A supervised machine learning analysis was used to enrich information about sarcoidosis related microbiome changes obtained by the simple group comparison [Citation14]. For this purpose, we applied a classification decision tree model, where the predicted outcome is the discrete class to which the data belongs (in our case binary, i.e. sarcoidosis vs. control) on the OTU abundance data at the phylum and genus level [Citation32]. Classification tree algorithms are often utilized to analyze the intricate, non-normally distributed data. We opted for this methodology due to its capacity in managing smaller sample sizes and its agnosticism to data distribution [Citation33]. Machine learning was applied in Python version 3.11.4 using the scikit-learn library [Citation34]. For binary classification, the Gini impurity is a measure of the probability of a randomly chosen case being incorrectly classified:
where j represents the number of classes in the target variable (i.e. sarcoidosis vs. control); p(i) represents the ratio of Correct/False classified number of samples per node [Citation35].
The Gini impurity is 0 when all values at a node belong to the same class, and it is maximized (0.5) when the cases are randomly split between the classes. The most relevant features (taxa) contributing to the binary classification model were identified using feature importance analysis. Feature selection in the context of binary classification is based on the concept of impurity reduction [Citation35]. Each taxon is evaluated by its ability to split the data in a way that makes the resulting consecutive nodes purer than the parent node (g(i) is closer to 0). The models obtained with the lowest nodes’ impurity (feature selection) at the phylum and genus level were reported in the results section. For a given decision tree, the importance I(f) of a feature f is calculated as follows [Citation35]:
where
is the weighted number of samples reaching node n (the weight being the proportion of samples reaching the node to the total number of samples).
is the reduction in impurity due to the split at node n. It was calculated as follows:
where i(n) is the impurity of the node n;
is the proportion of samples going to the left resulting of node n;
is the impurity of the left resulting of node n;
is the proportion of samples going to the right resulting of node n;
is the impurity of the right resulting of node n.
The generated binary decision tree models for phylum and genus features were validated using the train-test split approach [Citation35]. The entire dataset was divided into two distinct subsets: training and testing. Specifically, 80% of the samples were allocated to the training set, while the remaining 20% (5 controls vs. 1 sarcoidosis patient) constituted the test set. This partitioning ensured that our model was exposed to a broad spectrum of data during training, while still reserving a substantial portion for validation purposes. Using the designated training set, we trained our binary decision tree classifier. Post-training, the predictive capability of the model was rendered using the test set. The performance of the classification model is assessed by a confusion matrix. For the binary classification model, this matrix consists of four entries () [Citation35].
Then, the accuracy of the method can be defined using the terms from a confusion matrix as follows:
Results
Microbiome analysis
The blood samples of 7 patients with sarcoidosis and 21 healthy individuals were collected and sequenced by a targeted 16S rRNA gene amplicon metagenomic approach. A total of nearly 295 000 raw sequences, including human sequences, were obtained after quality checking and preprocessing. After removing the sequencing reads of human origin, the taxonomic analysis assigned over 45 000 sequences to 1541 bacterial OTUs, including 118 OTUs above the abundance threshold (>10 reads). shows that the sarcoidosis group grand mean (855 ± 1179) was marginally lower than that in the controls (1773 ± 1760; (H (1) = 2.79; p > 0.06). OTUs were distributed in 6 bacterial phyla () and 41 genera (). Proteobacteria, Actinobacteria, Firmicutes and Bacteroidetes formed a group of 4 most prominent phyla (). By applying a classical descriptive statistics approach and using the original data set, we characterized the four most abundant phyla.
Genera Bradyrhizobium (5.14 ± 5.01 vs. 947.14 ±1448.25), Pseudomonas (27.86 ± 66.29 vs. 165.67 ±257.74), Comamonas (1 ± 2.2 vs. 131.52 ± 276.63) and Novosphingobium (0.14 ± 0.38 vs. 66.29 ± 92.05) showed significantly lower abundance in sarcoidosis. Although the abundance of the genus Staphylococcus was also numerically lower in the sarcoidosis group (51.57 ± 52.61 vs. 101.71 ± 142.42), this effect was not significant, suggesting a more consistent distribution across the groups for these genera. shows the differences in the distribution of the reads for each phylum between the two groups. Notably, Alcanivorax and Micrococcus genera were completely absent in the sarcoidosis group (; ).
Table 2. Shapiro–wilk test of normality for the distribution of the OTU reads for sarcoidosis and control group at phylum and genus level.
Table 3. Descriptive statistics of sarcoidosis vs. control group at phylum level. Mean ± SD along with the Kruskal–Wallis group statistics results.
shows that, among the analyzed genera, only Veillonella (232.71 ± 398.24 vs. 2 ± 6.51) and Prevotella (172.57 ± 358.06 vs. 4.38 ± 11.99) exhibited significantly higher abundance in the sarcoidosis group relative to the control group (). Numerically, Streptococcus abundance (sarcoidosis − 100.43 ± 172.63 vs. control − 53.95 ± 88.45) followed a similar pattern but did not reach significance ().
Table 4. Descriptive statistics of sarcoidosis vs. control group at genus level abundance (mean ± SD) along with the Kruskal–Wallis group statistics results.
By applying the non-parametric Kruskal–Wallis test, Proteobacteria phylum showed significantly higher abundance in the control vs. sarcoidosis group (, ). Numerically, the abundance of Firmicutes, Bacteroidetes and Actinobacteria was higher in the sarcoidosis group relative to the control (); however, it did not reach significance ().
presents the results of the Kruskal-Wallis test on various bacterial genera to discern differences in their distributions with the significance of their between-group differences.
Decision tree classification
We built a hierarchical binary decision tree based on the abundance data (). OTUs data at phylum and genus levels were subjected to the model. demonstrates the branching (bifurcation) into tree construction calculated from the phylum abundance data. The root was based on the phylum Proteobacteria, which splits the samples at an abundance threshold of ≤ 168. The root contained a total of 22 samples: 16 controls and 6 sarcoidosis patients, with respective Gini impurity measured at 0.397. The corresponding left node (Node 1) of the root contained 4 samples, all correctly classified in the sarcoidosis group (Gini = 0). Node 1 did not spit further, i.e. it is an end node. The right Node 2 is based on the phylum Firmicutes abundance with a threshold of 519.5. It contained 18 samples and was classified as a control (16 controls vs. 2 sarcoidoses; Gini = 0.198). The respective right Node 3 is an end node with 22 samples and is classified as a control node (16 control vs. 6 sarcoidosis samples; Gini = 0.397). Node 4 branched out Bacteroidetes phylum at abundance threshold of 519.5 (Gini = 0.444). It was classified as a sarcoidosis node (2 sarcoidoses vs. 1 control sample). It further split into Nodes 5 and 6, which were end nodes with Gini impurity values of 0 ().
Figure 2. Decision tree diagrams. The control group is marked in orange; the sarcoidosis group is in blue. (A) Phylum; (B) Genus. Boxes represent nodes of classification with bifurcation. All nodes contain information about the classification process: threshold, number of samples, impurity coefficient and proportion of correctly vs. falsely classified samples. Bifurcation or splitting of the classification is shown with arrows. Nodes that did not bifurcate contained samples from only one class. The intensity of the color shade of each node indicates higher confidence in classification.
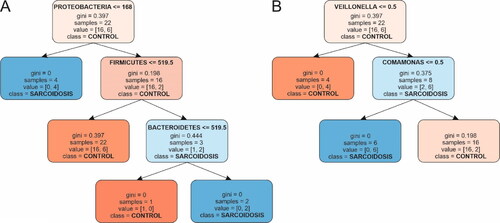
In the decision tree classification, the feature importance was calculated for each phylum. Proteobacteria stood out as the most influential genus with a feature importance of 0.593, followed by Firmicutes (0.255) and Bacteroidetes (0.153). Actinobacteria, however, did not show any contribution to the model with a feature importance of 0.
shows the decision tree structure at the genus level. It starts with a root node, which was split based on the genus Veillonella at a threshold of 0.5; Gini = 0.397. It consisted of 22 samples and was classified as a control node (16 control vs. 6 sarcoidosis). Following this, the left node (Node 1) of the root, represents instances where Veillonella abundance is less than or equal to 0.5. It became a terminal node containing 4 control samples (Gini = 0). On the contrary, the right node (Node 2), represents conditions where Veillonella exceeds 0.5 and bifurcates further on the basis of the genus Comamonas. The Node 3 split is determined by a threshold of 20.0 and is characterized by a Gini impurity of 0.375. It is classified as sarcoidosis with (2 control vs. 6 sarcoidosis samples). Further, this node bifurcates into two end nodes, Node 4 and Node 5, both indicating a Gini impurity index of 0. Node 4 was classified as sarcoidosis with 6 sarcoidosis samples, whereas Node 5 contained 2 control samples exclusively.
At the genus level, the feature importance of Veillonella was 0.656, followed by Comamonas at 0.344. In contrast, the genera Bradyrhizobium, Pseudomonas, Staphylococcus, Streptococcus, Novosphingobium, Prevotella, Micrococcus and Alcanivorax all expressed lack of contribution, each having a feature importance of 0.
During the validation phase, the decision tree model was tested at the phylum and genus levels. The results from this train-test evaluation were identical. All 6 tested subjects (1 of whom was with sarcoidosis) were classified correctly with values of false positive and false negative classifications of 0.
Discussion
With advancements in 16S rRNA gene metagenomic sequencing techniques, the role of microbiome analysis in various diseases became essential. We performed microbiome analysis to assess the microbial richness and abundance of blood samples in sarcoidosis patients and healthy individuals. For this purpose, the average OTUs count was used as a simple measure of microbiome abundance. The taxonomic compositional features of the OTUs provided insight into which phyla and genera were most influential in the classification process, reflecting their potential relevance in discriminating between sarcoidosis and control conditions.
In this study, a machine learning decision tree algorithm was applied to the blood microbiome data of sarcoidosis patients and healthy controls [Citation18] to reveal any microbial abundance patterns at phylum and genus levels potentially associated with sarcoidosis etiology. A total of 295,000 quality-filtered sequences were assigned to 1541 OTUs, revealing Proteobacteria, Actinobacteria, Firmicutes and Bacteroidetes as dominant phyla in both groups. A stark shift in the abundance of Proteobacteria between sarcoidosis patients and controls (174.57 ± 189.20 vs. 1514 ± 1646.69, ) was observed. This marked difference, potentially suggests its role or presence in the systemic manifestations of sarcoidosis. Other phyla, however, did not exhibit statistically significant differences between the two groups. At the genus level, Veillonella and Prevotella abundance was significantly higher in sarcoidosis than in controls (, ). In contrast, genera that showed significantly reduced abundance in sarcoidosis as compared to the control samples were Bradyrhizobium, Pseudomonas, Comamonas and Novosphingobium (, ). Two genera, Alcanivorax and Micrococcus, were absent in the sarcoidosis group.
These results were used as a reference to identify the additional information that machine learning analysis could provide. The decision tree classifier successfully distinguished between the sarcoidosis and control groups with high accuracy on the testing data. The decision tree visualization provided insights into the decision-making process, showing how the abundance of specific phyla and genera was used to classify patients and controls. Proteobacteria (0.593) had the highest feature importance, indicating that it plays a significant role in distinguishing the two groups, which is in concordance with the group statistics. The Actinobacteria importance equaled zero, suggesting it might not be influential in the classification. Interestingly, phylum Firmicutes (0.255, ) had an almost doubled coefficient in comparison to phylum Bacteroidetes (0.153), suggesting that changes in its abundance may be a decisive indicator of the blood microbiome dysbiosis associated with sarcoidosis. The genus Veillonella had the highest feature importance (0.656), indicating that this measure governed the discrimination between the sarcoidosis and control groups. The Comamonas genus contributed substantially to the classification as it represents the second highest feature importance by value (0.344). The remaining genera had a feature importance of 0, indicating that they did not contribute to the decision-making process in the trained model.
Implications to the sarcoidosis etiology
The aforementioned alterations in blood microbiota abundance and composition correspond to those observed in other pulmonary diseases [Citation36], supporting the idea that sarcoidosis may be partially driven by microbiome dysbiosis, which has a complex taxonomical origin. A higher relative abundance of Proteobacteria is linked to various pulmonary conditions like COPD (Chronic Obstructive Pulmonary Disease), asthma and cystic fibrosis [Citation37]. Some species may even be related to infections resulting in granulomas, such as Corynebacterium diphtheriae [Citation36, Citation37]. Firmicutes, mainly Gram-positive, are abundant in human blood [Citation38] and lungs [Citation37] and have been identified in patients with severe COPD conditions [Citation39].
The Veillonella and Comamonas stood out in their contribution to the decision tree classification model, with significant feature importance values (). This observation further supported the dominant role of Proteobacteria at the phylum level shown above. This emphasis on Veillonella is particularly intriguing given its higher abundance in sarcoidosis patients. Veillonela species were previously reported in association with various pulmonary conditions such as asthma and COPD [Citation40–42]. Moreover, еnrichment of lower airway microbiota with oral symbiotic bacteria such as Veillonella could be associated with lung granulomatosis and/or carcinogenesis [Citation43]. The overall decline in the abundance of Comamonas spp. may be linked to localized outgrowth of normally suppressed latent microbial forms, such as C. testosteroni and C. acidovorans. These species were occasionally isolated in the respiratory secretions of patients with cystic fibrosis, suggesting their potential role as opportunistic pathogens [Citation44–46]. Such conditions are frequent complication in stage IV sarcoidosis [Citation47]. The clear bifurcations in the decision tree, based on these genera, further emphasized their potential synergetic contribution in sarcoidosis etiology. However, the direct involvement of Comamonas and Veillonella in granuloma formation or their causative role in pulmonary inflammatory diseases needs further experimental confirmation.
Limitations
This study has some limitations. A key constraint of this study was the possibility of the depletion of microbial DNA by the host DNA. Secondly, in our model we included only the first ten most abundant genera. The count of OTUs is an arbitrary measure of microbial abundance, which may lead to inaccurate comparisons of microbial taxa between different studies. The rigorous selection criteria for patients with stage II sarcoidosis resulted in a smaller patient cohort, but leading to a more homogenous study population. The targeted amplicon sequencing was conducted using a sole kit in a single sequencing run, resulting in comparable contamination outcomes.
Conclusions
This study represents the application of a machine learning decision tree algorithm on blood microbiome data in the context of the ethiology of pulmonary sarcoidosis. By upgrading the tradional methods for microbiome analysis with advanced machine learning techniques, we observed additional structural changes in the blood microbiota that may be associated with sarcoidosis. Our findings suggest a multifaceted involvement and interplay of microorganisms. These results may have implications for understanding the etiology of sarcoidosis and may guide research for further improvements in diagnosis and treatment. Validation with a larger dataset including shotgun sequencing and complementary analyses would be essential to verify these findings and explore their biological relevance.
Acknowledgements
The author expresses his gratitude to his colleagues Stefan Panaiotov, Borislava Tsafarova and Dimitar Vasilev for their valuable suggestions and critical comments.
Disclosure statement
No potential conflict of interest was reported by the author(s).
Data availability statement
The data that support the findings of this study are available from the author (YH), upon reasonable request.
Additional information
Funding
References
- Grunewald J, Grutters JC, Arkema EV, et al. Sarcoidosis. Nat Rev Dis Primer. 2019;5:1.
- Clarke EL, Lauder AP, Hofstaedter CE, et al. Microbial lineages in sarcoidosis. A metagenomic analysis tailored for low-microbial content samples. Am J Respir Crit Care Med. 2018;197(2):225–10. doi: 10.1164/rccm.201705-0891OC.
- Gupta S, Shariff M, Chaturvedi G, et al. Comparative analysis of the alveolar microbiome in COPD, ECOPD, sarcoidosis, and ILD patients to identify respiratory illnesses specific microbial signatures. Sci Rep. 2021;11(1):3963. doi: 10.1038/s41598-021-83524-2.
- Zimmermann A, Knecht H, Häsler R, et al. Atopobium and fusobacterium as novel candidates for sarcoidosis-associated microbiota. Eur Respir J. 2017;50(6):1600746. doi: 10.1183/13993003.00746-2016.
- Panaiotov S, Filevski G, Equestre M, et al. Cultural isolation and characteristics of the blood microbiome of healthy individuals. AiM. 2018;08(05):406–421. doi: 10.4236/aim.2018.85027.
- Panaiotov S, Hodzhev Y, Tsafarova B, et al. Culturable and non-culturable blood microbiota of healthy individuals. Microorganisms. 2021;9(7):1464. doi: 10.3390/microorganisms9071464.
- Carding S, Verbeke K, Vipond DT, et al. Dysbiosis of the gut microbiota in disease. Microb Ecol Health Dis. 2015;26:26191. doi: 10.3402/mehd.v26.26191.
- Gerke AK. Treatment of sarcoidosis: a multidisciplinary approach. Front Immunol. 2020;11:545413. doi: 10.3389/fimmu.2020.545413.
- Amati F, Stainer A, Mantero M, et al. Lung microbiome in idiopathic pulmonary fibrosis and other interstitial lung diseases. Int J Mol Sci. 2022;23(2):977–977. doi: 10.3390/ijms23020977.
- Dang AT, Marsland BJ. Microbes, metabolites, and the gut–lung axis. Mucosal Immunol. 2019;12(4):843–850. doi: 10.1038/s41385-019-0160-6.
- He Y, Wu W, Zheng H-M, et al. Regional variation limits applications of healthy gut microbiome reference ranges and disease models. Nat Med. 2018;24(10):1532–1535. doi: 10.1038/s41591-018-0164-x.
- Cheng HS, Tan SP, Wong DMK, et al. The blood microbiome and health: current evidence, controversies, and challenges. Int J Mol Sci. 2023;24(6):5633. doi: 10.3390/ijms24065633.
- Czech L, Stamatakis A, Dunthorn M, et al. Metagenomic analysis using phylogenetic placement—a review of the first decade. Front Bioinform. 2022;2:871393. doi: 10.3389/fbinf.2022.871393.
- Hernández Medina R, Kutuzova S, Nielsen KN, et al. Machine learning and deep learning applications in microbiome research. ISME Commun. 2022;2(1):98. doi: 10.1038/s43705-022-00182-9.
- Hernández-Terán A, Mejia-Nepomuceno F, Herrera MT, et al. Dysbiosis and structural disruption of the respiratory microbiota in COVID-19 patients with severe and fatal outcomes. Sci Rep. 2021;11(1):21297. doi: 10.1038/s41598-021-00851-0.
- Tsafarova B. Sarcoidosis. Probl Infect Parasit Dis. 2021;49(1):32–36. doi: 10.58395/pipd.v49i1.55.
- Topçuoğlu BD, Lesniak NA, Ruffin MT, et al. A framework for effective application of machine learning to microbiome-based classification problems. mBio. 2020;11(3):e00434-20. doi: 10.1128/mBio.00434-20.
- Hodzhev Y, Tsafarova B, Tolchkov V, et al. Visualization of the individual blood microbiome to study the etiology of sarcoidosis. Comput Struct Biotechnol J. 2023;22:50–57. doi: 10.1016/j.csbj.2023.10.027.
- Baughman RP, Culver DA, Judson MA. A concise review of pulmonary sarcoidosis. Am J Respir Crit Care Med. 2011;183(5):573–581. doi: 10.1164/rccm.201006-0865CI.
- Yu Z, Morrison M. Improved extraction of PCR-quality community DNA from digesta and fecal samples. BioTechniques. 2004;36(5):808–812. doi: 10.2144/04365ST04.
- Lu J, Rincon N, Wood DE, et al. Metagenome analysis using the kraken software suite. Nat Protoc. 2022;17(12):2815–2839. doi: 10.1038/s41596-022-00738-y.
- Wood DE, Lu J, Langmead B. Improved metagenomic analysis with kraken 2. Genome Biol. 2019;20(1):257. doi: 10.1186/s13059-019-1891-0.
- Afgan E, Nekrutenko A, The Galaxy Community, et al. The galaxy platform for accessible, reproducible and collaborative biomedical analyses: 2022 update. Nucleic Acids Res. 2022;50:w345–W351.
- Breitwieser FP, Salzberg SL. Pavian: interactive analysis of metagenomics data for microbiome studies and pathogen identification. Schwartz R, editor. Bioinformatics. 2020;36(4):1303–1304. doi: 10.1093/bioinformatics/btz715.
- Blaxter M, Mann J, Chapman T, et al. Defining operational taxonomic units using DNA barcode data. Philos Trans R Soc Lond B Biol Sci. 2005;360(1462):1935–1943. doi: 10.1098/rstb.2005.1725.
- Sneath PHA, Sokal RR. Numerical taxonomy: the principles and practice of numerical classification. San Francisco: W. H. Freeman; 1973.
- The Human Microbiome Project Consortium. Structure, function and diversity of the healthy human microbiome. Nature. 2012;486(7402):207–214. doi: 10.1038/nature11234.
- The Integrative HMP (iHMP) Research Network Consortium. The integrative human microbiome project. Nature. 2019;569(7758):641–648. doi: 10.1038/s41586-019-1238-8.
- Shapiro SS, Wilk MB. An analysis of variance test for normality (complete samples). Biometrika. 1965;52(3–4):591–611. doi: 10.1093/biomet/52.3-4.591.
- Kruskal WH, Wallis WA. Use of ranks in one-criterion variance analysis. J Am Stat Assoc. 1952;47(260):583–621. doi: 10.1080/01621459.1952.10483441.
- Virtanen P, Gommers R, Oliphant TE, et al. SciPy 1.0: fundamental algorithms for scientific computing in python. Nat Methods. 2020;17(3):261–272. doi: 10.1038/s41592-019-0686-2.
- Studer M, Ritschard G, Gabadinho A, et al. Discrepancy analysis of state sequences. Sociol Methods Res. 2011;40(3):471–510. doi: 10.1177/0049124111415372.
- Chen X, Wang M, Zhang H. The use of classification trees for bioinformatics. Wiley Interdiscip Rev Data Min Knowl Discov. 2011;1(1):55–63. doi: 10.1002/widm.14.
- Pedregosa F, Varoquaux G, Gramfort A, et al. Scikit-learn: machine learning in python. J Machine Learning Res. 2011;12:2825–2830.
- Sammut C, Webb GI, editors. Encyclopedia of machine learning. New York; London: Springer; 2010.
- Dickson RP, Schultz MJ, van der Poll T, et al. Lung microbiota predict clinical outcomes in critically ill patients. Am J Respir Crit Care Med. 2020;201(5):555–563. doi: 10.1164/rccm.201907-1487OC.
- Dickson RP, Erb-Downward JR, Martinez FJ, et al. The microbiome and the respiratory tract. Annu Rev Physiol. 2016;78(1):481–504. doi: 10.1146/annurev-physiol-021115-105238.
- Païssé S, Valle C, Servant F, et al. Comprehensive description of blood microbiome from healthy donors assessed by 16S targeted metagenomic sequencing. Transfusion (Paris). 2016;56(5):1138–1147. doi: 10.1111/trf.13477.
- Sze MA, Dimitriu PA, Hayashi S, et al. The lung tissue microbiome in chronic obstructive pulmonary disease. Am J Respir Crit Care Med. 2012;185(10):1073–1080. doi: 10.1164/rccm.201111-2075OC.
- Crisafulli E, Bernardinello N, Alfieri V, et al. A pulmonary infection by Actinomyces odontolyticus and Veillonella atypica in an immunocompetent patient with dental caries. Respirol Case Rep. 2019;7(9):e00493. doi: 10.1002/rcr2.493.
- Dickson RP, Erb-Downward JR, Freeman CM, et al. Changes in the lung microbiome following lung transplantation include the emergence of two distinct pseudomonas species with distinct clinical associations. Davis IC, editor. PLoS One. 2014;9(5):e97214. doi: 10.1371/journal.pone.0097214.
- Ke L, Chen L, Yaling Y, et al. Investigation on the pathological mechanism of frequent exacerbators with chronic obstructive pulmonary disease based on the characteristics of respiratory flora. Front Med (Lausanne). 2021;8:816802. doi: 10.3389/fmed.2021.816802.
- Sun Y, Wen M, Liu Y, et al. The human microbiome: a promising target for lung cancer treatment. Front Immunol. 2023;14:1091165. doi: 10.3389/fimmu.2023.1091165.
- LiPuma JJ. The changing microbial epidemiology in cystic fibrosis. Clin Microbiol Rev. 2010;23(2):299–323. doi: 10.1128/CMR.00068-09.
- Coenye T, Goris J, Spilker T, et al. Characterization of unusual bacteria isolated from respiratory secretions of cystic fibrosis patients and description of Inquilinus limosus gen. nov., sp. nov. J Clin Microbiol. 2002;40(6):2062–2069. doi: 10.1128/JCM.40.6.2062-2069.2002.
- LiPuma JJ, Currie BJ, Peacock SJ, et al. Burkholderia, stenotrophomonas, ralstonia, cupriavidus, pandoraea, brevundimonas, comamonas, delftia, and acidovorax. In: Jorgensen JH, Carroll KC, Funke G, et al. editors. Manual of clinical microbiology [internet]. Washington, DC, USA: ASM Press; 2015. p. 791–812. doi: http://doi.wiley.com/10.1128/9781555817381.ch43.
- Aryal S, Nathan SD. Contemporary optimized practice in the management of pulmonary sarcoidosis. Ther Adv Respir Dis. 2019;13:1753466619868935. doi: 10.1177/1753466619868935.