
Abstract
Southwest China is one of the most concentrated regions of wild kiwifruit germplasm. With the increased instances of extreme weather and the impact of human activities, the wild kiwifruit population is being destroyed. However, there is little research on the wild kiwifruit resources. Therefore, strengthening research on wild resources of kiwifruit and determining the genetic diversity of kiwifruit are essential. In this study, 110 wild kiwifruit germplasms were collected as test materials. We selected 13 primers out of 256 pairs to analyze the genetic diversity. A total of 178 loci were amplified, including 175 polymorphic loci, accounting for 98.31%. The genetic similarity coefficient ranged from 0.551 to 0.905, with an average of 0.721. The effective allele number (Ne), Nei’s gene diversity index (H) and Shannon’s information index (I) were 1.452, 0.245 and 0.439, respectively. Very low genetic differentiation (Gst: 0.051) and very high gene flow (Nm: 11.899) were observed. When the genetic similarity coefficient was 0.652, the kiwifruit germplasms were divided into four categories, and the geographical distribution of samples in different categories was inconsistent. The result of principal coordinate analysis (PCoA) and structure analysis showed that the population of wild kiwifruit was divided into two subgroups. Our research contributed to identifying the genetic background of wild kiwifruits in Guizhou Province, China, and can be an important reference for the protection of wild kiwifruit and the breeding of new kiwifruit varieties.
Introduction
Kiwifruit is a nutritious fruit that is rich in vitamin C and various trace elements [Citation1]. Because of its unique chemical composition and antioxidant and anti-inflammatory effects, it has unique medicinal value [Citation2]. In recent years, Kiwifruit has attracted increasing attention worldwide due to its huge economic value and nutritional composition. Large areas of cultivation are found in the Mediterranean coastal areas of Europe, in Chile in South America, China in East Asia, Iran in West Asia, and New Zealand in Oceania [Citation3]. There are approximately 66 species of kiwifruit worldwide, and China is the origin of kiwifruit, with 62 species [Citation4]. China’s annual production of kiwifruit exceeds 2.1 million tons, accounting for more than half of the world’s total production [Citation5]. Southwest China has abundant rain and heat, complex terrain and a diverse microclimate, and is in the overlapping area of the distribution areas of A. chinensis var. chinensis and A. chinensis var. deliciosa [Citation6]. Southwest China is one of the most abundant resources of wild kiwifruit in China, with many undeveloped and identified wild kiwifruit resources. Primitive germplasm resources are the material basis for breeding new varieties and sustainable development in the industry [Citation7]. The identification and evaluation of germplasm resources are particularly important. However, with the rapid development of the kiwifruit industry, research on wild kiwifruit germplasm resources has been relatively scarce. Therefore, it is essential to clarify the genetic background of wild kiwifruit germplasm resources and identify valuable kiwifruit resources to promote the protection of wild kiwifruit resources and the development of new varieties.
Molecular markers can reveal the genetic variation of species at the DNA level [Citation8]. These markers are less influenced by external factors, such as the environment, and markers based on PCR systems have high stability and high repeatability [Citation9–11]. The sequence-related amplified polymorphism (SRAP) marker was proposed by the University of California in 2011; this marker amplifies different sample resources from a pair of special primer sequences and subsequently analyses species diversity via gel electrophoresis [Citation12]. This marker is simple, efficient, stable and rich in polymorphisms and has been widely used in germplasm identification, genetic diversity analysis and genetic fingerprinting, such as for peaches [Citation13], citruses [Citation14], grapes [Citation15] and persimmons [Citation16]. In the study of genetic diversity of kiwifruit using SRAP, Bin Jing et al. [Citation17] analyzed the genetic diversity and phylogenetic relationships of wild and cultivated kiwifruit species using SRAP primers, providing a reference for kiwifruit breeding and future research on genetic diversity in wild kiwifruit [Citation17]. However, it is seldom used in the study of the genetic diversity of kiwifruit on a broader scale.
In this study, we used SRAP molecular marker technology to analyse the genetic diversity and genetic relationships of 110 kiwifruit germplasm resources, aiming to reveal the genetic background and population structure characteristics of wild kiwifruit in Guizhou Province, China at the molecular level. These findings can provide a basis for the development of excellent kiwifruit varieties and contribute to the effective protection and utilisation of wild kiwifruit resources.
Materials and methods
Materials
The experimental material was obtained from 110 wild kiwifruit germplasms collected by our research group in Guizhou Province, China () from August 2016 to September 2021 (). We collected seven tender leaves from each sample, stored them in a sampling box with dry ice, and brought them back to the laboratory on the same day. After the return to the laboratory, the samples were quickly frozen with liquid nitrogen and placed in an ultra-low temperature refrigerator for future use.
Figure 1. Sampling area of the Kiwifruit material.
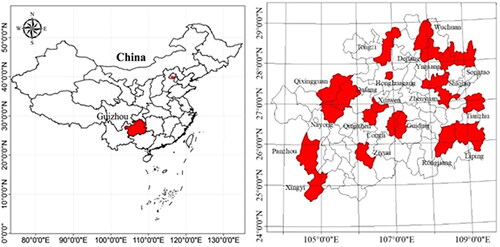
Table 1. Kiwifruit germplasm resources used in this study.
Methods
Extraction of genomic DNA from kiwifruit leaves
The collected leaves were ground thoroughly in liquid nitrogen with a mortar and pestle. Total genomic DNA was extracted by a Plant Genomic DNA Kit (DP305-3, Tiangen; Beijing; China; https://www.tiangen.com/content/details_40_21504.html) according to the manufacturer’s instructions. A NanoDrop 8000 spectrophotometer (Thermo Fisher Scientific, Waltham, MA, USA) and 1% agarose gels were used to detect the concentration and quality of the extracted DNA. The extracted DNA was diluted to a mass concentration of 50 ng/μL and stored in an ultralow temperature refrigerator at −80 °C for later use.
SRAP-PCR procedure
The SRAP primers used in this study were prepared by TIANGEN BIOTECH (BEIJING) CO.,LTD. based on the 26 primer sequences of Jing et al. [Citation17]. Nine kiwifruit DNA samples (No. 8, 20, 24, 30, 37, 47, 61, 88, 91) were randomly selected as templates to screen 169 pairs of SRAP primers (13 forward primers and 13 reverse primers were paired with each other) [Citation18], and primers with good polymorphism and clear bands were selected for amplification of all the DNA samples (). A 20 μL reaction system was adopted, and the method of Zhang et al. [Citation16] was used and improved, using the following ingredients: template DNA 25 ng, primer concentration 2*0.50 μmol/μL, and master mix 10 μL (including 3.0 mmol/L MgCl2, 500 µmol/L dNTPs, 0.1 U Taq DNA polymerase, 100 mmol/L KCl, 20 mmol/L Tris-HCl, KT201, Tiangen, Beijing, China). The procedure of SRAP-PCR amplification was: 94 °C, predenaturation for 5 min; then, five cycles of denaturation at 94 °C for 1 min, annealing at 45 °C for 1 min, and extension at 72 °C for 1 min (Veriti™ 96-Well Fast Thermal Cycler, ABI, USA). Thereafter, the annealing temperature was set according to the primer table (), and the other temperature values remained unchanged, and then 35 cycles were carried out. Finally, the reaction was extended at 72 °C for another 10 min and stored at 4 °C. The amplified products were analysed with 1.5% agarose gel electrophoresis (1 x TAE buffer, 100 V for 45 min) and gels were analyzed in the SYNGENE automatic gel imager.
Table 2. The SRAP primers used in the test.
Data analysis
After electrophoresis, the bands were read, and the clear bands in the same position were recorded as 1; absence of these bands was recorded as 0; and a 0/1 matrix was established. The genetic similarity coefficient of 110 samples was calculated by NTSYS pc-2.10 software. Cluster analysis was carried out by UPGMA, and the cluster tree was constructed with iTOL v5 [Citation19]. The effective allele number (Ne), Nei’s gene diversity index (h) and Shannon’s information index (I) of the polymorphic primers were calculated via POPGENE 1.32 software [Citation20] using the software Structure2.3.4 [Citation21]. The optimum and subgroup number were predicted, the subgroup number k value was set to 1–10, the operation was repeated 150 times, and StructureHarvester.py was used [Citation22]. The script calculates ΔK, analyses the genetic structure of the population based on the ΔK index and obtains the most suitable k value, and, according to the integrated CLUMPAK, [Citation23] generates the resulting diagram. The R version 4.2.1 ggplot2 [Citation24] Package was used for principal coordinate analysis (PCoA).
Results
Genetic diversity analysis of kiwifruit
A total of 178 DNA loci were amplified from the 13 pairs of SRAP primers, 175 of which were polymorphic, accounting for 98.3% of the total loci. This may be due to the large number of samples [Citation25]. The average polymorphism rate was 97%. The average number of amplified bands per primer pair was 13.69, among which the primers Me5-Em4 amplified the most bands (19). Primer Me5-Em7 generated the lowest number of amplified bands (8) (). The average number of effective alleles per primer pair was 1.452, and Nei’s gene diversity (H) varied from 0.182 to 0.401, with an average value of 0.254. The highest H value was obtained for the primer combination for Me5-Em1 (0.401), and the lowest H value was obtained for the primer combination for Me3-em3 and Me5-Em7 (0.182). Shannon’s information index (I) of each primer ranged from 0.317 to 0.585, with an average value of 0.439, indicating a moderate level of genetic diversity. The highest I value was for the primer combination Me5-Em1 (0.585), and the lowest I value was for the primer combination Me3-Em3 (0.317). The sizes of the products amplified by the SRAP primers were distributed mainly from 250 to 2000 bp. The results showed that the genetic diversity of 110 kiwifruit materials was high. The locus information produced by the same primer is different in different kinds of kiwifruit, and there were also some differences when amplifying different samples in the same area. The results showed that the SRAP markers could differentiate 110 kiwifruit germplasm materials at the genomic DNA level
Table 3. SRAP primers used in this study and their polymorphisms.
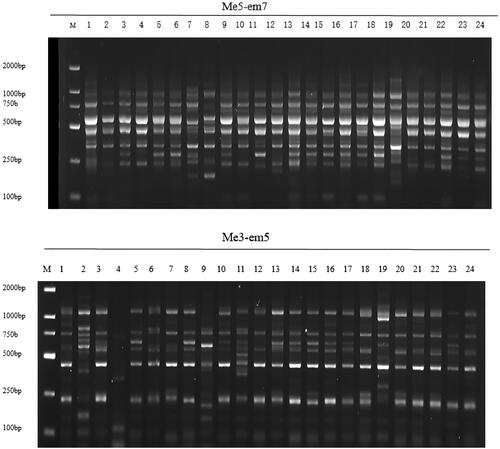
The study area is divided into two geographical units, namely, the Pearl River basin area (a) and the Yangtze River basin area (b), and the genetic similarity coefficient (GS: 0.976) between these two areas was high. The population in the Yangtze River basin had all polymorphic loci (175) and the highest Nei’s gene diversity (h = 0.315), while the population in the Pearl River basin had the lowest number of polymorphic bands (145) and lowest Nei’s gene diversity (H = 0.271). The total genetic diversity (Ht), intra-population genetic diversity (Hs) and interpopulation gene differentiation coefficient (Gst) of the studied wild kiwifruit population were 0.308, 0.295 and 0.051, respectively, and the intrapopulation gene diversity was much greater than the interpopulation gene differentiation coefficient. The gene flow (Nm) was 11.899, which indicated that there was no significant genetic differentiation between the populations and that gene exchange between populations and within populations was very frequent. shows the amplification results of several materials through several primer combinations.
Figure 2. Amplification map generated by several SRAP primers in No. 1–24 kiwifruit materials. M is DL2000 DNA marker (MD114, Tiangen, Beijing, China).
Cluster analysis based on SRAP molecular markers
The genetic similarity coefficient (GS) of the 110 kiwifruit materials ranged from 0.551 to 0.905, with an average of 0.721 and a range of 0.354. Among them, Germplasm No. 51 and Germplasm No. 53 had the closest genetic relationship (GS: 0.905), both of which were A. chinensis var. deliciosa collected in the Yangtze River valley, while Germplasm No. 05 (A. callosa var. henryi) and Germplasm No. 87 (A. chinensis var. deliciosa) had the farthest genetic relationship, with a similarity coefficient of 0.551.
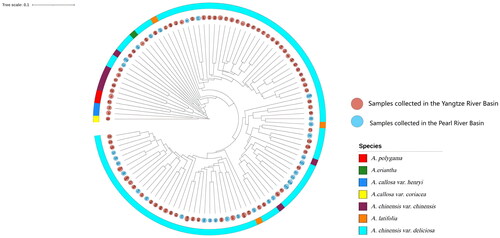
When the genetic similarity coefficient was 0.652, the clustering results divided the tested wild kiwifruit into four categories (). The different species were not strictly distinguished in the corresponding groups during clustering. To a certain extent, there was a complicated distribution of these species in wild kiwifruit, and the genetic similarity between A. chinensis var. chinensis and A. chinensis var. deliciosa was greater than that between other species. When clustering, most wild kiwifruit germplasms from the same or adjacent areas were clustered in the same group. For example, wild kiwifruit germplasms from Guiyang and Xiuwen (average genetic similarity coefficient (GS): 0.852) and germplasm from Leigong Mountain (average genetic similarity coefficient (GS): 0.831) were obtained; however, many distant regions clustered in the same group, such as germplasms collected from Guiding, Congjiang and Nayong, which were collected from locations that were far away from each other, but had high genetic similarity (average genetic similarity coefficient (GS): 0.831).
Figure 3. Dendrogram of 110 Actinidia germplasms based on SRAP markers.
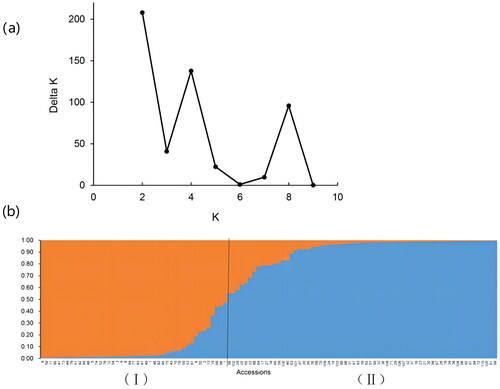
To further analyse the genetic structure of the germplasm resources in wild kiwifruit, we calculated the population structure of 110 samples using the STRUCTURE software, with K set to 1–10. When K = 2, the maximum value of ΔK appeared (). The samples were divided into two subgroups: Subgroup I (orange) was composed of all the germplasms from the Yangtze River Basin, and Subgroup II (blue) was composed of all the germplasms from the Pearl River Basin and some germplasms from the Yangtze River Basin. In a smaller dimension, the germplasm resources of both the first subgroup and the second subgroup were very complex and came from many regions.
Figure 4. Structure analysis of individuals at K = 2. Evaluation value of ΔK (a); genetic structure diagram (b) of 110 accessions at K = 2.
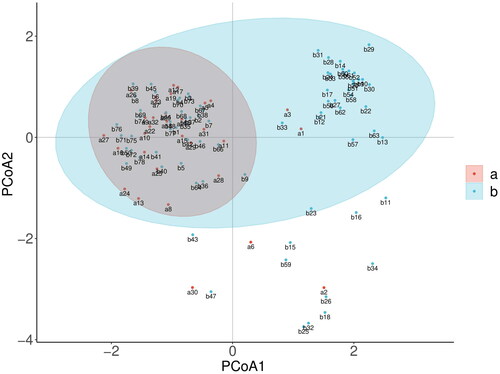
All individuals were divided into two subgroups in the PCoA, which was in agreement with the STRUCTURE analysis. The two river basin groups overlapped with each other, and the Pearl River basin group was included in the Yangtze River basin group. The mixed model of the studied wild populations (), which included the Pearl River Basin population (a) and the Yangtze River Basin population (b), was further validated.
Figure 5. Distribution of 110 individuals by PCoA analysis. Pearl River Basin population (a), Yangtze River Basin population (b).
Discussion
Molecular marker technology provides a more accurate means for genetic analysis of kiwifruit. This approach is not affected by environmental changes or by the expression of genes and involves the whole genome of plants. Using molecular markers to study the genetic stability of plants can overcome the problems existing in morphological identification, such as changeable natural environments, inaccurate explanations of genetic variation and limited genetic information [Citation26].
Studying the genetic variation of wild kiwifruit germplasm is the premise of exploring excellent resources for genetic improvement and crossbreeding [Citation4]. Evaluating the genetic diversity and genetic differentiation pattern of kiwifruit varieties and germplasm resources can provide specific parent materials for cultivating hybrid off-spring with excellent agronomic traits and are important in providing protection strategies for the loss of genetic diversity in the breeding process [Citation27–29]. The polymorphism ratio, effective allele number (Ne) and Shannon’s information index (I) are important indicators used to measure the level of genetic diversity of a species. In this study, 110 kiwifruit germplasm resources were analysed by 13 pairs of SRAP markers, a total of 178 bands were amplified, and the proportion of polymorphic bands was 98.3%, with an average of 13.69 points per primer pair; these findings are similar to the results of Zhang et al. [Citation18] and Jing et al. [Citation30]. The proportion of polymorphic bands and the number of amplified bands per primer pair were more than in previous research results using SCoT, ALFP, ISSR and other markers [Citation31–33]. The genetic similarity coefficient ranged from 0.551 to 0.905, with a range of 0.354 and an average of 0.721. The average values of the observed allele number (Na), effective allele number (Ne), Nei’s gene diversity index (H) and Shannon’s information index (I) were 1.983, 1.452, 0.254 and 0.439, respectively, which are high values. These findings indicated that the SRAP marker can be used as an effective marker to analyse the genetic diversity of kiwifruit, and the above results also support these studies.
Gene flow from other populations can directly change the original gene frequency of the population, affect the genetic structure and make populations with frequent gene exchange tend to be genetically consistent. Higher gene flow is helpful for improving the genetic diversity of plant populations, which is an important factor affecting the genetic structure of plant populations [Citation34]. The total genetic diversity (Ht), intrapopulation genetic diversity (Hs) and interpopulation genetic differentiation coefficient (Gst) of the wild kiwifruit population in the different regions were 0.308, 0.295 and 0.051, respectively. The gene flow (Nm) was 11.899, which was far greater than the coefficient of genetic differentiation among populations. Previous studies have also shown high gene flow and low genetic differentiation in populations of A. chinensis var. deliciosa [Citation17,Citation31–33]. Similar to our research, there is extensive genetic exchange between populations of wild kiwifruit, which is also the reason for the high genetic variability within the population [Citation35]. Moreover, this difference may also be the cause of the large number of wild germplasms with multiple interspecific phenotypes found in the investigation. Generally, the genetic diversity of the 110 kiwifruit wild resources tested is high, the genetic diversity within the population is high, and gene exchange between populations in different regions is very frequent.
When 110 kiwifruit germplasms were clustered and the genetic similarity coefficient was 0.652, the wild kiwifruit samples were divided into four categories. The clustering basically conformed to the traditional morphological classification of kiwifruit, and some different strains of kiwifruit germplasm were interspersed with each other in the group; this was most obvious in the two groups of kiwifruit, which further confirmed that traditional kiwifruit is a variety of wild kiwifruit and that there is high genetic similarity between them [Citation27]. During early diffusion in wild kiwifruit, there was gene infiltration between different populations [Citation34]. Along the junction of A. chinensis var. chinensis and A. chinensis var. deliciosa, wild kiwifruit is an important material for the development of new kiwifruit varieties. There are frequent natural crosses between different strains of wild kiwifruit, and the genetic background of wild kiwifruit in Southwest China is very complicated [Citation3]. Mixed distribution of wild kiwifruit germplasm from different regions in the principal coordinate analysis map was also in agreement with the large number of kiwifruit germplasms with mixed phenotypic characteristics found in previous research [Citation6].
The collected samples were analysed by STRUCTURE analysis and principal coordinate analysis (PCoA), and the samples were divided into two groups. The genetic difference in the germplasm collected in the Yangtze River basin was greater than that in the Pearl River basin. In the studied area, the Yangtze River basin has a larger area and more diverse topography and natural environment, while the Pearl River basin has a smaller area and mainly mountainous topography, with fewer topographic changes than the Yangtze River basin. Therefore, it may be inferred that vast and locally diverse areas promote the genetic variation of wild kiwifruit, while narrower distribution areas are associated with lower genetic diversity [Citation35]. It is also possible that the genetic variation in the mountain range has been limited. Kiwifruit mostly grows on the banks of streams and valleys. On the one hand, the land is fertile; on the other hand, seeds can spread with water flow, and rivers may function in promoting the early spread of kiwifruit [Citation36,Citation37]. Almost all of the germplasm from the Pearl River basin area is included in the Yangtze River basin area. Wild kiwifruit in these two regions may have similar genetic backgrounds or common origins, and their common ancestors may spread from the Yangtze River basin area in the east to the Pearl River basin area in the southwest [Citation6]. In addition, many A. chinensis var. deliciosa accessions belonging to the same strain were found according to the PCoA results and STRUCTURE analysis, and one group was collected in a low-altitude hilly area such as Guiyang. The other group comprises accessions from high-altitude mountainous areas with Wumeng Mountain as the central area. This grouping may be related to differences in the geographical environment, such as temperature and precipitation, between these two areas [Citation38]. In the Wumeng Mountain area, the altitude is high, the precipitation is low, the temperature is low, and karst landforms are widely distributed; moreover, Guiyang and other locations have low altitudes, high precipitation, high air humidity and high soil organic matter content.
By combining UPGMA cluster analysis with PCoA, we found that the genetic relationships between accessions in similar areas are comparable and that germplasms from the same area are more likely to cluster together; however, germplasms from different areas can also group with each other. There may be a phenomenon in which germplasms from different geographical sources adapt to the environment and thus undergo gene exchange. The germplasms that were not clustered together represented distant genetic relationships and great differences in genetic background. Therefore, in the future, when the germplasm of kiwifruit is improved, germplasms with distant genetic relationships and excellent quality traits can be used for crossbreeding, which can not only yield offspring with rich genetic differences but also improve the genetic diversity of kiwifruit germplasm to a certain extent [Citation39,Citation40].
Conclusions
Our results showed that the SRAP markers, which are a low-cost and simple technique, can be used to evaluate the genetic diversity of Actinidia. The wild kiwifruit germplasm in Southwest China has high genetic diversity, a very high level of gene flow and a high level of genetic differentiation within the population and is a potential breeding resource pool in the future. The Yangtze River basin population has the richest genetic diversity, while the Pearl River population has relatively low genetic diversity, and the two populations have very similar genetic backgrounds or common origins. With the increase in extreme climate conditions and the threat to biodiversity, it is highly important to strengthen the protection and utilisation of germplasm resources in wild kiwifruit, and the results from our research can provide a reference for these efforts.
Author contributions
Data curation, visualization and writing—original draft, X.M.; investigation, Z.H.; data curation, T.L.; formal analysis, Y.Y; resources, writing—review and editing, W.S.; funding acquisition and supervision, W.L. All authors have read and agreed to the published version of the manuscript.
Disclosure statement
No potential competing interest was reported by the authors.
Data availability statement
All data are available from the corresponding author [WL] upon reasonable request.
Additional information
Funding
References
- Liu X, Wu R, Bulley SM, et al. Kiwifruit MYBS1-like and GBF3 transcription factors influence l-ascorbic acid biosynthesis by activating transcription of GDP-L-galactose phosphorylase 3. New Phytol. 2022;234(5):1–12. doi: 10.1111/nph.18097.
- Sanz V, López-Hortas L, Torres MD, et al. Trends in kiwifruit and byproducts valorization. Trends Food Sci. Technol. 2021;107:401–414. doi: 10.1016/j.tifs.2020.11.010.
- Zhong CH, Huang WJ, Li DW, et al. Dynamic analysis of global kiwifruit and industry development and fresh fruit trade. China Fruit. 2021;7:101–108.
- Huang H, Liu Y. Natural hybridization, introgression breeding, and cultivar improvement in the genus Actinidia. Tree Genet. Genomes. 2014;10(5):1113–1122. doi: 10.1007/s11295-014-0771-8.
- FAO Database. https://www.fao.org/faolex/zh/.
- Wang Z, Zhong C, Li D, et al. Cytotype distribution and chloroplast phylogeography of the Actinidia chinensis complex. BMC Plant Biol. 2021;21(1):325. doi: 10.1186/s12870-021-03099-y.
- Li Y, Wang L. Genetic resources, breeding programs in China, and gene mining of peach: a review. Hortic. Plant J. 2020;6(4):205–215. doi: 10.1016/j.hpj.2020.06.001.
- Winter P, Kahl G. Molecular marker technologies for plant improvement. World J Microbiol Biotechnol. 1995;11(4):438–448. doi: 10.1007/bf00364619.
- Gupta M, Chyi YS, Romero-Severson J, et al. Amplification of DNA markers from evolutionarily diverse genomes using single primers of simple-sequence repeats. Theor Appl Genet. 1994;89(7–8):998–1006. doi: 10.1007/bf00224530.
- Chen L, Chen F, He S, et al. High genetic diversity and small genetic variation among populations of Magnolia wufengensis (Magnoliaceae), revealed by ISSR and SRAP markers. Electron. J. Biotechnol. 2014;17(6):268–274. doi: 10.1016/j.ejbt.2014.08.003.
- Xie Q, Liu ZH, Wang SH, et al. Genetic diversity and phylogenetic relationships among five endemic Pinus taxa (Pinaceae) of China as revealed by SRAP markers. Biochem. Syst. Ecol. 2015;62:115–120. doi: 10.1016/j.bse.2015.08.005.
- Li G, Quiros CF. Sequence-related amplified polymorphism (SRAP), a new marker system based on a simple PCR reaction: its application to mapping and gene tagging in Brassica. Theor Appl Genet. 2001;103(2-3):455–461. doi: 10.1007/s001220100570.
- Ahmad R, Potter D, Southwick S. Genotyping of peach and nectarine cultivars with SSR and SRAP molecular markers. jashs. 2004;129(2):204–210. doi: 10.21273/JASHS.129.2.0204.
- Uzun A, Yesiloglu T, Aka-Kacar Y, et al. Genetic diversity and relationships within Citrus and related genera based on sequence related amplified polymorphism markers (SRAPs). Sci. Hortic. 2009;121(3):306–312. doi: 10.1016/j.scienta.2009.02.018.
- Guo D, Zhang J, Liu C, et al. Genetic variability and relationships between and within grape cultivated varieties and wild species based on SRAP markers. Tree Genet. Genomes. 2012;8(4):789–800. doi: 10.1007/s11295-011-0464-5.
- Guo DL, Luo ZR. Genetic relationships of some PCNA persimmons (Diospyros kaki Thunb.) from China and Japan revealed by SRAP analysis. Genet Resour Crop Evol. 2006;53(8):1597–1603. doi: 10.1007/s10722-005-8717-5.
- Jing Z, Xu M, Lei Y. Genetic diversity and relationships between and within kiwifruit (Actinidia) wild species and cultivated varieties using SRAP markers. IJBCRR. 2016;15(3):1–7. doi: 10.9734/IJBCRR/2016/29091.
- Kun Z, Zhou Y, Li Y, et al. Genetic diversity analysis of kiwifruit germplasm based on SRAP and SCoT markers. J. Fruit Sci. 2021;38:2059–2071. doi: 10.13925/j.cnki.gsxb.20210264.
- Hu G, Jiang Q, Wang Z, et al. Genetic diversity analysis and core collection construction of the Actinidia chinensis complex (kiwifruit) based on SSR markers. Agronomy. 2022;12(12):3078. doi: 10.3390/agronomy12123078.
- Kumar J, Agrawal V. Assessment of genetic diversity, population structure and sex identification in dioecious crop, Trichosanthes dioica employing ISSR, SCoT and SRAP markers. Heliyon. 2019;5(3):e01346. doi: 10.1016/j.heliyon.2019.e01346.
- Hubisz MJ, Falush D, Stephens M, et al. Inferring weak population structure with the assistance of sample group information. Mol Ecol Resour. 2009;9(5):1322–1332. doi: 10.1111/j.1755-0998.2009.02591.x.
- Evanno G, Regnaut S, Goudet J. Detecting the number of clusters of individuals using the software STRUCTURE: a simulation study. Mol Ecol. 2005;14(8):2611–2620. doi: 10.1111/j.1365-294X.2005.02553.x.
- Jakobsson M, Rosenberg NA. CLUMPP: a cluster matching and permutation program for dealing with label switching and multimodality in analysis of population structure. Bioinformatics. 2007;23(14):1801–1806. doi: 10.1093/bioinformatics/btm233.
- Villanueva RAM, Chen ZJ. Ggplot2: elegant graphics for data analysis (2nd ed.). Meas: Interdiscip. Res. Perspect. 2019;17(3):160–167. doi: 10.1080/15366367.2019.1565254.
- Sun WH, Wu FF, Cong L, et al. Assessment of genetic diversity and population structure of the genus Vicia (Vicia L.) using simple sequence repeat markers. Grassl. Sci. 2022;68(3):205–213. doi: 10.1111/grs.12356.
- Li J, Wang SM, Luo L, et al. Genetic diversity of ginger germplasm resources based on SRAP markers. Mol. Plant Breed. 2021;19(23):1–29. http://kns.cnki.net/kcms/detail/46.1068.S.20211203.0004.002.html. (In Chinese)
- Ferguson AR. The need for characterisation and evaluation of germplasm: kiwifruit as an example. Euphytica. 2007;154(3):371–382. doi: 10.1007/s10681-006-9188-2.
- Frankham R. Challenges and opportunities of genetic approaches to biological conservation. Biol. Conserv. 2010;143(9):1919–1927. doi: 10.1016/j.biocon.2010.05.011.
- Glaszmann JC, Kilian B, Upadhyaya HD, et al. Accessing genetic diversity for crop improvement. Curr Opin Plant Biol. 2010;13(2):167–173. doi: 10.1016/j.pbi.2010.01.004.
- Jing ZB, Xu M, Lei YS. Construction and application of SRAP-PCR system to analyze genetic relationship of Actinidia. Acta Hortic. Sin. 2016;43:337–346. doi: 10.16420/j.issn.0513-353x.2015-0331.
- Qi B, Wang F, Ye K, et al. Genetic diversity of 52 species of kiwifruit (Actinidia chinensis Planch.). Horticulturae. 2023;9(7):753. doi: 10.3390/horticulturae9070753.
- Zhang H, Zhang S, Wu S, et al. Genetic diversity of 33 kiwifruit germplasms based on AFLP markers. J. Biol. 2018;35:29–33.
- Zou Y, Huang M, Hou RT, et al. Application of ISSR marker technology in genetic research of kiwifruit. J. J. Southwest Univ., ChongQing. 2008;111–115. doi: 10.13718/j.cnki.xsxb.2008.01.025.(In Chinese)
- Slatkin M. Gene flow and the geographic structure of natural populations. Science. 1987;236(4803):787–792. doi: 10.1126/science.3576198.
- Hamrick JL, Godt MJW Effects of life history traits on genetic diversity in plant species. Philos. Trans: biol. Sci. 1996;351:1291–1298.
- Xiang L, Li XL, Wang XS, et al. Genetic diversity and population structure of Distylium chinense revealed by ISSR and SRAP analysis in the three gorges reservoir region of the Yangtze River, China. Glob. Ecol. Conserv. 2020;21:e00805. doi: 10.1016/j.gecco.2019.e00805.
- Hogbin PM, Peakall R. Evaluation of the contribution of genetic research to the management of the endangered plant Zieria prostrata. Conserv. Biol. 1999;13(3):514–522. doi: 10.1046/j.1523-1739.1999.98182.x.
- Liu Y, Liu Y, Huang H. Genetic variation and natural hybridization among sympatric Actinidia species and the implications for introgression breeding of kiwifruit. Tree Genet. Genomes. 2010;6(5):801–813. doi: 10.1007/s11295-010-0293-y.
- Hamrick JL, Godt MJW. Allozyme diversity in cultivated crops. Crop Sci. 1997;37(1):26–30. doi: 10.2135/cropsci1997.0011183X003700010004x.
- Guo R, Zhang YH, Zhang HJ, et al. Molecular phylogeography and species distribution modelling evidence of ‘oceanic’ adaptation for Actinidia eriantha with a refugium along the oceanic-continental gradient in a biodiversity hotspot. BMC Plant Biol. 2022;22(1):89. doi: 10.1186/s12870-022-03464-5.