
Abstract
Individual-level factors and country-level determinants influence our satisfaction; therefore, the single-level models that prevail in the analyses of subjective well-being are not appropriate. Thus, this article aims to add a multilevel perspective to the understanding of self-reported well-being. We analyse the impact of gross national income on the life satisfaction of individuals. We develop a two-level regression model based on the existing ‘economics of happiness’ literature. Factors describing an individual’s characteristics are included at the within level, measures describing the social situation are included at both levels, while a nation’s income, inflation and unemployment rates are between-level variables. In order to obtain the moderating effects of gross national income per capita on the influence of individuals’ relative incomes, a random intercept and random intercept-random slope model are tested using the cross-sectional data from the last wave of the World Values Survey. Our results support the hypotheses that the impact of relative income on subjective well-being decreases with the development of a country.
1. Introduction
The idea of using self-assessed life satisfaction or happiness as a way of evaluating the quality of a society goes back to Aristotle (Helliwell, Citation2003). In the past two decades, there has been considerable development in the economics of subjective well-being, which is reflected in the number of articles considering quality of life and its determinants in mainstream economic journals (Dolan, Peasgood, & White, Citation2008). Stiglitz, Amartya, and Fitoussi (Citation2009) argue that ‘subjective well-being should be measured separately to derive a more comprehensive measure of people’s quality of life and to allow a better understanding of its determinants (including people’s objective conditions)’.
Experiments have shown the need to distinguish between happiness (pleasant or unpleasant affect; emotion) and life satisfaction, as they are separable constructs (Clark & Senik, Citation2011; Diener, Suh, Lucas, & Smith, Citation1999; Fleche, Smith, & Sorsa, Citation2011). Happiness is more dependent on short-term circumstances, whereas life satisfaction is less affected by momentary situations. Thus, the majority of research in economics focuses on some measure of life satisfaction, although this field is best known as ‘economics of happiness’.
Clark, Frijters, and Shields (Citation2008) provide a literature review of the evidence regarding the impact of relative and absolute income on subjective well-being. In most developed countries, economic growth does not lead to greater life satisfaction, while for poorer countries there is a positive relationship between income growth and increases in subjective well-being. This can be explained by diminishing marginal utility and is known as the Easterlin paradox. Easterlin (Citation1974, p. 118) was the first to empirically show that ‘national comparisons among countries and over time show an association between income and happiness which is so much weaker than, if not inconsistent with, that shown by within-country comparisons’.
Still, a positive correlation between average subjective well-being and national income has been proven by a number of studies utilising cross-section (Alesina, Di Tella, & MacCulloch, Citation2004; Di Tella, MacCulloch, & Oswald, Citation2003; Fahey & Smyth, Citation2004; Helliwell, Citation2003) or panel data (Ferrer-i-Carbonell & Frijters, Citation2004; Sacks, Stevenson, & Wolfers, Citation2010; Winkelmann & Winkelmann, Citation1998). There is less consensus, however, on the impact of increases in income on life satisfaction over time (Fleche et al., Citation2011).
Many studies suggest that relative income dominates the absolute income effect (e.g., Clark & Oswald, Citation1996; Easterlin, Citation1974, Citation1995; Luttmer, Citation2005). Different authors define reference groups differently, but they all find evidence that a person’s subjective well-being depends on social comparison with others within their reference group. These reference groups can be defined on the basis of similarity in personal characteristics (Ferrer-i-Carbonell, Citation2005; McBride, Citation2001) or with regard to geographic proximity (Helliwell & Putnam, Citation2007; Kingdon & Knight, Citation2006; Luttmer, Citation2005).
In a recent study, Clark and Senik (Citation2011) used data from the European Social Survey to show that people mostly compare their incomes with those who are better off. This finding is in line with the concept of relative deprivation, which was formulated by Runciman (1966, quoted in Hey & Lambert, Citation1980). An individual’s relative deprivation is caused by every income unit that he lacks in comparison to all individuals within his reference group (Bossert & D’Ambrosio, Citation2006; Stark & Hyll, Citation2011).
Clark et al. (Citation2008) show how relative and absolute income can be combined within a single model. They predict that the gradient between income and happiness is steeper within a country at a specific point in time rather than over time by country. Because the status is a zero-sum game (higher status for one results in a lower status for someone else), it does not have any influence on the average level of satisfaction in the country, and, over time, only absolute income has an effect on well-being.
Stevenson and Wolfers (Citation2013) tested the claim that there is some critical level of income beyond which income no longer impacts well-being. Using single level models, they analysed multiple datasets and different definitions of basic needs. However, they were not able to find any support for the idea of satiation either in comparison of rich and poor countries or in comparison of rich and poor individuals within countries.
Two other economic factors (besides income) that are most often mentioned in relation to subjective well-being are unemployment and inflation. The unemployed have 5–15% lower well-being scores than the employed (Dolan et al., Citation2008). Winkelmann and Winkelmann (Citation1998) showed that the negative effect of personal unemployment is much stronger than the effect of non-participation. In a recent study based on US data, Helliwell and Huang (Citation2014) found evidence that local unemployment lowers the subjective well-being of the rest of the population (not unemployed). Alesina et al. (Citation2004) were able to show a negative correlation between the well-being and unemployment rates in the US, but failed to do the same with European data.
Among others, Di Tella, MacCulloch, and Oswald (Citation2001) analysed the effect of inflation on well-being and they found a consistent negative effect for European countries in the period 1975–1991, while the results for the US were not so well defined. In a recent study, Welsch and Kühling (Citation2016) used data from 25 Organisation for Economic Co-operation and Development (OECD) countries to show that during the macroeconomic crisis of 2008–2009, the decrease in subjective well-being level was driven by the drop in GDP and increased unemployment. On the other hand, lower inflation rates reduced the negative effect of the macroeconomic crisis.
Non-economic factors are important as well. Empirical studies usually find social contact and health to be strongly correlated with subjective well-being (Fleche et al., Citation2011). Other factors include safety (Dolan et al., Citation2008), personal characteristics (Blanchflower & Oswald, Citation2004), education (Stutzer, Citation2004) and degree of democracy (Frey & Stutzer, Citation2000). Potential determinants of well-being can be divided into seven broader groups: income, personal characteristics, socially developed characteristics, how time is spent, attitudes and beliefs towards self/others/life, relationships, and the wider economic, social and political environment (Dolan et al., Citation2008). These influences occur at different levels, ranging from the individual level to the regional or national levels. Despite this fact, almost all studies to date have been done on a single level, and few exist that include two levels or more (Ballas & Tranmer, Citation2012; Carr, Elliot, & Tranmer, Citation2011; Frey & Stutzer, Citation2002; Helliwell, Citation2003; Schyns, Citation2002).
The empirical part of the article is based on the last available (sixth) wave of the World Values Survey, which was conducted between 2010 and 2014. The World Values Survey dataset is combined with country-level data, including the gross national income per capita, unemployment and inflation rates from the World Bank database. Altogether, there are 40 countries in the final sampleFootnote1 (see Table ), and the sample size on an individual level is 50,161 observations, which means the average size of a cluster is 1,254 units. The number of countries in the sample is big enough for our purpose, since by the rule of thumb we need at least 30 clusters to analyse the contextual effects (Maas & Hox, Citation2004).
Table 1. List of countries in the sample.
The literature review above highlighted a number of open questions. In our empirical study, we focus on two that we find most important and interesting:
| 1. | Which individual-level and country-level variables affect the life satisfaction of individuals? | ||||
| 2. | Does a different level of economic development change the impact of relative income on subjective well-being? | ||||
2. Why choose a multilevel modelling approach?
As mentioned in the previous section, subjective well-being is determined by factors on different levels, ranging from the individual level to the country level. A problem that concerns the relationships between the variables measured at a number of different hierarchical levels is a multilevel problem (Hox, Citation1995). Because of this multilevel structure, a single-level analysis may be flawed. An analysis that is carried out at the individual level may miss important group-level effects, a problem often referred to as the atomistic fallacy (Russo, Citation2008). On the other hand, a single-level analysis at the group level cannot be used to make assumptions at the individual level. Individuals are nested within nations, and they tend to share certain common values (Arzenšek, Košmrlj, & Trunk Širca, Citation2014). Thus, a person’s subjective well-being is not only a result of his individual characteristics but also of some national-level variables.
The next important reason for choosing a multilevel analysis lies in the data. As is common in the empirical studies on the determinants of well-being (Ballas & Tranmer, Citation2012; Helliwell, Citation2003; Helliwell, Barrington-Leigh, Huang, & Harris, Citation2009), the data we are using stem from a two-stage sampling design, where in the first stage the primary units (countries) are sampled, and then a random sample of secondary units (individuals) is taken.
The third important argument for a two-level analysis is based on previous studies, which have shown the difference in importance of certain factors in more or less developed countries. A simple panel data analysis with random or fixed effects is therefore not adequate because it does not allow for different slopes.
Despite an obvious need for a multilevel modelling approach, this method is seldom used. Using a two-level model rather than a standard single-level regression has a big advantage in that it is possible to differentiate, in a single model, between several effects: the main effects of context or macro-level variables, the main effects of individual-level variables, and the possible interaction effects between the two levels. With multilevel models, it is also possible to deal with complex variation at different levels – it does not treat individuals or nations as having the same error variance (Schyns, Citation2002).
3. Data and model
In the choice of variables that are included in our model, we mostly follow Frey and Stutzer (Citation2002), who divide the determinants of subjective well-being into three broader groups: socio-demographic factors (age, gender, number of children, marital status, education, health and nationality), economic factors (unemployment, income and inflation) and institutional determinants (level of democracy and decentralisation) of perceived quality of life. In our model, we include all these factors except decentralisation, which was left out because of unavailability of data for a large share of countries. The decision to follow the selection of determinants of subjective well-being (SWB) from a well-cited book by Frey and Stutzer (Citation2002) was based on three reasons: firstly, this selection of factors was already thoroughly tested in the economic literature; secondly, this selection of explanatory variables covers all topics of interest to us; and thirdly, it enables us to keep the sample size of individuals and countries as big as possible.Footnote2
Age, gender, marital status, children, health, nationality and education are clearly individual-level factors, while inflation is strictly a macroeconomic variable. Other factors (income, perceived level of democracy, and unemployment) are mixed, which means that they are included in our model at the individual and contextual levels.
As mentioned earlier, most of the data stem from the sixth wave of the World Values Survey. The exception is macroeconomic variables (unemployment and inflation rate, gross national income per capita), which are taken from the World Bank database. Gross national income per capita was logged for the purpose of the analysis due to the distribution properties of this variable. Almost all macroeconomic variables correspond to the year of the survey in a particular country, but in some cases the data from the previous year had to be used because the World Bank does not yet provide data for that year.
The dependent variable in the model is subjective well-being. In the survey, the respondents were asked directly to evaluate their satisfaction with life on a scale from 1 (dissatisfied) to 10 (satisfied). The following question was used: ʻAll things considered, how satisfied are you with your life as a whole these days?ʼ
Some might argue that subjective well-being is a multidimensional phenomenon and therefore must be measured with a multi-item scale to minimise measuring errors. The evidence from the literature shows that this is not necessary.
Sandvik, Diener, and Seidlitz (Citation1993) used a sample of 136 college students to examine the validity of self-reported measures of subjective well-being. A principal axis factor analysis revealed a single unitary construct underlying the self- and non-self-reports of subjective well-being measures. Furthermore, they were able to prove a considerable cross-situational consistency and temporal stability of subjective well-being. These results have been later confirmed by other studies (e.g., Ehrhardt, Saris, & Veenhoven, Citation2000). Eid and Diener (Citation2004) used a sample of 249 students to construct a structural model to estimate reliability. Their results show that the imputed stability for life satisfaction was around 0.90 after controlling for the influence of situation-specific factors. Measures of self-reported well-being are also strongly correlated with the frequency of ʻunfakeableʼ or Duchenne smiles and with levels of the stress hormone cortisol (Fleche et al., Citation2011).
State of health was measured by a subjective self-evaluation of the respondents. A five-point scale was used, where 1 means very good and 5 very bad health. Education level was recoded in years of education.Footnote3 The level of democracy in the country was measured (subjectively) using a 10-point scale, where 1 means ‘not at all democratic’ while 10 is ‘completely democratic’. At the micro level, income was not measured in absolute value but rather as a decile-like groupFootnote4 in which each individual falls according to his income. Individual unemployment and nationality were measured by dummy variables. We assigned the number 1 to all unemployed persons, and the value 0 was assigned to respondents with any other status (employed, self-employed, retired, student, etc.). We also used dummy variables for single living (0 for being a member of a couple, 1 for being single) and having children (0 for no children and 1 for any number of children). Similarly, a value of 1 was assigned to all persons who were immigrants, and a value of 0 was assigned to all non-immigrants. Our proxy for nationality was whether an individual was an immigrant. The reason behind this decision is that cultural differences between nations are already taken into account by the structure of the model.Footnote5 Thus, we found it more interesting to discover whether persons who have moved to a foreign country experience different subjective well-being to those who were born there.
To check for possible common method bias, Harman’s single factor test was performed on the data gathered from the World Values Survey. In this test, all four self-reported variablesFootnote6 were included, and the results showed that one common factor only explains 33.4% of the whole variation, which means that bias does not exist or is very low.
3.1. Two-level model with random intercept
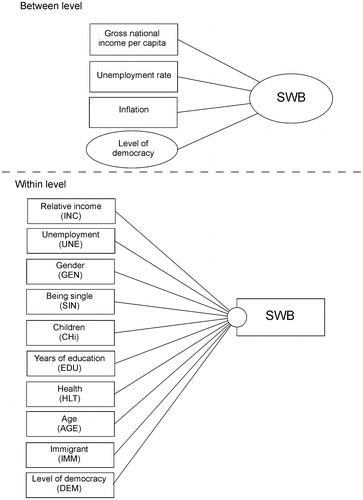
The basic model, which is presented in Figure , consists of nine factors at the individual level, three factors at the country level, and one factor at both the individual and contextual levels.
Figure 1. Two-level model of subjective well-being with random intercepts. Source: Own figure.
We treat the subjective well-being measure as cardinal, which is in line with the findings of Diener, Diener, and Diener (Citation1995), Frey and Stutzer (Citation2000), Ferrer-i-Carbonell and Frijters (Citation2004) and Bechtel (Citation2007). Frey and Stutzer (Citation2000, p. 924) have proven that ‘the least squares estimation that treats happiness as a cardinal variable offers qualitatively very similar results to the ordered probit model’. Ferrer-i-Carbonell and Frijters (Citation2004, p. 654), who compared the results of ordinary least squares (OLS) and an ordered logit model, came to the same conclusion that ‘the assumption of cardinality or ordinality does not qualitatively change the results’. Other researchers (e.g., Easterlin, Citation1974, Citation1995) often implicitly assume subjective well-being as a cardinal variable when they compare average well-being across countries.
A robust maximum likelihood estimator is used, which yields parameter estimates with standard errors and a chi-square test statistic that are robust to non-normality and non-independence of observations. The robust standard errors are calculated using the so-called Huber/White or sandwich estimator.
The same model can also be expressed with the following equation:(1)
where γg0(g = 1, …, 10) are regression coefficients for level-one explanatory variables, γh0(h = 1, …, 4) are regression parameters for level-two explanatory variables, and e0j and rij are the level-two and level-one residuals. The subscript j is for countries (j = 1, …, J), and the subscript i is for individuals .
This model can also be rewritten as a combination of two equations, representing within- and between-group regression, respectively.
Within-group regression:
(2)
Between-group regression:
(3)
In the random intercept model with fixed slopes βh0 = γh0.
3.2. Two-level model with random intercept and random slope
In the second step of the empirical analysis, we change the model slightly to test our hypothesis that in more developed countries the influence of relative income on subjective well-being is smaller than in less developed countries.Footnote7 The new adapted model that includes a random slope is presented in Figure .
Figure 2. Two-level model of subjective well-being with random intercept and random slopes. Source: Own figure.
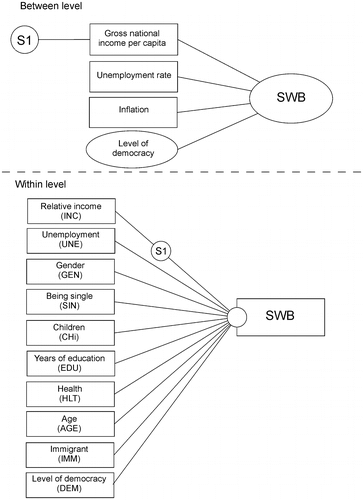
Similar to the first model, we can define the second with a combination of equations. In addition to the two equations that we already know from our basic model, we now have to define the relation between the slope (s1) and gross national income per capita:
(4)
while the other two equations do not change.
Once again, this model can be written with a single equation:(5)
where γh0 = βh0 for all h ≥ 2.
The level-two residuals and the level-one residuals eij have the conditional mean 0 (given the values of explanatory variable). r1jINCij + r0j + eij is called the random part, while the rest of the equation is the so-called fixed part (Snijders & Bosker, Citation2012).
The term r1jINCij is a random interaction between country and relative income. In a model with random intercept and random slope, there are two random effects. These two effects are assumed to be independent but correlated. This means that, for different groups, the pairs of random effects () are i.i.d., and they are independent of eij. All eij are i.i.d. as well. We denote the variances and covariance of residuals as follows (Snijders & Bosker, Citation2012):
(6)
4. Results and discussion
The estimates for both models (see Table ) are in line with the theory. State of health,Footnote8 age, level of democracy and relative income are positively correlated with the self-reported level of well-being. Even though we control for multiple personal and socio-economical characteristics, women experience higher subjective well-being than men by around 0.13 points. Single persons experience lower subjective well-being than members of a couple. Those who have children are less satisfied. Being an immigrant or having more years of education has no significant effect on subjective well-being. Unemployed persons have significantly lower well-being scores – by around 0.27 points – even though the impact of lower relative income is also taken into account.
Table 2. Estimates for random intercept and random slope models.
In the model without random slope, the average level of democracy and the gross national income per capita are the only contextual-level variables for which we could prove significant and positive effect on the average level of subjective well-being. The average level of democracy becomes insignificant in the random slope model.
The most important result of the analysis is the change in effect of GNI per capita between the two models. In both models, the impact of this contextual-level variable is significant and positive. In the basic random intercept model, an increase of GNI per capita by 1% increases the subjective well-being by 0.204 points. However, when the random slope of relative income was allowed for, the impact of GNI per capita became much stronger. The new partial regression coefficient is 0.465, more than two times higher than in the basic model.
If we take a closer look at the regression coefficient of relative income in both models, we can see that the correlation between relative income and subjective well-being is positive in both cases. In the first model, where all the slopes were kept fixed, this coefficient is 0.204. In the second model, we tried to find out if the impact of relative income depends on a country’s level of development. The results of the empirical analysis support the hypothesis that in richer countries the income of an individual becomes a less important factor in determining subjective well-being. The estimated slope coefficient of relative income in the random slope model is:
(7)
which means that higher GNI per capita significantly reduces the impact of relative income on subjective well-being. Since we use the natural log of GNI per capita, this result shows that every 1% increase of GNI per capita reduces the impact of relative income group on subjective well-being by 0.04 points.
From the results in Table , we can see that Akaike and Bayesian information criteria both favour the second model. Using the expression exp((AICmin - AICi)/2), we checked if the difference between the two models is significant. The probability that the first model minimises the information loss is 0.000, which means that the second model is clearly better.
For the robustness test, the same two models were applied to the data from the fifth wave of the World Values Survey, which covers the period from 2005 to 2008 and includes a different set of countries. The results are almost identical and confirm all of our major findings (see Appendix A).
In Appendix B, we present an additional estimation. The preferred, random intercept and random slope model is extended with further explanatory variables. Following Dolan et al. (Citation2008), three potential factors of subjective well-being were added. These are trust, religiosity and community involvement. Once again, the results are in line with the estimates in Table . Partial regression coefficients of all explanatory variables that were already included in the main model are almost unchanged. All three newly added factors (trust, religiosity and community involvement) show positive effect on subjective well-being.
5. Conclusion
An obvious multilevel problem is still analysed primarily with single-level models. With a two-level analysis, we were able to disentangle the effects of individual- and country-level variables and provide additional insight into the determinants of subjective well-being. The results of many previous single-level studies have been confirmed in a two-level environment (positive impact of relative income, perceived level of democracy, age and state of health, negative effect of being unemployed or single), but some others were not (insignificant effect of education on subjective well-being). In contrast to some previous studies, our results show that children reduce the subjective well-being of their parents.
As already mentioned in the literature review, existing studies on the effect of unemployment and inflation rate on subjective well-being show mixed results; some researchers found negative relation between these two factors and subjective well-being, while other authors did not find any statistically significant influence. In the two models from our study, both effects were insignificant as well. On the other hand, the impact of gross national income per capita was significant and positive. The big difference in the value of the partial regression coefficient between the two models suggests that it is very important to choose the right approach. Based on our results, we are strongly convinced that the reason many researchers did not find any significant effect of some measure of a nation’s wealth on subjective well-being lies in the inadequate single-level modelling approach.
According to the information criteria, the random slope model is better, and it shows a clear relation between the level of development (measured by GNI per capita) and the influence of relative income on the subjective well-being of an individual. Relative income is more important in poorer countries, where GNI per capita is lower, and it becomes less important in richer countries. A probable explanation for this relation is that being poor in less developed countries means that an individual is deprived of necessary goods, while being relatively poor in highly developed countries does not result in the deprivation of food, water, electricity, shelter and similar goods. This result cannot be explained by decreasing marginal utility, as we have used the natural log of GNI per capita for the countries and income groups for the individuals (distribution of income is skewed to the right, and therefore the absolute difference in incomes is larger between higher income groups).Footnote9
The obtained results on the effect of national and personal income on subjective well-being are robust. An estimation based on a dataset from a different time period and a model with a different set of explanatory variables both show positive effect of GNI per capita and relative income on subjective well-being, while the moderating effect of GNI per capita is negative.
We are strongly convinced that the findings of this study need and deserve to be further examined because they are crucial for the understanding of what people gain from the development of national economies. By understanding what makes us more satisfied with our lives individually – and in society as a whole – we can allocate our scarce resources in a more effective way. An interesting question for further study is whether the behaviour of people adapts to the development of the country or whether individuals continue to invest the same amount of time and effort to increase their income.
Disclosure statement
No potential conflict of interest was reported by the authors.
Notes
1. The survey was done in 49 countries, but some questions that are relevant for our research were not asked in all of them. Some countries were left out of the analysis because the World Bank does not provide the data on some or all three macroeconomic variables.
2. In Appendix B, we present a model with a selection of determinants that, depending on the availability of data in the World Values Survey database, mostly follows the previously mentioned review paper by Dolan et al. (Citation2008). The estimation of this extended model serves also as an additional robustness test. With each additional variable, the sample size reduces significantly.
3. No formal education = 0, incomplete primary school = 4, primary school = 8, incomplete secondary school = 10, secondary technical/vocational education = 11, secondary university preparatory education = 12, some university = 14, and university-level education = 16 years.
4. Each respondent self-ranks himself in one of the 10 income groups.
5. This is the error term in the between-group regression. It will be denoted as r0j later in the article.
6. These are state of health, subjective well-being, scale of incomes and level of democracy.
7. Although the measure of relative deprivation is not part of our model, its concept is closely related to the relative income. If we are able to show that the relative income is less important in more developed countries, the same should be true for the relative deprivation as well.
8. Inverted scale: 1 = very good, 5 = very poor.
9. (Yi+1 − Yi) > (Yi − Yi-1), where Yi is the income of income group i and i = 2, …, 9.
Related Research Data
References
- Alesina, A., Di Tella, R., & MacCulloch, R. (2004). Inequality and happiness: Are Europeans and Americans different? Journal of Public Economics, 88, 2009–2042.10.1016/j.jpubeco.2003.07.006
- Arzenšek, A., Košmrlj, K., & Trunk Širca, N. (2014). Slovenian young researchers’ motivation for knowledge transfer. Higher education, 68, 185–206.10.1007/s10734-013-9702-0
- Ballas, D., & Tranmer, M. (2012). Happy people or happy places? A multilevel modeling approach to the analysis of happiness and well-being. International Regional Science Review, 35, 70–102.10.1177/0160017611403737
- Bechtel, T. G. (2007). The pursuit of happiness. Survey Research Methods, 2, 109–120.
- Blanchflower, D. G., & Oswald, A. J. (2004). Money, sex and happiness: An empirical study. Scandinavian Journal of Economics, 106, 393–415.10.1111/sjoe.2004.106.issue-3
- Bossert, W., & D’Ambrosio, C. (2006). Reference groups and individual deprivation. Economics Letters, 90, 421–426.10.1016/j.econlet.2005.10.003
- Carr, E., Elliot, M., & Tranmer, M. (2011). A multilevel analysis of the relationship between national economic conditions, an individual’s job insecurity and well-being in Western Europe. CCSR Paper, 5, 2011–2011.
- Clark, A., & Oswald, A. (1996). Satisfaction and comparison income. Journal of Public Economics, 61, 359–381.10.1016/0047-2727(95)01564-7
- Clark, A., & Senik, C. (2011). Is happiness different from flourishing? Cross-country evidence from the ESS. Revue d’Économie Politique, 121, 17–34.10.3917/redp.211.0017
- Clark, A., Frijters, P., & Shields, M. A. (2008). Relative income, happiness, and utility: An explanation for the easterlin paradox and other puzzles. Journal of Economic Literature, 46, 95–144.10.1257/jel.46.1.95
- Di Tella, R., MacCulloch, R., & Oswald, A. (2001). Preferences over inflation and unemployment. Evidence from surveys of happiness. The American Economic Review, 91, 335–341.10.1257/aer.91.1.335
- Di Tella, R., MacCulloch, R., & Oswald, A. (2003). The macroeconomics of happiness. The Review of Economics and Statistics, 85, 809–827.10.1162/003465303772815745
- Diener, E., Diener, M., & Diener, C. (1995). Factors predicting the subjective well-being of nations. Journal of Personality and Social Psychology, 69, 851–864.10.1037/0022-3514.69.5.851
- Diener, E., Suh, E. M., Lucas, R. E., & Smith, H. L. (1999). Subjective well-being: Three decades of progress. Psychological Review, 125, 276–302.
- Dolan, P., Peasgood, T., & White, M. (2008). Do we really know what makes us happy? A review of the economic literature on the factors associated with subjective well-being. Journal of Economic Psychology, 29, 94–122.10.1016/j.joep.2007.09.001
- Easterlin, R. (1974). Does economic growth improve the human lot? Some empirical evidence. In R. David & R. Reder (Eds.), Nations and households in economic growth: Essays in honor of Moses Abramovitz (pp. 89–125). New York, NY: Academic Press.
- Easterlin, R. (1995). Will raising the incomes of all increase the happiness of all. Journal of Economic Behaviour and Organization, 27, 35–47.10.1016/0167-2681(95)00003-B
- Ehrhardt, J. J., Saris, W. E., & Veenhoven, R. (2000). Stability of life-satisfaction over time. Journal of Happiness Studies, 1, 177–205.10.1023/A:1010084410679
- Eid, M., & Diener, E. (2004). Global judgments of subjective well-being: Situational variability and long-term stability. Social Indicators Research, 65, 245–277.10.1023/B:SOCI.0000003801.89195.bc
- Fahey, T., & Smyth, E. (2004). Do subjective indicators measure welfare? Evidence from 33 European societies. European Societies, 6, 5–27.10.1080/1461669032000176297
- Ferrer-i-Carbonell, A. (2005). Income and well-being: An empirical analysis of the comparison income effect. Journal of Public Economics, 89, 997–1019.10.1016/j.jpubeco.2004.06.003
- Ferrer-i-Carbonell, A., & Frijters, P. (2004). How important is methodology for the estimates of the determinants of happiness. The Economic Journal, 114, 641–659.10.1111/j.1468-0297.2004.00235.x
- Fleche, S., Smith, C., & Sorsa, P. (2011). Exploring determinants of subjective wellbeing in OECD Countries: Evidence from the world value survey ( OECD Economics Department Working Papers, 921). Paris: OECD Publishing.
- Frey, B. S., & Stutzer, A. (2000). Happiness, economy and institutions. The Economic Journal, 110, 918–938.10.1111/ecoj.2000.110.issue-466
- Frey, B. S., & Stutzer, A. (2002). Happiness and economics. Princeton: University Press.
- Helliwell, J. F. (2003). How’s life? Combining individual and national variables to explain subjective well-being. Economic Modelling, 20, 331–360.10.1016/S0264-9993(02)00057-3
- Helliwell, J. F., & Huang, H. (2014). New measures of the costs of unemployment: Evidence from the subjective well-being of 3.3 million Americans. Economic Inquiry, 52, 1485–1502.10.1111/ecin.2014.52.issue-4
- Helliwell, J. F., & Putnam, R. B. (2007). Education and social capital. Eastern Economic Journal, 33(1), 1–19.10.1057/eej.2007.1
- Helliwell, J. F., Barrington-Leigh, C. P., Huang, H., & Harris, A. (2009). International differences in the determinants of life satisfaction. In T. Ray, E. Somanathan, & B. Dutta (Eds.), New and enduring themes in development economics (pp. 3–40). Singapore: World Scientific.10.1142/SSIR
- Hey, J. D., & Lambert, P. J. (1980). Relative deprivation and Gini coefficient: Comment. The Quarterly Journal of Economics, 95, 567–573.10.2307/1885094
- Hox, J. J. (1995). Applied multilevel analysis. Amsterdam: TT-Publikaties.
- Kingdon, G. G., & Knight, J. B. (2006). Subjective well-being poverty vs. income poverty and capabilities poverty? Journal of Development Studies, 42, 1199–1224.10.1080/00220380600884167
- Luttmer, E. F. P. (2005). Neighbors as negatives: Relative earnings and well-being. The Quarterly Journal of Economics, 20, 963–1002.
- Maas, C. J. M., & Hox, J. J. (2004). Robustness issues in multilevel regression analysis. Statistica Neerlandica, 58, 127–137.10.1046/j.0039-0402.2003.00252.x
- McBride, M. (2001). Relative-income effects on subjective well-being in the cross-section. Journal of Economic Behavior and Organization, 45, 251–278.10.1016/S0167-2681(01)00145-7
- Russo, F. (2008). Causality and causal modelling in the social sciences: Measuring variations. New York, NY: Springer.
- Sacks, D., Stevenson, B., & Wolfers, J. (2010). Subjective well-being, income, economic development, and growth ( NBER Working Paper 16441). Cambridge, MA: National Bureau of Economic Research.
- Sandvik, E., Diener, E., & Seidlitz, L. (1993). Subjective well-being: The convergence and stability of self-report and non-self-report measures. Journal of Personality, 61, 317–342.10.1111/jopy.1993.61.issue-3
- Schyns, P. (2002). Wealth of nations, individual income and life satisfaction in 42 countries: A multilevel approach. Social Indicators Research, 58, 5–40.
- Snijders, T. A. B., & Bosker, R. J. (2012). Multilevel analysis: An introduction to basic and advanced multilevel modeling. London: Sage.
- Stark, O., & Hyll, W. (2011). On the economic architecture of the workplace: Repercussions of social comparisons among heterogenous workers. Journal of Labor Economics, 29, 349–375.10.1086/659104
- Stevenson, B., & Wolfers, J. (2013). Subjective well-being and income: Is there any evidence of satiation? ( CESifo Working Paper 4222). Munich: Center for Economic Studies and Ifo Institute.
- Stiglitz, J., Amartya, S., & Fitoussi, J. P. (2009). Report by the commission on the measurement of economic performance and social progress. Retrieved from http://www.stiglitz-sen-fitoussi.fr/documents/rapport_anglais.pdf
- Stutzer, A. (2004). The role of income aspirations in individual happiness. Journal of Economic Behaviour and Organisation, 54, 89–109.10.1016/j.jebo.2003.04.003
- Welsch, H., & Kühling, J. (2016). How has the crisis of 2008–09 affected subjective well-being? Evidence from 25 OECD countries. Bulletin of Economic Research, 68, 34–54.10.1111/boer.12042
- Winkelmann, L., & Winkelmann, R. (1998). Why are the unemployed so unhappy? Evidence from panel data. Economica, 65, 1–15.
Appendix A
In Table A, we present the results obtained from the empirical analysis based on the fifth wave of the World Values Survey. The only difference in the models is that the dummy variable for immigration was left out due to non-availability of data. Remember that the effect of this variable was insignificant in both models (see Table ). The dataset includes 39 countries and 46,153 units of observation.
Table A. Estimates for random intercept and random slope model (WVS 5th wave).
Notes: Significance levels are denoted by ** p < 0.01 and * p < 0.05. GNI per capita is in logs.
Source: Own calculations.
Appendix B
As mentioned in the literature review, Dolan et al. (Citation2008) divide potential determinants of SWB into seven broader groups. Based on their paper and the availability of data, we use the following extended list of explanatory variables, divided into groups:
| 1 | Income: relative income | ||||
| 2 | Personal characteristics: age, gender, immigrant | ||||
| 3 | Socially developed characteristics: education, health, unemployment | ||||
| 4 | How time is spent: community involvement | ||||
| 5 | Attitudes and beliefs towards self/others/life: trust, religiosity | ||||
| 6 | Relationships: being single, having children | ||||
| 7 | Wider economic, social and political environment: unemployment rate, inflation rate, national income and level of democracy | ||||
Table B. Estimates for random intercept and random slope model based on Dolan et al. (Citation2008).
Notes: Significance levels are denoted by ** p < 0.01 and * p < 0.05. GNI per capita is in logs.
Source: Own calculations.